Ceramic Balls Market by Function (Inert, and Active) Material (Silicon, Alumina, Zirconia), Application (Bearing, Grinding, valve), End-Use Industry (Automotive, Chemical, Aerospace), and Region - Global Forecast to 2023


[118 Pages Report] Ceramic Balls Market was valued USD 404.7 million in 2017 and is projected to reach USD 636.3 million by 2023, at a CAGR of 8.0% during the forecast period. The demand for ceramic balls is expected to increase significantly during the forecast period owing to its widespread usage in various end-use industries such as automotive, chemical, and aerospace. In this study, the years considered to estimate the market size for ceramic balls are listed below:
- Base Year � 2017
- Estimated Year � 2018
- Projected Year � 2023
- Forecast Period � 2018�2023
2017 is considered as the base year for company profiles. Where information was not available for the base year, the previous year was considered.
Objectives of the Study:
- To analyze and forecast the size of the ceramic balls market, in terms of value
- To provide detailed information regarding key factors, such as drivers, restraints, opportunities, and challenges, influencing the growth of the ceramic balls market
- To define, describe, and forecast the ceramic balls market based on function, material, application, and end-use industry
- To analyze and forecast the size of the ceramic balls market in North America, Europe, Asia Pacific (APAC), the Middle East & Africa (MEA), and Latin America
- To strategically profile key players operating in the ceramic balls market and analyze their core competencies
- To analyze market opportunities and the competitive landscape for stakeholders and market leaders
- To analyze competitive developments, such as partnerships, expansions, acquisitions, and new product developments undertaken by key market players
Various secondary sources, such as Factiva, Hoovers, and Manta have been used to gain insights into the ceramic balls market. Experts from leading companies manufacturing ceramic balls have been interviewed to verify and collect critical information and assess the trends in the ceramic balls market during the forecast period. The top-down, bottom-up, and data triangulation approaches have been implemented to calculate the exact values of the overall parent and each individual market sizes.
To know about the assumptions considered for the study, download the pdf brochure
The market for ceramic balls has a diversified and established ecosystem comprising upstream players, such as raw material suppliers and downstream stakeholders, including manufacturers, vendors, and end users of ceramic balls as well as various government organizations. Leading players operating in the ceramic balls market include Axens (France), Honeywell International (US), Saint-Gobain (France), Industrial Tectonics Inc. (US), Global Precision Ball & Roller (US), Fineway Inc. (Canada), Toshiba Materials Co. Ltd. (Japan), Coorstek Inc. (US), and Metalball (France).
Target Audience
- Manufacturers of ceramic balls
- Suppliers of raw materials
- Distributors and suppliers of ceramic balls
- End-use industries
- Industry associations
�This study answers several questions for stakeholders, primarily which market segments they need to focus on in the next 2�5 years to prioritize their efforts and investments.�
Scope of the Report:
This research report categorizes the ceramic balls market based on function, material, application, end-use industry, and region. It forecasts revenue growth and analyzes trends in each of these submarkets.
Ceramic Balls Market, by Material:
- Silicon
- Alumina
- Zirconia
- Others
Ceramic Balls Market, by Function:
- Inert ceramic balls
- Active ceramic balls
Ceramic Balls Market, by Application:
- Bearing
- Grinding
- Valve
- Others
Ceramic Balls Market, by Application:
- Bearing
- Grinding
- Valve
- Others
Ceramic Balls Market, by Region
- Asia Pacific (APAC)
- North America
- Europe
- Latin America
- Middle East & Africa (MEA)
Available Customizations
With the given market data, MarketsandMarkets offers customizations according to specific needs of companies. The following customization options are available for the report:
Product Analysis
- Product matrix, which offers a detailed comparison of the product portfolio of each company
Regional Analysis
- Further breakdown of the APAC ceramic balls market
- Further breakdown of the North American ceramic balls market
- Further breakdown of the European ceramic balls market
- Further breakdown of the Latin American ceramic balls market
- Further breakdown of the MEA ceramic balls market
Company Information
- Detailed analysis and profiles of additional 10 market players
The market size of ceramic balls is estimated at USD 433.0 million in 2018 and is projected to reach USD 636.3 million by 2023, at a CAGR of 8.0% between 2018 and 2023. The growth of the market can be attributed to the increasing use of ceramic balls in the automotive and chemical end-use industries owing to their superior properties such as resistance to corrosion & heat, durability, and high temperature resistance.
The ceramic balls market is segmented on the basis of function, material, application, end-use industry, and region. On the basis of material, the ceramic balls market has been classified into silicon, aluminum, zirconia, and others. The silicon-based ceramic balls market is projected to register the highest CAGR between 2018 and 2023. These ceramic balls offer properties such as excellent high temperature resistance and resistance to corrosion & heat, making them useful in different end-use industries. The demand for corrosion resistance and high temperature resistance properties is expected to drive the silicon-based ceramic balls market between 2018 and 2023.
On the basis of application, the ceramic balls market is classified into bearing, grinding, valve, and others. The ceramic balls market in bearing application is projected to register the highest CAGR during the forecast period. Silicon-based ceramic balls have good shock resistance properties that make them ideal for the bearing application. The ceramic balls used in bearings are harder than metal, which helps in reducing the contact with the bearing track.
On the basis of end-use industry, the ceramic balls market has been segmented into automotive, chemical, aerospace and others. The ceramic balls market in the automotive end-use industry is projected to register the highest CAGR between 2018 and 2023.
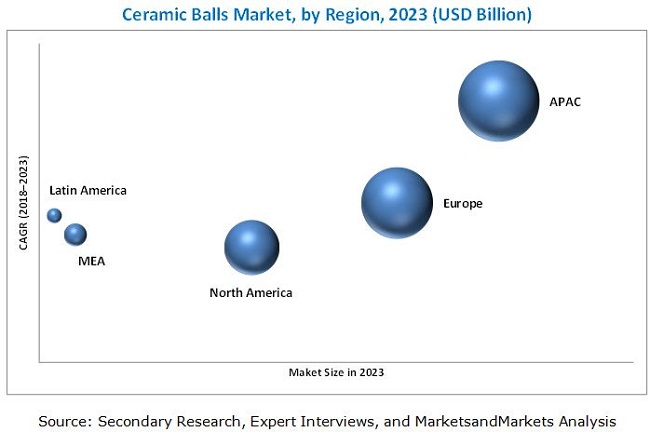
APAC is the largest market for ceramic balls in 2017. The growth of the ceramic balls market in APAC can be attributed to the expansion of the automotive end-use industry in this region. The demand for ceramic balls in different end-use industries is expected to increase considerably owing to the increasing FDI and growing industrialization in APAC.
Saint-Gobain (France), Honeywell International (US), Axens (France), Toshiba Materials Co., Ltd. (Japan), Coorstek Inc. (US), Fineway Inc. (Canada), Industrial Tectonics Inc. (US), Metalball (France), Global Precision Ball & Roller (US), Devson Catalyst Private Limited (India), and Topack Ceramics Pvt. Ltd. (India) are the key players operating in the ceramic balls market. These key players offer a wide range of ceramic balls to strengthen their competitive positions and cater to the growing demand from the automotive, chemical, and aerospace end-use industries.
Honeywell International (US) is a major player in the ceramic balls market. The company focuses on expanding its product portfolio and gaining a competitive edge in the market.
To speak to our analyst for a discussion on the above findings, click Speak to Analyst
 Exclusive indicates content/data unique to MarketsandMarkets and not available with any competitors.
Table of Contents
1 Introduction (Page No. - 15)
1.1 Objectives of the Study
1.2 Market Definition
1.3 Market Scope
1.3.1 Regional Segmentation
1.4 Currency
1.5 Limitations
1.6 Stakeholders
2 Research Methodology (Page No. - 19)
2.1 Research Data
2.1.1 Secondary Data
2.1.1.1 Key Data From Secondary Sources
2.1.2 Primary Data
2.1.2.1 Key Data From Primary Sources
2.1.2.2 Key Industry Insights
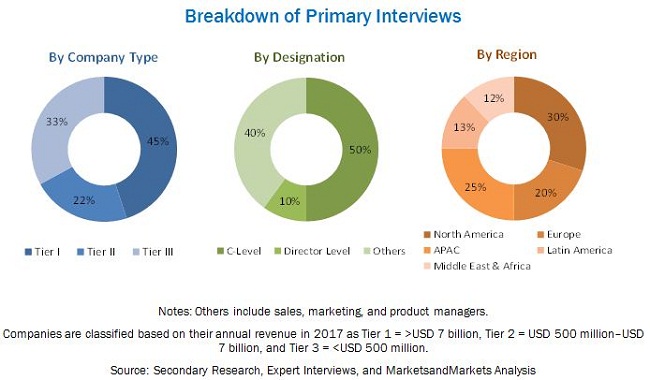
2.1.2.3 Breakdown of Primary Interviews
2.2 Market Size Estimation
2.2.1 Bottom-Up Approach
2.2.2 Top-Down Approach
2.3 Data Triangulation
2.4 Assumptions
3 Executive Summary (Page No. - 27)
4 Premium Insights (Page No. - 31)
4.1 Attractive Opportunities in the Ceramic Balls Market
4.2 Ceramic Balls Market, By Function
4.3 Ceramic Balls Market, By End-USE Industry
4.4 Ceramic Balls Market, By Material
4.5 Ceramic Balls Market, By End-USE Industry and Region
4.6 Ceramic Balls Market, By Country
5 Market Overview (Page No. - 34)
5.1 Introduction
5.1.1 Drivers
5.1.1.1 Superior Properties Offered By Ceramic Balls
5.1.1.1 Increasing USE of Ceramic Balls in the Automotive Industry
5.1.1.2 Increasing Demand From Chemical Industry
5.1.2 Restraints
5.1.2.1 High Cost of Production
5.1.3 Opportunities
5.1.3.1 Potential Opportunities in Medical Applications
5.1.3.2 Emerging Markets in APAC
5.1.3.3 Excellent Substitute to Steel Balls
5.1.4 Challenges
5.1.4.1 Need for Reducing the Cost of Manufacturing
5.2 Porter�s Five Forces Analysis
5.2.1 Threat of New Entrants
5.2.2 Threat of Substitutes
5.2.3 Bargaining Power of Suppliers
5.2.4 Bargaining Power of Buyers
5.2.5 Intensity of Competitive Rivalry
6 Macroeconomic Overview and Key Trends (Page No. - 41)
6.1 Introduction
6.2 Trends and Forecast of GDP
6.3 Trends in Automotive Industry
6.4 Trends of Aerospace Industry
7 Ceramic Balls Market, By Function (Page No. - 44)
7.1 Introduction
7.2 Inert Ceramic Balls
7.3 Active Ceramic Balls
8 Ceramic Balls Market, By Material (Page No. - 48)
8.1 Introduction
8.2 Silicon Based
8.3 Alumina Based
8.4 Zirconia Based
8.5 Others
9 Ceramic Ball Market, By Application (Page No. - 53)
9.1 Introduction
9.2 Bearing
9.3 Grinding
9.4 Valve
9.5 Others
10 Ceramic Balls Market, By End-USE Industry (Page No. - 58)
10.1 Introduction
10.2 Automotive
10.3 Chemical
10.4 Aerospace
10.5 Others
11 Ceramic Balls Market, By Region (Page No. - 63)
11.1 Introduction
11.2 North America
11.2.1 By Material
11.2.2 By Function Type
11.2.3 By Application
11.2.4 By End-USE Industry
11.2.5 By Country
11.2.5.1 US
11.2.5.1.1 US, By End-USE Industry
11.2.5.2 Canada
11.2.5.2.1 Canada, By End-USE Industry
11.3 Europe
11.3.1 By Material
11.3.2 By Function
11.3.3 By Application
11.3.4 By End-USE Industry
11.3.5 By Country
11.3.5.1 Germany
11.3.5.1.1 Germany, By End-USE Industry
11.3.5.2 France
11.3.5.2.1 France, By End-USE Industry
11.3.5.3 Spain
11.3.5.3.1 Spain, By End-USE Industry
11.3.5.4 UK
11.3.5.4.1 UK, By End-USE Industry
11.3.5.5 Italy
11.3.5.5.1 Italy, By End-USE Industry
11.3.5.6 Russia
11.3.5.6.1 Russia, By End-USE Industry
11.3.5.7 Rest of Europe
11.3.5.7.1 Rest of Europe, By End-USE Industry
11.4 APAC
11.4.1 By Material Type
11.4.2 By Function
11.4.3 By Application
11.4.4 By End-USE Industry
11.4.5 By Country
11.4.5.1 China
11.4.5.1.1 By End-USE Industry
11.4.5.2 Japan
11.4.5.2.1 Japan, By End-USE Industry
11.4.5.3 South Korea
11.4.5.3.1 South Korea, By End-USE Industry
11.4.5.4 India
11.4.5.4.1 India, By End-USE Industry
11.4.5.5 Indonesia
11.4.5.5.1 Indonesia, By End-USE Industry
11.4.5.6 Rest of APAC
11.4.5.6.1 Rest of APAC, By End-USE Industry
11.5 MEA
11.5.1 By Material
11.5.2 By Function
11.5.3 By Application
11.5.4 By End-USE Industry
11.5.5 By Country
11.5.5.1 Saudi Arabia
11.5.5.1.1 By End-USE Industry
11.5.5.2 South Africa
11.5.5.2.1 By End-USE Industry
11.5.5.3 UAE
11.5.5.3.1 By End-USE Industry
11.5.5.4 Rest of the MEA
11.5.5.4.1 By End-USE Industry
11.6 Latin America
11.6.1 By Material
11.6.2 By Function
11.6.3 By Application
11.6.4 By End-USE Industry
11.6.5 By Country
11.6.5.1 Brazil
11.6.5.1.1 By End-USE Industry
11.6.5.2 Mexico
11.6.5.2.1 By End-USE Industry
11.6.5.3 Argentina
11.6.5.3.1 By End-USE Industry
11.6.5.4 Rest of Latin America
11.6.5.4.1 By End-USE Industry
12 Competitive Landscape (Page No. - 90)
12.1 Overview
12.2 Amarket Ranking
12.3 Recent Developments
12.3.1 Expansion
12.3.2 Agreement & Partnership
13 Company Profiles (Page No. - 93)
13.1 Axens
13.2 Honeywell International
13.3 Saint-Gobain
13.4 Industrial Tectonics Inc.
13.5 Toshiba Materials Co., Ltd.
13.6 Global Precision Ball & Roller
13.7 Fineway Inc.
13.8 Coorstek, Inc.
13.9 Metalball
13.10 Devson Catalyst Private Limited
13.11 Topack Ceramics Pvt. Ltd.
13.12 Other Companies
13.12.1 Ningbo Tianyi Chemical Industrial (Tci) Co., Ltd.
13.12.2 Carter Manufacturing Ltd.
13.12.3 Pingxiang Xingfeng Chemical Packing Co., Ltd.
13.12.4 Taian Porei Import & Export Co., Ltd.
13.12.5 Guangzhou Chemxin Environmental Material Co., Ltd.
13.12.6 Xi�an Lvneng Purification Technology Limited
13.12.7 Industrie Bitossi S.P.A.
13.12.8 Vereinigte Fullkorper-Fabriken Gmbh & Co. Kg (VFF)
13.12.9 Zibo Sinoshine Industrial Ceramic Co., Ltd.
14 Appendix (Page No. - 112)
14.1 Discussion Guide
14.2 Introducing RT: Real-Time Market Intelligence
14.3 Knowledge Store: Marketsandmarkets Subscription Portal
14.4 Available Customizations
14.5 Related Reports
14.6 Author Details
List of Tables (73 Tables)
Table 1 Ceramic Balls Market Size, 2016�2023
Table 2 Trends and Forecast of GDP, 2018�2023 (USD Billion)
Table 3 Automotive Production, in Million Units (2015 and 2016)
Table 4 Number of New Airplane Deliveries, By Region (2016)
Table 5 Ceramic Ball Market Size, By Function, 2016�2023 (USD Million)
Table 6 Inert Ceramic Ball Market Size, By Region, 2016�2023 (USD Million)
Table 7 Active Ceramic Ball Market Size, By Region, 2016�2023 (USD Million)
Table 8 Ceramic Balls Market Size, By Material, 2016�2023 (USD Million)
Table 9 Silicon-Based Ceramic Ball Market Size, By Region, 2016�2023 (USD Million)
Table 10 Alumina-Based Ceramic Ball Market Size, By Region, 2016�2023 (USD Million)
Table 11 Zirconia-Based Ceramic Ball Market Size , By Region, 2016�2023 (USD Million)
Table 12 Other Materials-Ceramic Balls Market Size, By Region, 2016�2023 (USD Million)
Table 13 Ceramic Ball Market Size, By Application, 2016�2023 (USD Million)
Table 14 Ceramic Ball Market Size in Bearing, By Region, 2016�2023 (USD Million)
Table 15 Ceramic Ball Market Size in Grinding, By Region, 2016�2023 (USD Million)
Table 16 Ceramic Balls Market Size in Valve, By Region, 2016�2023 (USD Million)
Table 17 Ceramic Ball Market Size in Other Applications, By Region, 2016�2023 (USD Million)
Table 18 Ceramic Ball Market Size, By End-USE Industry, 2016�2023 (USD Million)
Table 19 Ceramic Ball Market Size in Automotive, By Region, 2016�2023 (USD Million)
Table 20 Ceramic Balls Market Size in Chemical, By Region, 2016�2023 (USD Million)
Table 21 Ceramic Ball Market Size in Aerospace, By Region, 2016�2023 (USD Million)
Table 22 Ceramic Ball Market Size in Other End-USE Industries, By Region, 2016�2023 (USD Million)
Table 23 Ceramic Ball Market Size, By Region, 2016�2023 (USD Million)
Table 24 North America: Market Size, By Material, 2016�2023 (USD Million)
Table 25 North America: Market Size, By Function, 2016�2023 (USD Million)
Table 26 North America: Market Size, By Application, 2016�2023 (USD Million)
Table 27 North America: Market Size, By End-USE Industry, 2016�2023 (USD Million)
Table 28 North America: Market Size, By Country, 2016�2023 (USD Million)
Table 29 US: Ceramic Balls Market Size, By End-USE Industry, 2016�2023 (USD Million)
Table 30 Canada: Market Size, By End-USE Industry, 2016�2023 (USD Million)
Table 31 Europe: Market Size, By Material, 2016�2023 (USD Million)
Table 32 Europe: Market Size, By Function, 2016�2023 (USD Million)
Table 33 Europe: Market Size, By Application, 2016�2023 (USD Million)
Table 34 Europe: Market Size, By End-USE Industry, 2016�2023 (USD Million)
Table 35 Europe: Market Size, By Country, 2016�2023 (USD Million)
Table 36 Germany: Market Size, By End-USE Industry, 2016�2023 (USD Million)
Table 37 France: Market Size, By End-USE Industry, 2016�2023 (USD Million)
Table 38 Spain: Market Size, By End-USE Industry, 2016�2023 (USD Million)
Table 39 UK: Market Size, By End-USE Industry, 2016�2023 (USD Million)
Table 40 Italy: Market Size, By End-USE Industry, 2016�2023 (USD Million)
Table 41 Russia: Market Size, By End-USE Industry, 2016�2023 (USD Million)
Table 42 Rest of Europe: Market Size, By End-USE Industry, 2016�2023 (USD Million)
Table 43 APAC: Market Size, By Material, 2016�2023 (USD Million)
Table 44 APAC: Market Size, By Function, 2016�2023 (USD Million)
Table 45 APAC: Market Size, By Application, 2016�2023 (USD Million)
Table 46 APAC: Market Size, By End-USE Industry, 2016�2023 (USD Million)
Table 47 APAC: Market Size, By Country, 2016�2023 (USD Million)
Table 48 China: Market Size, By End-USE Industry, 2016�2023 (USD Million)
Table 49 Japan: Market Size, By End-USE Industry, 2016�2023 (USD Million)
Table 50 South Korea: Market Size, By End-USE Industry, 2016�2023 (USD Million)
Table 51 India: Ceramic Balls Market Size, By End-USE Industry, 2016�2023 (USD Million)
Table 52 Indonesia: Market Size, By End-USE Industry, 2016�2023 (USD Million)
Table 53 Rest of APAC: Ceramic Ball Market Size, By End-USE Industry, 2016�2023 (USD Million)
Table 54 MEA: Market Size, By Material, 2016�2023 (USD Million)
Table 55 MEA: Market Size, By Function, 2016�2023 (USD Million)
Table 56 MEA: Market Size, By Application, 2016�2023 (USD Million)
Table 57 MEA: Market Size, By End-USE Industry, 2016�2023 (USD Million)
Table 58 MEA: Market Size, By Country, 2016�2023 (USD Million)
Table 59 Saudi Arabia: Market Size, By End-USE Industry, 2016�2023 (USD Million)
Table 60 South Africa: Market Size, By End-USE Industry, 2016�2023 (USD Million)
Table 61 UAE: Ceramic Balls Market Size, By End-USE Industry, 2016�2023 (USD Million)
Table 62 Rest of the MEA: Ceramic Ball Market Size, By End-USE Industry, 2016�2023 (USD Million)
Table 63 Latin America: Market Size, By Material, 2016�2023 (USD Million)
Table 64 Latin America: Market Size, By Function, 2016�2023 (USD Million)
Table 65 Latin America: Market Size, By Application, 2016�2023 (USD Million)
Table 66 Latin America: Market Size, By End-USE Industry, 2016�2023 (USD Million)
Table 67 Latin America: Market Size, By Country, 2016�2023 (USD Million)
Table 68 Brazil: Market Size, By End-USE Industry, 2016�2023 (USD Million)
Table 69 Mexico: Market Size, By End-USE Industry, 2016�2023 (USD Million)
Table 70 Argentina: Market Size, By End-USE Industry, 2016�2023 (USD Million)
Table 71 Rest of Latin America: Ceramic Balls Market Size, By End-USE Industry, 2016�2023 (USD Million)
Table 72 Expansion, 2013�2018
Table 73 Agreement & Partnership, 2013�2018
List of Figures (39 Figures)
Figure 1 Ceramic Balls Market Segmentation
Figure 2 Years Considered for the Study
Figure 3 Ceramic Balls Market: Research Design
Figure 4 Bottom-Up Approach
Figure 5 Top-Down Approach
Figure 6 Ceramic Ball Market: Data Triangulation
Figure 7 Automotive End-USE Industry to Register the Highest Cagr in the Ceramic Balls Market
Figure 8 Silicon Dominated the Ceramic Ball Market, By Material
Figure 9 China Dominated the Ceramic Balls Market
Figure 10 APAC Dominated the Ceramic Ball Market in 2017
Figure 11 Growth Opportunities in the Ceramic Balls Market Between 2018 and 2023
Figure 12 Inert Ceramic Balls to Lead the Ceramic Ball Market
Figure 13 Automotive to Dominate the Ceramic Balls Market
Figure 14 Silicon-Based Ceramic Balls to Lead the Ceramic Ball Market
Figure 15 APAC Led the Ceramic Ball Market
Figure 16 Germany to Register the Highest Cagr in the Ceramic Balls Market
Figure 17 Overview of the Factors Governing the Ceramic Ball Market
Figure 18 Ceramic Balls Market: Porter�s Five Forces Analysis
Figure 19 Automotive Production, By Region
Figure 20 New Airplane Deliveries, By Region, 2017�2036
Figure 21 Inert Ceramic Balls to Be the Leading Function Segment
Figure 22 APAC to Be the Leading Inert Ceramic Ball Market
Figure 23 Silicon-Based Material to Lead the Ceramic Balls Market
Figure 24 APAC to Account for the Largest Share of the Silicon-Based Ceramic Ball Market
Figure 25 Bearing to Be the Leading Application of Ceramic Balls
Figure 26 APAC Ceramic Ball Market to Contribute the Largest Share in Grinding Application
Figure 27 Automotive to Be the Leading End-USE Industry of Ceramic Balls
Figure 28 APAC Ceramic Ball Market to Contribute the Largest Share in Automotive End-USE Industry
Figure 29 Germany and China to Drive the Ceramic Balls Market, By Region, 2018-2023
Figure 30 North America: Ceramic Ball Market Snapshot
Figure 31 Europe: Ceramic Balls Market Snapshot
Figure 32 APAC: Ceramic Ball Market Snapshot
Figure 33 Saudi Arabia to Be the Largest Ceramic Balls Market in the MEA
Figure 34 Brazil to Be the Largest Ceramic Ball Market in Latin America
Figure 35 Companies Adopted Expansion as the Key Growth Strategy Between 2013 and 2018
Figure 36 Saint-Gobain Was the Leading Market Player in 2017
Figure 37 Honeywell International: Company Snapshot
Figure 38 Saint-Gobain: Company Snapshot
Figure 39 Toshiba Corporation: Company Snapshot


Growth opportunities and latent adjacency in Ceramic Balls Market