Car Care Products Market

Car Care Products Market by Product Type (Cleaning & Washing, Polishing & Waxing, Sealing Glaze & Coating), Application (Interior, Exterior), Consumption, Solvent (Water, Foam-based), Vehicle Type, Distribution Channel & Region - Global Forecast to 2027

Report Code: AT 7197 Dec, 2022, by marketsandmarkets.com

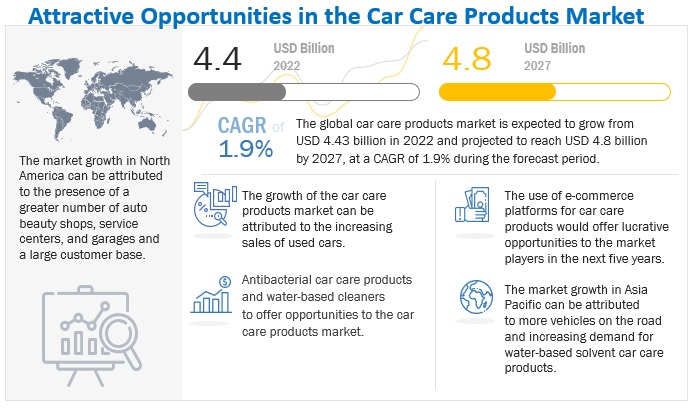
[199 Pages Report] The global car care products market size was valued at USD 4.4 billion in 2022 and is expected to reach USD 4.8 billion by 2027, growing at a CAGR of 1.9% from 2022 to 2027. Car care products are usually surface solvents and chemicals (acids or bases) used for removing stains, cleaning marks, restoring gloss and shine of car surfaces. Car care products are used to prevent or repair damages like swirl marks, scratch, paint fade to ensure. Waxes, polishes, paint protection products, tire cleaners, rim protectors, and glass cleaners are various automotive appearance chemicals available in the market.
Car Care Products Market

To know about the assumptions considered for the study, Request for Free Sample Report

Market Dynamics

DRIVER: Use of e-commerce platforms by leading players to increase customer base

E-commerce refers to purchasing goods and services over the internet with the help of an e-commerce website or application. E-commerce is one of the fastest-growing markets in the world. The global e-commerce retail market has increased from USD 2.4 trillion in 2017 to USD 4.3 trillion in 2020 and experienced a growth of 79.2% from 2017 to 2020. Ease of purchase or convenience, pricing and discounts on various products and services, and home delivery are the major reasons for increasing preference of e-commerce platforms around the world. Considering the success of e-commerce platforms and increasing consumer spending on car care products to maintain the aesthetics of a vehicle, many car care product manufacturers such as 3M, Illinois Tool Works, SONAX, and others have adopted this strategy to sell their car care products through online platforms and retail stores as well.

RESTRAINT: Regulations pertaining to car wash and car care products

The car care industry for DIY auto care products is directly impacted by the EPA's recommendation suggested car owners utilise professional detailing services rather than do-it-yourself (DIY) cleaning activities at home. If someone wants to run a carwash business, they should adhere to a number of rules and regulations that are associated to the environment's safety and the workers' safety at work. Each state or nation has its own regulatory permits and water runoff laws, and they all follow to the same law. The market depends on how strictly the laws like Clean Water Act of 1972 is applied by the EPA. Consequently, the demand for DIY and DIFM car maintenance products is directly impacted by these regulations.

OPPORTUNITY: Increasing demand for water-based cleaners

Water-based cleaners not only eliminate soils by dissolving contaminants, but they can chemically react with these pollutants, making them increasingly dissolvable in water. Most water-based cleaners consist of a range of other components as well to enhance their effectiveness. Some substances can include detergents or surfactants, builders, emulsifiers, saponifiers, sequestering agents, and chelating agents. Demand for water-based cleaners is increasing due to their various benefits over solvent-based cleaners in the car care products market.

CHALLENGE: Possibility of Recession in 2022-2023

Due to the recent series of global events like the Ukraine-Russia war, the global economy especially Europe and US has been seriously impacted causing disruptions in global supply chains and energy markets. As a result there is a rising concerns about an impending recession. There are increasing signs of this such as layoff in US, rising interest rates and lowering demand. In a recession, auto sales decline significantly as many buyers back out of the market. Due to this the car detailing work shops and service centers will see reduced visits by customers and hence the car detailing and care products will see a reduced demand. Due to this war the European union has been facing energy shortages and that has spiked the prices of other goods substantially therevt reducing the demands of goods and services that has negatively impacted the economies. Similarly the US Federal Reserves has also been increasing interest rates continuously that has negatively impacted the demands of goods and services in US as well. These signs of economic downturn or even a recession many negatively impact the market.

Individual sources will the fastest growing consumers during the forecast period

The increasing awareness regarding car detailing has helped to increase the demand for car care product. However the increasing labour cost has compelled many car lovers to take up the task on an individual level rather than visiting to a car care workshop. With presence of sufficient training material online regarding car detailing many of these consumers now learn and do some basic detailing task themselves. With time the number of such people is expected to increase and so will the demand for car care products.

Passenger cars will be the biggest market for car care products

The passenger vehicles are increasing a high rates due to the increasing sales in Asia Pacific region. There is also increasing market for used cars. Used cars fetch a good value only when sold in a good condition. Hence in order to keep the car in good condition for long time and also to keep the resale value of the car as high as possible. This is expected to drive the demand for care products. Also, the sales of premium and luxury cars have increased significantly globally, especially in US, Europe and China. This has proportionally driven the demand of car care products globally. The growing passenger car fleet, especially in Asia Pacific is expected to boost car care market in the coming years.

Asia Pacific is expected to be the fastest growing market

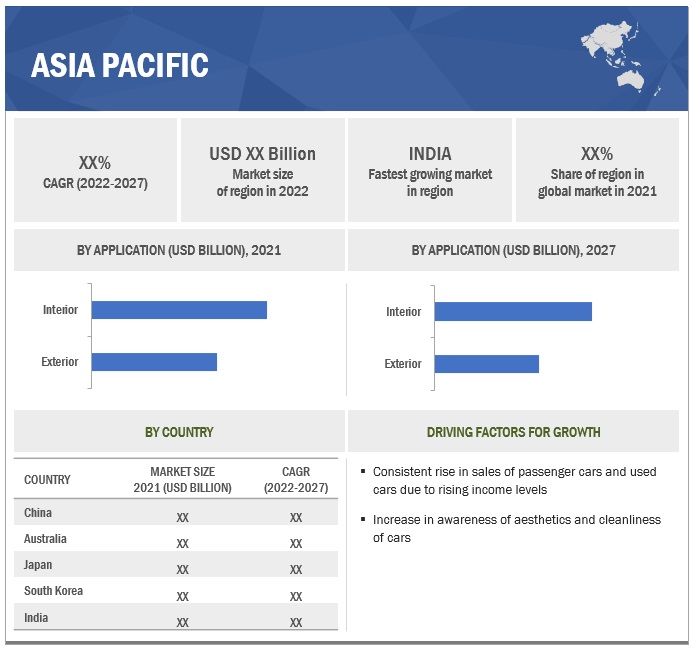
Asia Pacific region is expected to be the fastest growing market. Several factors can be attributed to this observations which are first, there is an increase in sales of automobiles in some of the largest market of this regions i.e. China and India. Second, there is an increase in disposable income and awareness regarding good maintenance of car which allows people to spend more generously on maintenance of their car. Thirdly, there is an increasing use car market in this region where the most well maintained used car get a higher value. Expansion car care shops/parlors by various top players such as 3M, ITW, Wurth Group etc. is expected to drive popularity of car care products. This factors are expected to boost growth of car care products in this region.
Car Care Products Market Size, and Share

To know about the assumptions considered for the study, download the pdf brochure

Key Market Players

Tetrosyl (UK), Illinois Tool Works (US), 3M (US), Sonax Gmbh (Germany), and Wurth Group (Germany). These companies adopted new product launches and expansion to gain traction in the car care product market.

Want to explore hidden markets that can drive new revenue in Car Care Products Market?

Scope of the Report

Report Metric

Details

Market Revenue in 2022

USD 4.4 billion

Estimated Value by 2030

USD 4.8 billion

Growth Rate

Poised to grow at a CAGR of 1.9%

Market Segmentation

By product type, by application, by vehicle type, by consumption, by distribution channel, by solvent, and region

Market Driver

Use of e-commerce platforms by leading players to increase customer base

Market Opportunity

Increasing demand for water-based cleaners

Geographies covered

North America, Europe, Asia Pacific, and Rest of the World

This research report categorizes the car care products market to forecast revenues and analyze trends in each of the following subsegments:

By Product Type
  • cleaning & caring
  • polishing & waxing
  • sealing glaze & coating, others
By Application
  • interior
  • exterior
By Vehicle Type
  • passenger cars
  • light commercial vehicles
  • heavy commercial vehicles
By End Use
  • auto beauty shops
  • service centers & garages
  • individuals
By Solvent
  • water-based
  • foam-based
By Distribution Channel
  • DIY/retail stores
  • DIFM (do it for me)/service centers
By Region
  • North America
  • Asia Pacific
  • Rest of the World

Recent Developments

  • In September 2022, Turtle wax inaugurated its first car care service and detailing center in Mumbai (India).
  • In 2021, Tata Motors (India) collaborated with several car care products brand to offer car care services in its workshops.
  • In March 2021, Soft99 Corporation launched the Fukupika Wash & Wax Gen.5 and G-Jetta.
  • In February 2021, Altro Group launched The Royal Warranted car-care expert’s new Fogger that requires just 10 minutes to work, helping mask nasty smells behind a pleasant minty freshness thanks to its simple ‘one-shot’ operation.
  • In May 2019, Castrol India and 3M India teamed up to launch an assortment of vehicle care products. Under the purview of this collaboration, a range of 3M-Castrol branded bike and car care products, such as glass cleaner, shampoo, dashboard, and tire dressers, cream wax, etc., will be retailed in India.
  • In May 2019, Liqui Moly has continued its collaboration with the Italian motorcycle manufacturer Betamotor. Since 2014, all the motorcycles manufactured at the Beta plant have Liqui Moly oil in their engines. The two companies have now decided to extend their cooperation up to 2021. This partnership includes additives, care products, service products, etc., that are geared specifically toward motorcycles

Frequently Asked Questions (FAQ):

To speak to our analyst for a discussion on the above findings, click Speak to Analyst

Exclusive indicates content/data unique to MarketsandMarkets and not available with any competitors.

TABLE OF CONTENTS
 
1 INTRODUCTION (Page No. - 26)
    1.1 STUDY OBJECTIVES 
    1.2 PRODUCT DEFINITION 
           1.2.1 INCLUSIONS & EXCLUSIONS
    1.3 MARKET SCOPE 
           FIGURE 1 CAR CARE PRODUCTS MARKET SEGMENTATION
           FIGURE 2 REGIONAL SCOPE
    1.4 CURRENCY 
           TABLE 1 CURRENCY EXCHANGE RATES (PER USD)
    1.5 SUMMARY OF CHANGES 
    1.6 LIMITATIONS 
 
2 RESEARCH METHODOLOGY (Page No. - 30)
    2.1 RESEARCH DATA 
           FIGURE 3 RESEARCH DESIGN
           FIGURE 4 RESEARCH METHODOLOGY MODEL
           2.1.1 SECONDARY DATA
                    2.1.1.1 List of key secondary sources to estimate car care products market
                    2.1.1.2 Key data from secondary sources
           2.1.2 PRIMARY DATA
                    FIGURE 5 BREAKDOWN OF PRIMARY INTERVIEWS: BY STAKEHOLDER, DESIGNATION, AND REGION
                    2.1.2.1 List of primary participants
    2.2 MARKET ESTIMATION METHODOLOGY 
           FIGURE 6 RESEARCH METHODOLOGY: HYPOTHESIS BUILDING
           2.2.1 TOP-DOWN APPROACH
                    FIGURE 7 MARKET SIZE: TOP-DOWN APPROACH
           2.2.2 FACTOR ANALYSIS FOR MARKET SIZING: DEMAND AND SUPPLY SIDE
    2.3 DATA TRIANGULATION 
           FIGURE 8 DATA TRIANGULATION METHODOLOGY
    2.4 FACTOR ANALYSIS 
    2.5 RESEARCH ASSUMPTIONS 
           2.5.1 ASSUMPTIONS
           2.5.2 MARKET ASSUMPTIONS
    2.6 RESEARCH LIMITATIONS 
 
3 EXECUTIVE SUMMARY (Page No. - 44)
    FIGURE 9 REPORT SUMMARY 
    FIGURE 10 CAR CARE PRODUCTS MARKET, BY REGION, 2022 VS. 2027 (USD BILLION) 
 
4 PREMIUM INSIGHTS (Page No. - 47)
    4.1 STEADY GROWTH OPPORTUNITIES FOR PLAYERS IN MARKET 
           FIGURE 11 RISING AWARENESS REGARDING CAR MAINTENANCE AND AESTHETICS TO DRIVE MARKET
    4.2 MARKET, BY PRODUCT TYPE 
           FIGURE 12 CLEANING & CARING SEGMENT TO ACCOUNT FOR LARGEST SHARE
    4.3MARKET, BY END USE 
           FIGURE 13 INDIVIDUALS SEGMENT TO GROW AT HIGHEST CAGR DURING FORECAST PERIOD
    4.4 MARKET, BY DISTRIBUTION CHANNEL 
           FIGURE 14 DIFM SEGMENT TO DOMINATE DURING FORECAST PERIOD
    4.5 MARKET, BY VEHICLE TYPE 
           FIGURE 15 COMMERCIAL VEHICLES SEGMENT PROJECTED TO GROW FASTER DURING FORECAST PERIOD
    4.6 MARKET, BY SOLVENT 
           FIGURE 16 WATER-BASED SOLVENTS PROJECTED TO LEAD MARKET
    4.7 MARKET, BY APPLICATION 
           FIGURE 17 INTERIOR SEGMENT TO BE LARGER IN MARKET
    4.8 MARKET, BY REGION 
           FIGURE 18 NORTH AMERICA TO ACCOUNT FOR LARGEST SHARE OF MARKET IN 2022
 
5 MARKET OVERVIEW (Page No. - 52)
    5.1 INTRODUCTION 
    5.2 MARKET DYNAMICS 
           FIGURE 19 CAR CARE PRODUCTS: MARKET DYNAMICS
           5.2.1 DRIVERS
                    5.2.1.1 Increase in sales of used cars
                               FIGURE 20 US: USED PASSENGER CAR AND LIGHT TRUCK SALES (2010–2019)
                    5.2.1.2 Use of e-commerce platforms by leading players to increase customer base
                               FIGURE 21 GLOBAL E-COMMERCE RETAIL SALES (2014–2020)
                               FIGURE 22 US: ONLINE AUTO PARTS AND ACCESSORIES SALES (2016–2020)
           5.2.2 RESTRAINTS
                    5.2.2.1 Stringent regulations pertaining to car wash and car care products
           5.2.3 OPPORTUNITIES
                    5.2.3.1 Development of antibacterial car care products
                    5.2.3.2 Increasing demand for water-based cleaners
           5.2.4 CHALLENGES
                    5.2.4.1 High cost of specialized car care products
                    5.2.4.2 Usage of hazardous chemicals in car care products
    5.3 TECHNOLOGY ANALYSIS 
           5.3.1 SONAR PROFILING
           5.3.2 CERAMIC TECHNOLOGY
    5.4 KEY STAKEHOLDERS IN BUYING PROCESS & BUYING CRITERIA 
           FIGURE 23 KEY BUYING CRITERIA FOR AUTOMOTIVE CAR CARE PRODUCTS
           TABLE 2 KEY BUYING CRITERIA FOR TOP THREE CAR CARE END USES
    5.5 MARKET ECOSYSTEM 
           FIGURE 24 MARKET: ECOSYSTEM
           TABLE 3 MARKET: ROLE OF COMPANIES IN ECOSYSTEM
    5.6 VALUE CHAIN ANALYSIS 
           FIGURE 25 VALUE CHAIN ANALYSIS: MARKET
    5.7 AVERAGE RETAIL PRICE OF POLISHING COMPOUNDS 
           TABLE 4 AVERAGE RETAIL PRICE OF POLISHING COMPOUNDS, BY REGION, 2021
           5.7.1 NORTH AMERICA: AVERAGE RETAIL PRICE (ARP) FOR POLISHING COMPOUNDS, KEY BRANDS, 2021
                    TABLE 5 NORTH AMERICA: AVERAGE RETAIL PRICE (ARP) FOR POLISHING COMPOUNDS, KEY BRANDS, 2021
           5.7.2 EUROPE: AVERAGE RETAIL PRICE (ARP) FOR POLISHING COMPOUNDS, KEY BRAND, 2021
                    TABLE 6 EUROPE: AVERAGE RETAIL PRICE (ARP) FOR POLISHING COMPOUNDS, KEY BRANDS, 2021
           5.7.3 ASIA PACIFIC: AVERAGE RETAIL PRICE (ARP) FOR POLISHING COMPOUNDS, KEY BRANDS, 2021
                    TABLE 7 ASIA PACIFIC: AVERAGE RETAIL PRICE (ARP) FOR POLISHING COMPOUNDS, KEY BRANDS, 2021
    5.8 PORTER'S FIVE FORCES ANALYSIS 
           FIGURE 26 PORTER'S FIVE FORCES ANALYSIS: CAR CARE PRODUCTS MARKET
           TABLE 8 PORTER'S FIVE FORCES ANALYSIS
           5.8.1 THREAT OF SUBSTITUTES
           5.8.2 THREAT OF NEW ENTRANTS
           5.8.3 BARGAINING POWER OF BUYERS
           5.8.4 BARGAINING POWER OF SUPPLIERS
           5.8.5 INTENSITY OF COMPETITIVE RIVALRY
    5.9 PATENT ANALYSIS 
           TABLE 9 CAR CARE PRODUCTS: KEY APPLICATIONS AND PATENTS, 2018–2021
    5.10 CASE STUDY ANALYSIS 
           5.10.1 OSKAR RUFF & CO. OHG IN ESSLINGEN, GERMANY
    5.11 IMPACT OF RECESSION ON ECONOMY AND AUTOMOTIVE INDUSTRY 
           5.11.1 INTRODUCTION
           5.11.2 REGIONAL MACRO-ECONOMIC OVERVIEW
           5.11.3 ANALYSIS OF KEY ECONOMIC INDICATORS
                    TABLE 10 KEY ECONOMIC INDICATORS FOR SELECT COUNTRIES, 2021–2023
           5.11.4 ECONOMIC STAGFLATION (SLOWDOWN) VS. ECONOMIC RECESSION
                    5.11.4.1 Europe
                               TABLE 11 EUROPE: KEY ECONOMIC INDICATORS, 2021–2023
                    5.11.4.2 Asia Pacific
                               TABLE 12 ASIA PACIFIC: KEY ECONOMIC INDICATORS, 2021–2023
                    5.11.4.3 Americas
                               TABLE 13 AMERICAS: KEY ECONOMIC INDICATORS, 2021–2023
           5.11.5 ECONOMIC OUTLOOK/PROJECTIONS
                    TABLE 14 GDP GROWTH PROJECTIONS FOR KEY COUNTRIES, 2024–2027 (% GROWTH)
    5.12 IMPACT ON AUTOMOTIVE SECTOR 
           5.12.1 ANALYSIS OF AUTOMOTIVE VEHICLE SALES
                    5.12.1.1 Europe
                               TABLE 15 EUROPE: PASSENGER CAR AND LIGHT COMMERCIAL VEHICLE SALES, BY COUNTRY, 2021–2022
                    5.12.1.2 Asia Pacific
                               TABLE 16 ASIA PACIFIC: PASSENGER CAR AND LIGHT COMMERCIAL VEHICLE SALES, BY COUNTRY, 2021–2022
                    5.12.1.3 Americas
                               TABLE 17 AMERICAS: PASSENGER CAR AND LIGHT COMMERCIAL VEHICLE SALES, BY COUNTRY, 2021–2022
           5.12.2 AUTOMOTIVE SALES OUTLOOK
                    TABLE 18 PASSENGER CAR AND LIGHT COMMERCIAL VEHICLE PRODUCTION FORECAST, 2022 VS. 2027 (UNITS)
    5.13 IMPACT OF RECESSION ON MARKET: SCENARIO ANALYSIS 
                    FIGURE 27 SCENARIO ANALYSIS: MARKET SCENARIO, 2019–2027 (USD BILLION)
           5.13.1 MOST LIKELY SCENARIO
                    TABLE 19 MARKET (MOST LIKELY SCENARIO), BY REGION, 2021–2027 (USD BILLION)
           5.13.2 HIGH-IMPACT SCENARIO
                    TABLE 20 MARKET (HIGH IMPACT SCENARIO), BY REGION, 2021–2027 (USD BILLION)
           5.13.3 LOW-IMPACT SCENARIO
                    TABLE 21 MARKET (LOW-IMPACT SCENARIO), BY REGION, 2021–2027 (USD BILLION)
    5.14 REGULATORY LANDSCAPE 
           5.14.1 VEHICLE SAFETY STANDARDS, BY REGION
    5.15 KEY CONFERENCES 
           5.15.1 CAR CARE PRODUCT MARKET: KEY UPCOMING CONFERENCES & EVENTS, 2022–2023
 
6 CAR CARE PRODUCTS MARKET, BY PRODUCT TYPE (Page No. - 82)
    6.1 INTRODUCTION 
           6.1.1 RESEARCH METHODOLOGY
           6.1.2 ASSUMPTIONS
           6.1.3 INDUSTRY INSIGHTS
                    FIGURE 28 MARKET, BY PRODUCT TYPE, 2022 VS. 2027 (USD BILLION)
                    TABLE 22 MARKET, BY PRODUCT TYPE, 2018–2021 (USD BILLION)
                    TABLE 23 MARKET, BY PRODUCT TYPE, 2022–2027 (USD BILLION)
    6.2 CLEANING & CARING 
           TABLE 24 CLEANING & CARING: MARKET, BY REGION, 2018–2021 (USD BILLION)
           TABLE 25 CLEANING & CARING: MARKET, BY REGION, 2022–2027 (USD BILLION)
    6.3 POLISHING & WAXING 
           TABLE 26 POLISHING & WAXING: MARKET, BY REGION, 2018–2021 (USD BILLION)
           TABLE 27 POLISHING & WAXING: MARKET, BY REGION, 2022–2027 (USD BILLION)
    6.4 SEALING GLAZE & COATING 
           TABLE 28 SEALING GLAZE & COATING: MARKET, BY REGION, 2018–2021 (USD BILLION)
           TABLE 29 SEALING GLAZE & COATING: MARKET, BY REGION, 2022–2027 (USD BILLION)
    6.5 OTHER PRODUCTS 
           TABLE 30 OTHER MARKET, BY REGION, 2018–2021 (USD BILLION)
           TABLE 31 OTHER MARKET, BY REGION, 2022–2027 (USD BILLION)
 
7 CAR CARE PRODUCTS MARKET, BY APPLICATION (Page No. - 90)
    7.1 INTRODUCTION 
           7.1.1 RESEARCH METHODOLOGY
           7.1.2 ASSUMPTIONS
           7.1.3 INDUSTRY INSIGHTS
                    FIGURE 29 MARKET, BY APPLICATION, 2022 VS. 2027 (USD BILLION)
                    TABLE 32 MARKET, BY APPLICATION, 2018–2021 (USD BILLION)
                    TABLE 33 MARKET, BY APPLICATION, 2022–2027 (USD BILLION)
    7.2 INTERIOR 
           TABLE 34 INTERIOR MARKET, BY REGION, 2018–2021 (USD BILLION)
           TABLE 35 INTERIOR MARKET, BY REGION, 2022–2027 (USD BILLION)
    7.3 EXTERIOR 
           TABLE 36 EXTERIOR MARKET, BY REGION, 2018–2021 (USD BILLION)
           TABLE 37 EXTERIOR MARKET, BY REGION, 2022–2027 (USD BILLION)
 
8 CAR CARE PRODUCTS MARKET, BY END USE (Page No. - 95)
    8.1 INTRODUCTION 
           8.1.1 RESEARCH METHODOLOGY
           8.1.2 ASSUMPTIONS
           8.1.3 INDUSTRY INSIGHTS
                    FIGURE 30 MARKET, BY END-USE, 2022 VS. 2027 (USD BILLION)
                    TABLE 38 MARKET, BY END USE, 2018–2021 (USD BILLION)
                    TABLE 39 MARKET, BY END USE, 2022–2027 (USD BILLION)
    8.2 AUTO BEAUTY SHOPS 
           TABLE 40 AUTO BEAUTY SHOPS MARKET, BY REGION, 2018–2021 (USD BILLION)
           TABLE 41 AUTO BEAUTY SHOPS MARKET, BY REGION, 2022–2027 (USD BILLION)
    8.3 SERVICE CENTERS & GARAGES 
           TABLE 42 SERVICE CENTERS & GARAGES MARKET, BY REGION, 2018–2021 (USD BILLION)
           TABLE 43 SERVICE CENTERS & GARAGES MARKET, BY REGION, 2022–2027 (USD BILLION)
    8.4 INDIVIDUALS 
           TABLE 44 INDIVIDUAL USERS MARKET, BY REGION, 2018–2021 (USD BILLION)
           TABLE 45 INDIVIDUAL USERS MARKET, BY REGION, 2022–2027 (USD BILLION)
 
9 CAR CARE PRODUCTS MARKET, BY SOLVENT (Page No. - 101)
    9.1 INTRODUCTION 
           9.1.1 RESEARCH METHODOLOGY
           9.1.2 ASSUMPTIONS
           9.1.3 INDUSTRY INSIGHTS
                    FIGURE 31 MARKET, BY SOLVENT, 2022 VS. 2027 (USD BILLION)
                    TABLE 46 MARKET, BY SOLVENT, 2018–2021 (USD BILLION)
                    TABLE 47 MARKET, BY SOLVENT, 2022–2027 (USD BILLION)
    9.2 WATER-BASED SOLVENTS 
           TABLE 48 WATER-BASED SOLVENTS MARKET, BY REGION, 2018–2021 (USD BILLION)
           TABLE 49 WATER-BASED SOLVENTS MARKET, BY REGION, 2022–2027 (USD BILLION)
    9.3 FOAM-BASED SOLVENTS 
           TABLE 50 FOAM-BASED SOLVENTS MARKET, BY REGION, 2018–2021 (USD BILLION)
           TABLE 51 FOAM-BASED SOLVENTS MARKET, BY REGION, 2022–2027 (USD BILLION)
 
10 CAR CARE PRODUCTS MARKET, BY VEHICLE TYPE (Page No. - 106)
     10.1 INTRODUCTION 
             10.1.1 RESEARCH METHODOLOGY
             10.1.2 ASSUMPTIONS
             10.1.3 INDUSTRY INSIGHTS
                       FIGURE 32 MARKET, BY VEHICLE TYPE, 2022 VS. 2027 (USD BILLION)
                       TABLE 52 MARKET, BY VEHICLE TYPE, 2018–2021 (USD BILLION)
                       TABLE 53 MARKET, BY VEHICLE TYPE, 2022–2027 (USD BILLION)
                       TABLE 54 PASSENGER CARS: MARKET, BY REGION, 2018–2021 (USD BILLION)
                       TABLE 55 PASSENGER CARS: MARKET, BY REGION, 2022–2027 (USD BILLION)
     10.2 COMMERCIAL VEHICLES 
               TABLE 56 COMMERCIAL VEHICLES: MARKET, BY REGION, 2018–2021 (USD BILLION)
               TABLE 57 COMMERCIAL VEHICLES: MARKET, BY REGION, 2022–2027 (USD BILLION)
 
11 CAR CARE PRODUCTS MARKET, BY DISTRIBUTION CHANNEL (Page No. - 111)
     11.1 INTRODUCTION 
             11.1.1 RESEARCH METHODOLOGY
             11.1.2 ASSUMPTIONS
             11.1.3 INDUSTRY INSIGHTS
                       FIGURE 33 MARKET, BY DISTRIBUTION CHANNEL, 2022 VS. 2027 (USD BILLION)
                       TABLE 58 MARKET, BY DISTRIBUTION CHANNEL, 2018–2021 (USD BILLION)
                       TABLE 59 MARKET, BY DISTRIBUTION CHANNEL, 2022–2027 (USD BILLION)
     11.2 DIFM/SERVICE CENTERS 
               TABLE 60 DIFM/SERVICE CENTERS MARKET, BY REGION, 2018–2021 (USD BILLION)
               TABLE 61 DIFM/SERVICE CENTERS MARKET, BY REGION, 2022–2027 (USD BILLION)
     11.3 DIY/RETAIL STORES 
               TABLE 62 DIY/RETAIL STORES MARKET, BY REGION, 2018–2021 (USD BILLION)
               TABLE 63 DIFM/RETAIL STORES MARKET, BY REGION, 2022–2027 (USD BILLION)
 
12 CAR CARE PRODUCTS MARKET, BY REGION (Page No. - 116)
     12.1 INTRODUCTION 
               FIGURE 34 NORTH AMERICA ESTIMATED TO ACCOUNT FOR LARGEST SHARE IN 2022
             12.1.1 RESEARCH METHODOLOGY
             12.1.2 ASSUMPTIONS
             12.1.3 INDUSTRY INSIGHTS
                       FIGURE 35 MARKET, BY REGION, 2022 VS. 2027 (USD BILLION)
                       TABLE 64 MARKET, BY REGION, 2018–2021 (USD BILLION)
                       TABLE 65 MARKET, BY REGION, 2022–2027 (USD BILLION)
     12.2 NORTH AMERICA 
             12.2.1 NORTH AMERICA: RECESSION IMPACT
                       FIGURE 36 NORTH AMERICA: MARKET SNAPSHOT
                       TABLE 66 NORTH AMERICA: MARKET, BY COUNTRY, 2018–2021 (USD BILLION)
                       TABLE 67 NORTH AMERICA: MARKET, BY COUNTRY, 2022–2027 (USD BILLION)
             12.2.2 US
                       12.2.2.1 Increasing presence of auto beauty shops, service centers, and garages to drive market
                                   TABLE 68 US: MARKET, BY APPLICATION, 2018–2021 (USD BILLION)
                                   TABLE 69 US: MARKET, BY APPLICATION, 2022–2027 (USD BILLION)
             12.2.3 CANADA
                       12.2.3.1 Increased consumer spending on vehicle maintenance cars in harsh environmental conditions to boost market
                                   TABLE 70 CANADA: MARKET, BY APPLICATION, 2018–2021 (USD BILLION)
                                   TABLE 71 CANADA: MARKET, BY APPLICATION, 2022–2027 (USD BILLION)
             12.2.4 MEXICO
                       12.2.4.1 Weak demand to result in stagnant market growth
                                   TABLE 72 MEXICO: MARKET, BY APPLICATION, 2018–2021 (USD BILLION)
                                   TABLE 73 MEXICO: MARKET, BY APPLICATION, 2022–2027 (USD BILLION)
     12.3 ASIA PACIFIC 
             12.3.1 ASIA PACIFIC: RECESSION IMPACT
                       FIGURE 37 ASIA PACIFIC: MARKET SNAPSHOT
                       TABLE 74 ASIA PACIFIC: MARKET, BY COUNTRY, 2018–2021 (USD BILLION)
                       TABLE 75 ASIA PACIFIC: MARKET, BY COUNTRY, 2022–2027 (USD BILLION)
             12.3.2 CHINA
                       12.3.2.1 Higher demand for antimicrobial interior car care products to support market
                                   TABLE 76 CHINA: MARKET, BY APPLICATION, 2018–2021 (USD BILLION)
                                   TABLE 77 CHINA: MARKET, BY APPLICATION, 2022–2027 (USD BILLION)
             12.3.3 AUSTRALIA
                       12.3.3.1 Increasing demand for car wash services to propel market
                                   TABLE 78 AUSTRALIA: MARKET, BY APPLICATION, 2018–2021 (USD BILLION)
                                   TABLE 79 AUSTRALIA: MARKET, BY APPLICATION, 2022–2027 (USD BILLION)
             12.3.4 JAPAN
                       12.3.4.1 Increasing demand for high-end car care products and services to drive market
                                   TABLE 80 JAPAN: MARKET, BY APPLICATION, 2018–2021 (USD BILLION)
                                   TABLE 81 JAPAN: MARKET, BY APPLICATION, 2022–2027 (USD BILLION)
             12.3.5 SOUTH KOREA
                       12.3.5.1 Increasing demand for paintwork care products to boost market
                                   TABLE 82 SOUTH KOREA: MARKET, BY APPLICATION, 2018–2021 (USD BILLION)
                                   TABLE 83 SOUTH KOREA: MARKET, BY APPLICATION, 2022–2027 (USD BILLION)
             12.3.6 INDIA
                       12.3.6.1 Increasing demand for cost-effective car care products to fuel growth
                                   TABLE 84 INDIA: MARKET, BY APPLICATION, 2018–2021 (USD BILLION)
                                   TABLE 85 INDIA: MARKET, BY APPLICATION, 2022–2027 (USD BILLION)
     12.4 EUROPE 
             12.4.1 EUROPE: RECESSION IMPACT
                       FIGURE 38 EUROPE: MARKET SNAPSHOT
                       TABLE 86 EUROPE: MARKET, BY COUNTRY, 2018–2021 (USD BILLION)
                       TABLE 87 EUROPE: MARKET, BY COUNTRY, 2022–2027 (USD BILLION)
             12.4.2 GERMANY
                       12.4.2.1 Increasing number of premium cars and high per capita income of car owners to drive market
                                   TABLE 88 GERMANY: MARKET, BY APPLICATION, 2018–2021 (USD BILLION)
                                   TABLE 89 GERMANY: MARKET, BY APPLICATION, 2022–2027 (USD BILLION)
             12.4.3 UK
                       12.4.3.1 Increasing consumption of car care products to maintain aesthetics to fuel market
                                   TABLE 90 UK: MARKET, BY APPLICATION, 2018–2021 (USD BILLION)
                                   TABLE 91 UK: MARKET, BY APPLICATION, 2022–2027 (USD BILLION)
             12.4.4 FRANCE
                       12.4.4.1 E-commerce platforms selling DIY products to boost market
                                   TABLE 92 FRANCE: MARKET, BY APPLICATION, 2018–2021 (USD BILLION)
                                   TABLE 93 FRANCE: MARKET, BY APPLICATION, 2022–2027 (USD BILLION)
             12.4.5 ITALY
                       12.4.5.1 Increasing demand for interior car care products to propel market
                                   TABLE 94 ITALY: MARKET, BY APPLICATION, 2018–2021 (USD BILLION)
                                   TABLE 95 ITALY: MARKET, BY APPLICATION, 2022–2027 (USD BILLION)
             12.4.6 SPAIN
                       12.4.6.1 Decreasing per capita income to restrain market
                                   TABLE 96 SPAIN: MARKET, BY APPLICATION, 2018–2021 (USD BILLION)
                                   TABLE 97 SPAIN: MARKET, BY APPLICATION, 2022–2027 (USD BILLION)
     12.5 REST OF THE WORLD (ROW) 
               FIGURE 39 ROW: MARKET, BY COUNTRY, 2022 VS. 2027 (USD BILLION)
               TABLE 98 ROW: MARKET, BY COUNTRY, 2018–2021 (USD BILLION)
               TABLE 99 ROW: MARKET, BY COUNTRY, 2022–2027 (USD BILLION)
             12.5.1 RUSSIA
                       12.5.1.1 Stringent government policies regarding car wash to fuel growth
                                   TABLE 100 RUSSIA: MARKET, BY APPLICATION, 2018–2021 (USD BILLION)
                                   TABLE 101 RUSSIA: MARKET, BY APPLICATION, 2022–2027 (USD BILLION)
             12.5.2 BRAZIL
                       12.5.2.1 Growing sales of premium and luxury cars to drive car care market
                                   TABLE 102 BRAZIL: MARKET, BY APPLICATION, 2018–2021 (USD BILLION)
                                   TABLE 103 BRAZIL: MARKET, BY APPLICATION, 2022–2027 (USD BILLION)
 
13 RECOMMENDATIONS BY MARKETSANDMARKETS (Page No. - 140)
     13.1 ASIA PACIFIC TO BE FASTEST-GROWING AND NORTH AMERICA TO BE LARGEST MARKET FOR CAR CARE PRODUCTS 
     13.2 INTERIOR CAR CARE PRODUCTS – KEY FOCUS AREAS 
     13.3 CONCLUSION 
 
14 COMPETITIVE LANDSCAPE (Page No. - 142)
     14.1 OVERVIEW 
     14.2 CAR CARE PRODUCTS: MARKET SHARE & RANKING ANALYSIS 
               TABLE 104 MARKET SHARE ANALYSIS: MARKET, 2021
               FIGURE 40 CAR CARE PRODUCTS: MARKET SHARE & RANKING ANALYSIS, 2021
     14.3 REVENUE ANALYSIS OF TOP PLAYERS 
               FIGURE 41 TOP PLAYERS IN MARKET IN LAST THREE YEARS
     14.4 COMPETITIVE LEADERSHIP MAPPING 
             14.4.1 STARS
             14.4.2 EMERGING LEADERS
             14.4.3 PERVASIVE PLAYERS
             14.4.4 PARTICIPANTS
                       FIGURE 42 COMPETITIVE LEADERSHIP MAPPING: CAR CARE PRODUCT MANUFACTURERS
                       TABLE 105 COMPANY REGION FOOTPRINT (20 COMPANIES)
     14.5 COMPETITIVE SCENARIO 
             14.5.1 NEW PRODUCT LAUNCHES
                       TABLE 106 NEW PRODUCT LAUNCHES, 2018–2022
             14.5.2 DEALS
                       TABLE 107 DEALS, 2018–2022
             14.5.3 EXPANSIONS
                       TABLE 108 EXPANSIONS, 2018–2022
     14.6 KEY PLAYER STRATEGIES/RIGHT TO WIN, 2018–2022 
               TABLE 109 COMPANIES ADOPTED NEW PRODUCT DEVELOPMENT AND EXPANSION AS KEY GROWTH STRATEGIES, 2018–2022
 
15 COMPANY PROFILES (Page No. - 153)
(Business overview, Products offered, Recent Developments, MNM view)*
     15.1 KEY PLAYERS 
             15.1.1 3M
                       TABLE 110 3M: BUSINESS OVERVIEW
                       FIGURE 43 3M: COMPANY SNAPSHOT
                       TABLE 111 3M: DEALS
                       TABLE 112 3M: NEW PRODUCT LAUNCHES
                       TABLE 113 3M: EXPANSIONS
             15.1.2 ILLINOIS TOOL WORKS INC.
                       TABLE 114 ILLINOIS TOOL WORKS INC.: BUSINESS OVERVIEW
                       FIGURE 44 ILLINOIS TOOL WORKS INC.: COMPANY SNAPSHOT
                       TABLE 115 ILLINOIS TOOL WORKS INC.: DEALS
             15.1.3 WURTH GROUP
                       TABLE 116 WURTH GROUP: BUSINESS OVERVIEW
                       FIGURE 45 WURTH GROUP: COMPANY SNAPSHOT
                       TABLE 117 WURTH GROUP: EXPANSIONS
             15.1.4 ALTRO GROUP PLC
                       TABLE 118 ALTRO GROUP PLC: BUSINESS OVERVIEW
                       FIGURE 46 ALTRO GROUP PLC: COMPANY SNAPSHOT
                       TABLE 119 ALTRO GROUP PLC: PRODUCT LAUNCHES
                       TABLE 120 ALTRO GROUP PLC: DEALS
             15.1.5 SONAX GMBH
                       TABLE 121 SONAX GMBH: BUSINESS OVERVIEW
             15.1.6 SOFT99 CORPORATION
                       TABLE 122 SOFT99 CORPORATION: BUSINESS OVERVIEW
                       FIGURE 47 SOFT99 CORPORATION: COMPANY SNAPSHOT
                       TABLE 123 SOFT99 CORPORATION: PRODUCT LAUNCHES
             15.1.7 SIMONIZ USA
                       TABLE 124 SIMONIZ USA: BUSINESS OVERVIEW
             15.1.8 JOPASU SYSTEMS
                       TABLE 125 JOPASU SYSTEMS: BUSINESS OVERVIEW
                       TABLE 126 JOPASU SYSTEMS: PRODUCT LAUNCHES
             15.1.9 TETROSYL
                       TABLE 127 TETROSYL: BUSINESS OVERVIEW
                       TABLE 128 TETROSYL: PRODUCT LAUNCHES
                       TABLE 129 TETROSYL: DEALS
             15.1.10 LIQUI MOLY
                       TABLE 130 LIQUI MOLY: BUSINESS OVERVIEW
                       TABLE 131 LIQUI MOLY SOLUTIONS: PRODUCT LAUNCHES
                       TABLE 132 LIQUI MOLY: DEALS
                       TABLE 133 LIQUI MOLY: EXPANSIONS
     15.2 OTHER PLAYERS 
             15.2.1 TURTLE WAX
                       TABLE 134 TURTLE WAX: COMPANY OVERVIEW
             15.2.2 ARMORED AUTO GROUP
                       TABLE 135 ARMORED AUTO GROUP: COMPANY OVERVIEW
             15.2.3 BULLSONE
                       TABLE 136 BULLSONE: COMPANY OVERVIEW
             15.2.4 AUTO MAGIC
                       TABLE 137 AUTO MAGIC: COMPANY OVERVIEW
             15.2.5 GUANGZHOU BIAOBANG
                       TABLE 138 GUANGZHOU BIAOBANG: COMPANY OVERVIEW
             15.2.6 NORTHERN LABS
                       TABLE 139 NORTHERN LABS: COMPANY OVERVIEW
             15.2.7 FORMULA1 WAX
                       TABLE 140 FORMULA1 WAX: COMPANY OVERVIEW
             15.2.8 MAFRA SPA
                       TABLE 141 MAFRA SPA: COMPANY OVERVIEW
             15.2.9 CARTEC B.V.
                       TABLE 142 CARTEC B.V.: COMPANY OVERVIEW
             15.2.10 CHEMICAL GUYS
                       TABLE 143 CHEMICAL GUYS: COMPANY OVERVIEW
             15.2.11 ARMOR ALL
                       TABLE 144 ARMOR ALL: COMPANY OVERVIEW
*Details on Business overview, Products offered, Recent Developments, MNM view might not be captured in case of unlisted companies.
 
16 APPENDIX (Page No. - 192)
     16.1 INSIGHTS OF INDUSTRY EXPERTS 
     16.2 DISCUSSION GUIDE 
     16.3 KNOWLEDGESTORE: MARKETSANDMARKETS’ SUBSCRIPTION PORTAL 
     16.4 CUSTOMIZATION OPTIONS 
             16.4.1 CAR CARE PRODUCTS MARKET, BY PRODUCT TYPE, BY COUNTRY
                       16.4.1.1 North America
                                   16.4.1.1.1 US
                                   16.4.1.1.2 Canada
                                   16.4.1.1.3 Mexico
                       16.4.1.2 Asia Pacific
                                   16.4.1.2.1 China
                                   16.4.1.2.2 Australia
                                   16.4.1.2.3 Japan
                                   16.4.1.2.4 South Korea
                                   16.4.1.2.5 India
                       16.4.1.3 Europe
                                   16.4.1.3.1 Germany
                                   16.4.1.3.2 UK
                                   16.4.1.3.3 France
                                   16.4.1.3.4 Italy
                                   16.4.1.3.5 Spain
                       16.4.1.4 Rest of the World
                                   16.4.1.4.1 Brazil
                                   16.4.1.4.2 Russia
     16.5 RELATED REPORTS 
     16.6 AUTHOR DETAILS 

The study involves four main activities to estimate the current size of the car care products market. Exhaustive secondary research was done to collect information on the market, such as product type and application types. The next step was to validate these findings, assumptions, and market analysis with industry experts across value chains through primary research. Top-down approach was employed to estimate the complete market size for different segments considered under this study. Thereafter, market breakdown and data triangulation processes were used to estimate the market size of segments and subsegments.

Secondary Research

Secondary sources referred to in this research study include international car care organizations and car wash associations; corporate filings (such as annual reports, investor presentations, and financial statements); and trade, business, and automotive associations. The secondary data was collected and analyzed to arrive at the overall market size, which is further validated by primary research.

Primary Research

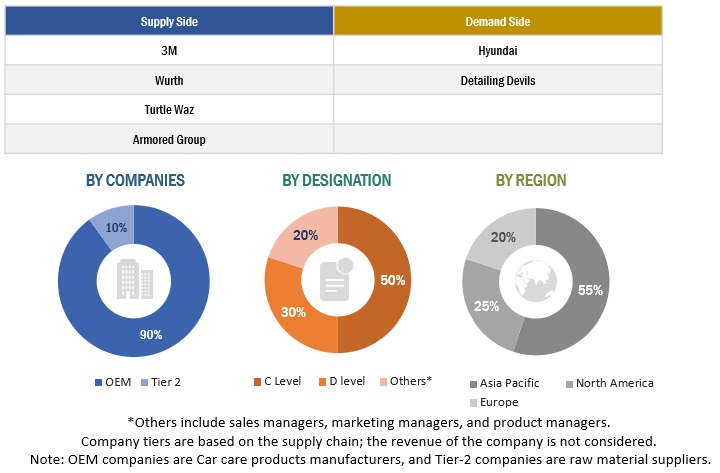
Extensive primary research was conducted after acquiring an understanding of the scenario of the car care products market through secondary research. Several primary interviews were conducted with market experts from both demand- (auto beauty shops, service centers/garages) and supply-side (car care products manufacturers) across four major regions, namely, North America, Europe, Asia Pacific, and the Rest of the World (RoW). Approximately 90% of the primary interviews were conducted with experts from the supply side, and 10% of them were conducted from the demand side. Primary data was collected through questionnaires, emails, and telephonic interviews. In our canvassing of primaries, we strived to cover various departments within organizations, which included sales, operations, and administration, to provide a holistic viewpoint of the car care products industry in our report.

After interacting with industry participants, we conducted brief sessions with highly experienced independent consultants to reinforce the findings from our primaries. This, along with the opinions of the in-house subject-matter experts, led us to the findings as described in this report.
Car Care Products Market Size, and Share

To know about the assumptions considered for the study, download the pdf brochure

Market Size Estimation

The top-down approach was used to estimate and validate the size of the car care product market. In these approaches, the production statistics for passenger cars, LCVs, trucks, and buses at a country and production statistics of BEVs, PHEVs, FCEVs, autonomous vehicles at regional level were considered to estimate the aggregate market of various car care product segments. The research methodology used to estimate the market size includes the following:

  • Key players in the car care product market were identified through secondary research, and their global market shares were determined through primary and secondary research.
  • The research methodology included the study of the annual and quarterly financial reports & regulatory filings of major market players as well as interviews with industry experts for detailed market insights.
  • All application-level penetration rates, percentage shares, splits, and breakdowns for the market was determined by using secondary sources and verified through primary sources.
  • All key macro indicators affecting the revenue growth of the market segments and sub segments have been accounted for, viewed in extensive detail, verified through primary research, and analyzed to get the validated and verified quantitative & qualitative data.
  • The gathered market data was consolidated and added with detailed inputs, analyzed, and presented in this report.

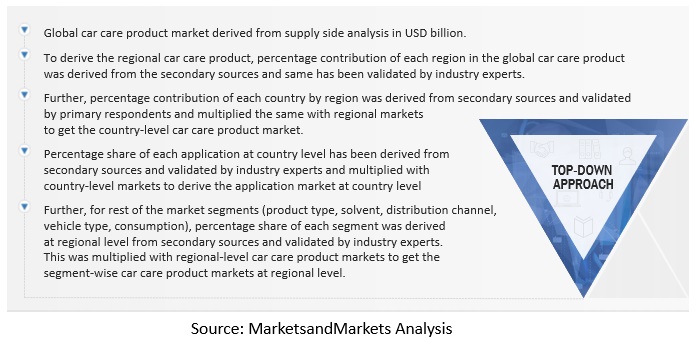
The top-down approach was used to estimate and validate the regional size for the car care products market by product type, application, consumption, solvent, vehicle type, distribution channel, and region in terms of value. The global market was derived from supply-side data where we analyzed the annual car care products sales of top companies and international car wash and car care associations, and it was further validated by primary respondents. The regional and country markets were derived by understanding the percentage contribution of each region in the global car care product market and the percentage contribution of each country in their regional car care product market. The percentage share of each application at the country level was derived from secondary sources and was further validated by primary respondents. Further, for the rest of the market segments (product type, solvent, distribution channel, vehicle type, consumption), the percentage share of each segment was derived at the regional level from secondary sources and validated by industry experts. These percentage shares were multiplied with regional-level car care product markets to get the segment-wise car care product market at a regional level.

Car Care Products Market Size: Top-Down Approach
Car Care Products Market Size, and Share

To know about the assumptions considered for the study, Request for Free Sample Report

Bottom-Up Approach

In the bottom-up approach, vehicle production of each vehicle type at the country level was considered. Penetration of each car care product application was derived through model mapping for each vehicle type. The country-level production by vehicle type was then multiplied with the penetration for each application to determine the market size of the car care product market in terms of volume. The country-level market size, in terms of volume, by application, was then multiplied with the country-level average OE Price (AOP) of each car care product application to determine the market size in terms of value for each vehicle type. Summation of the country-level market size for each vehicle type by application, by volume and value, would give the regional-level market size. Further, the summation of the regional markets provided the car care market size. The market size for vehicle type was derived from the global market.

Report Objectives

  • To define, describe, and forecast the car care products market in terms of value (USD billion), based on the following segments:
    • By Product Type [cleaning & caring, polishing & waxing, sealing glaze & coating, others]
    • By Application [interior, exterior]
    • By Vehicle Type [passenger cars, light commercial vehicles, heavy commercial vehicles]
    • By End Use [auto beauty shops, service centers & garages, individuals]
    • By Solvent [water-based, foam-based]
    • By Distribution Channel [DIY/retail stores, DIFM (do it for me)/service centers]
    • By Region (North America, Asia Pacific, Europe, and the Rest of the World)
  • To analyze the impact of the recession on the market across all regions
  • To understand the market dynamics (drivers, restraints, opportunities, and challenges)
  • To analyze the market ranking of key players operating in the market
  • To analyze recent developments, partnerships, joint ventures, mergers & acquisitions, new product launches, and other activities carried out by key industry players in the market
  • To analyze the impact of the recession in terms of the most likely scenario, low-impact, and high-impact scenario
  • To conduct a case study analysis, technology analysis, supply chain analysis, trade analysis, market ecosystem analysis, tariff and regulatory landscape analysis, Porter’s Five Forces analysis, and average selling price analysis
  • To analyze the market share of key players in the motor lamination market and conduct a revenue analysis of the top five players
  • To formulate the competitive leadership mapping of key players in the motor lamination market

Car Waxing & Its impact on Car Care Products Market

The market for automobile care products is directly related to the widespread practise of car waxing, which is used to protect and maintain a car's exterior. Products for cleaning, protecting, and maintaining the appearance of cars are referred to as "car care" products. Products like automotive wax, polish, cleansers, and sealants fall under this category. To protect a vehicle's paint and clear coat from the damaging effects of UV rays, pollution, and other environmental variables, car waxing is a crucial part of automotive maintenance. Car wax creates a barrier over the paint that helps keep dirt, grime, and other contaminants from adhering to the car's surface. This facilitates cleaning of the car and aids in preserving its aesthetic over time.

The car care products market includes a wide range of products designed to assist consumers in protecting and maintaining their vehicles. Car wax is one of the most popular car care products, and there are many different types of wax on the market. Paste wax, liquid wax, and spray wax are some of the most popular types of car wax.

By extending the reach of Car Waxing services, companies are also creating new business opportunities. Companies are using these services to create new products and services and to drive their bottom line.

  • Electric and Self-Driving Vehicles: As electric and self-driving vehicles become more prevalent, there may be an increased demand for car wax and other car care products that are specifically designed for these types of vehicles.
  • Sustainable Car Care: As consumers become more environmentally conscious, there may be a growing demand for car wax and other car care products that are formulated with sustainable and eco-friendly ingredients.
  • Smart Car Care: As the Internet of Things (IoT) continues to evolve, car waxing and other car care products could become smarter and more connected.
  • Customizable Car Care: As consumers become more interested in personalization and customization, there may be a growing demand for car wax and other car care products that can be tailored to their specific needs and preferences.

Top Players in Car Waxing Market are Turtle Wax, Inc., Meguiar's Inc., Chemical Guys, Griot's Garage, Inc., P21S, Inc.

Some of the key industries that are going to get impacted because of the growth Car Waxing are,

1. Automotive Aftermarket Industry: The automotive aftermarket industry, which includes companies that produce replacement parts, accessories, and performance upgrades for vehicles, is likely to be impacted by the growing demand for car polishing and waxing products.

2. Car Detailing Industry: The car detailing industry, which offers professional detailing services to car owners, is likely to benefit from the growing popularity of car polishing and waxing.

3. Automotive Paint Industry: The automotive paint industry, which produces the paints and coatings used on cars, is likely to be impacted by the growing demand for car polishing and waxing.

4. Tourism Industry: The tourism industry may also be impacted by the growing popularity of car polishing and waxing, as car owners may be more likely to take road trips and attend car shows and other automotive events to showcase their well-maintained vehicles.

5. Chemicals and Materials: Car waxing involves the use of chemicals and materials that help protect and maintain the appearance of vehicles.

6. Retail and E-commerce: Car waxing and other car care products are often sold through retail channels, both in physical stores and online.

7. Professional Detailing Services: Many consumers choose to have their vehicles professionally detailed, which often involves the use of car wax and other car care products.

Speak to our Analyst today to know more about Car Waxing Market

Available Customizations

Along with the given market data, MarketsandMarkets offers customizations in accordance with the company’s specific needs.

Car Care Products Market, By Product Type, By Country

  • North America
  • US
  • Canada
  • Mexico
  • Asia Pacific
  • China
  • Australia
  • Japan
  • South Korea
  • India
  • Europe
  • Germany
  • UK
  • France
  • Italy
  • Spain
  • Rest of the World
  • Brazil
  • Russia
Custom Market Research Services

We will customize the research for you, in case the report listed above does not meet with your exact requirements. Our custom research will comprehensively cover the business information you require to help you arrive at strategic and profitable business decisions.

Request Customization

Instant Answers with GPT - Ask Now!

Ask real questions. Get complete answers !
Report Code
AT 7197
Published ON
Dec, 2022
Choose License Type
BUY NOW
  • SHARE
X
Request Customization
Speak to Analyst
Speak to Analyst
OR FACE-TO-FACE MEETING
PERSONALIZE THIS RESEARCH
  • Triangulate with your Own Data
  • Get Data as per your Format and Definition
  • Gain a Deeper Dive on a Specific Application, Geography, Customer or Competitor
  • Any level of Personalization
REQUEST A FREE CUSTOMIZATION
LET US HELP YOU!
  • What are the Known and Unknown Adjacencies Impacting the Car Care Products Market
  • What will your New Revenue Sources be?
  • Who will be your Top Customer; what will make them switch?
  • Defend your Market Share or Win Competitors
  • Get a Scorecard for Target Partners
CUSTOMIZED WORKSHOP REQUEST
knowledgestore logo

Want to explore hidden markets that can drive new revenue in Car Care Products Market?

Find Hidden Markets
  • Call Us
  • +1-888-600-6441 (Corporate office hours)
  • +1-888-600-6441 (US/Can toll free)
  • +44-800-368-9399 (UK office hours)
CONNECT WITH US
ABOUT TRUST ONLINE
©2024 MarketsandMarkets Research Private Ltd. All rights reserved
DMCA.com Protection Status
Website Feedback