Capacity Management Market by Component (Solutions, and Services), Organization Size (Large Enterprise, and SMES), Deployment Type (Cloud, and On-Premises), Vertical (IT, Telecom, Healthcare, Manufacturing BFSI), and Region - Global Forecast to 2023


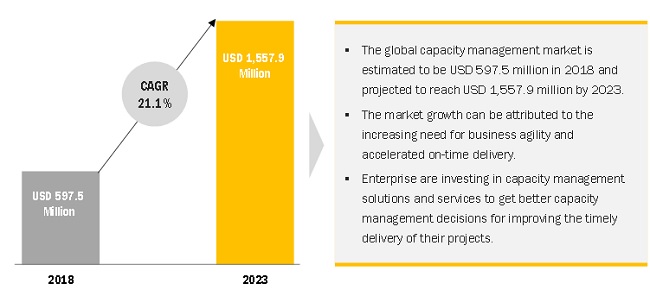
[133 Pages Report] Capacity management solutions empower enterprises and enable them to plan their IT infrastructure and resource capacity efficiently to avoid outages and optimize the costs incurred toward under-utilized resources. These solutions enable enterprises to collect the data from different processes and infrastructure units to provide a holistic view of the entire IT resource and infrastructure on a single platform. The global capacity management market was estimated to be USD 597.5 million in 2018 and is projected to be USD 1.55 billion in 2023 .
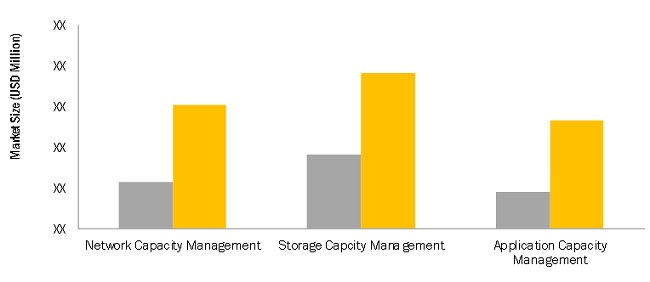
Application capacity management segment is expected to grow at the highest CAGR during the forecast period
The application capacity management segment is expected to grow at the highest CAGR during the forecast period. The increasing adoption of application capacity management solutions among enterprises to effectively manage applications and improve the customer experience is one of the major factors expected to drive the market growth globally.
Small and medium-sized enterprises segment is expected to register a higher CAGR during the forecast period
The rapid deployment of capacity management solutions by SMEs to maximize investments on infrastructure is one of the major reasons expected to drive the market growth for SMEs.
The cloud deployment type is expected to grow at a higher CAGR during the forecast period. Enhanced security features, interactive dashboards, ease of flexibility, and better scalability are some of the major factors encouraging enterprises across the globe to adopt the cloud deployment type.
North America is expected to hold the largest market share while Asia Pacific is expected to register the highest CAGR during the forecast period. The quick pace of development in the telecom and IT verticals is expected to increase the deployment of capacity management solutions across all regions.
Market Dynamics
Driver: Increased need for cost optimization and effective utilization of IT infrastructures
The faster pace of technological developments has led to the higher adoption of new technologies among ICT enterprises. The adoption of new technologies, in turn, has smoothened the enterprises� business processes. However, dynamic market requirements affect organizations� demand and supply match. This further leads to capacity issues in IT services, thereby hampering the organizations� productivity and resource utilization. To avoid this, organizations are deploying effective capacity management solutions for effectively allocating and utilizing their IT resources, depending on the demand and optimizations costs.
Restraint: Low adoption of capacity management solution among SMEs
Globally, SMEs are the backbone of a country�s economy, contributing significantly to the Gross Domestic Product (GDP). The SMEs are growing substantially in developing economies and are early technology adopters. However, the adoption rate of capacity management solutions among the SMEs is estimated to be slower, due to the lack of awareness, and less IT infrastructure complexities. These enterprises find capacity management solutions and services expensive enough to manage their limited IT infrastructures and resources and prefer managing their capacity requirements traditionally.
Opportunity: Increasing complexities in IT infrastructures
The technological evolution in the ICT space has empowered enterprises to improve their business processes and productivity. Following the evolution, organizations have adopted and integrated new technologies into their existing infrastructure. The integration of legacy systems with new technologies has further increased the complexities of IT infrastructures. Furthermore, enterprises find it difficult to effectively manage their infrastructures while also focusing on their core competencies. These complexities make it difficult for enterprises to collect data for planning and managing their IT capacity to efficiently match demand and supply-side requirements and optimize resource allocation and utilization. Therefore, the enterprises require capacity management solutions and services to improve their operational efficiency and optimize the costs and IT infrastructures to avoid outages and overspending. These factors are anticipated to provide opportunities for the growth of vendors in this market.
Challenge: Insufficient data gathering and retention for effective capacity management
Effective IT capacity management requires appropriate data from IT infrastructure units and resources to analyze and predict capacity utilization and the need for effective resource utilization. Efficient capacity management requires the collection, storage, and processing of data to convert it into actionable insights for matching the demand and supply-side requirements. Gathering the data from legacy as well as new infrastructure units and storing it in a central platform requires a systematic approach. However, solution providers find it difficult to gather the data from the enterprise�s scattered infrastructure, owing to the deficits in the infrastructure. Such deficits make it difficult to gather the required data for analyzing and predicting capacity utilization and management.
Scope of the Report
|
Report Metric |
Details |
|
Market size available for years |
2016�2023 |
|
Base year considered |
2017 |
|
Forecast period |
2018�2023 |
|
Forecast units |
USD million |
|
Segments covered |
Component, Organization, Deployment, Vertical, and Region |
|
Geographies covered |
North America (US, Canada), APAC, Europe (UK, Rest of Europe), MEA, and Latin America |
|
Companies covered |
International Business Machines Corporation (IBM), BMC Software, Inc. (BMC Software), CA Technologies (CA Technologies), NetApp (NetApp), Riverbed Technology (Riverbed), Hewlett Packard Enterprise Development LP (HPE), TEOCO Corporation (TEOCO), VMware, Inc (VMware), Sumerian (Sumerian), Syncsort (Syncsort), TeamQuest Corporation (TeamQuest), Nlyte (Nlyte Software), CPT Global (CPT Global), Neubrain, LLC. (Neubrain), Axway (Axway), IDERA, Inc. (IDERA), SolarWinds Worldwide, LLC. (SolarWinds), Turbonomic, Inc. (Turbonomic), Aspire (Aspire Technology), ASG Technologies (ASG Technologies), Zoho Corp (ManageEngine), Planview, Inc. (Planview), and HelpSystems (HelpSystems) |
The research report segments the market into the following submarkets:
By Component
- Solutions
- Network Capacity Management
- Storage Capacity Management
- Application Capacity Management
- Services
- Implementation and Testing
- Consulting
- Training and Education
- Support and Maintenance
By Organization Size
- Small and Medium-sized Enterprises (SMEs)
- Large enterprises
By Deployment Type
- On-premises
- Cloud
By Vertical
- Telecom
- Information Technology (IT)
- Healthcare
- Manufacturing
- BFSI
- Retail
- Hospitality
- Government and public
- Others (education, energy and utilities, and oil and gas)
By Region
- North America
- Europe
- APAC
- MEA
- Latin America
Key Market Players
IBM, BMC Software, CA Technologies, NetApp, Riverbed Technology
Recent Developments
- In January 2018, CA Technologies announced the opening of its new Italian headquarters in Milan. This business expansion is aimed at improving the market presence in the region and leveraging untapped opportunities.
- In December 2017, IBM partnered with Blue Prism to deliver enterprises across the world with scalable, secure, and easy-to-use digital workspace capabilities. Digital workspace capabilities would enable enterprises to enhance the user experience and delivery of new products and services using intelligent automation.
- In November 2017, HPE partnered with Rackspace to offer the private cloud, OpenStack, on a pay per use model. This model has helped the companies in serving the requirements of their clientele to manage IT resources to meet the business requirements.
- In October 2017, BMC Software announced solution enhancements by integrating AI, machine learning, and predictive capabilities with its existing IT service management solutions. The upgrade would help enterprises transform their service management capabilities and add value to the existing systems. Furthermore, this upgrade would help in addressing the challenges faced while delivering services in complex multi-cloud environments.
- In October 2017, NetApp launched a series of software, including NetApp SolidFire Element OS, ONTAP, StorageGRID Webscale, and OnCommand Insight software, further strengthening the company�s Data Fabric solution portfolio. The introduction of the new software enables data fabric solutions to help customers optimize cost, accelerate and protect data, and build next-generation data center architectures. Furthermore, it helps in delivering consistent and integrated hybrid cloud services to its clientele.
Critical questions the report answers:
- What are the major drivers and challenges in the market?
- What are the largest revenue-generating regions in the market?
- Who are the key players operating in the market, and what are the factors contributing to their domination over other players?
- Which segment provides the best opportunity for growth?
To speak to our analyst for a discussion on the above findings, click Speak to Analyst
 Exclusive indicates content/data unique to MarketsandMarkets and not available with any competitors.
Table of Contents
1 Introduction (Page No. - 14)
1.1 Objectives of the Study
1.2 Market Definition
1.3 Market Scope
1.4 Years Considered for the Study
1.5 Currency
1.6 Stakeholders
2 Research Methodology (Page No. - 18)
2.1 Research Data
2.1.1 Secondary Data
2.1.2 Primary Data
2.1.2.1 Breakdown of Primaries
2.1.2.2 Key Industry Insights
2.2 Market Size Estimation
2.3 Research Assumptions and Limitations
2.3.1 Assumptions
2.3.2 Limitations
3 Executive Summary (Page No. - 24)
4 Premium Insights (Page No. - 28)
4.1 Attractive Market Opportunities in the Capacity Management Market
4.2 Market By Component
4.3 Market By Deployment Type
4.4 Market By Service
4.5 Market By Vertical and Region
5 Market Overview and Industry Trends (Page No. - 31)
5.1 Introduction
5.2 Capacity Management Market Dynamics
5.2.1 Drivers
5.2.1.1 Increased Need for Cost Optimization and Effective Utilization of IT Infrastructures
5.2.1.2 Growing Need for Business Agility
5.2.2 Restraints
5.2.2.1 Low Adoption of Capacity Management Solution Among SMEs
5.2.3 Opportunities
5.2.3.1 Increasing Complexities in IT Infrastructures
5.2.4 Challenges
5.2.4.1 Insufficient Data Gathering and Retention for Effective Capacity Management
5.3 Use Cases
6 Capacity Management Market, By Component (Page No. - 34)
6.1 Introduction
6.2 Solutions
6.2.1 Network Capacity Management
6.2.2 Storage Capacity Management
6.2.3 Application Capacity Management
6.3 Services
6.3.1 Implementation and Testing
6.3.2 Consulting
6.3.3 Training and Education
6.3.4 Support and Maintenance
7 Capacity Management Market By, Organization Size (Page No. - 43)
7.1 Introduction
7.2 Large Enterprises
7.3 Small and Medium-Sized Enterprises
8 Market By, Deployment Type (Page No. - 47)
8.1 Introduction
8.2 On-Premises
8.3 Cloud
9 Capacity Management Market, By Vertical (Page No. - 51)
9.1 Introduction
9.2 Telecom
9.3 Information Technology
9.4 Healthcare
9.5 Manufacturing
9.6 Banking, Financial Services, and Insurance
9.7 Retail
9.8 Hospitality
9.9 Government and Public
9.10 Others
10 Capacity Management Market, By Region (Page No. - 61)
10.1 Introduction
10.2 North America
10.3 Europe
10.4 Asia Pacific
10.5 Middle East and Africa
10.6 Latin America
11 Competitive Landscape (Page No. - 80)
11.1 Overview
11.2 Prominent Players Operating in the Capacity Management Market
11.3 Competitive Scenario
11.3.1 New Product Launches
11.3.2 Business Expansions
11.3.3 Mergers and Acquisitions
11.3.4 Partnerships, Agreements, and Collaborations
12 Company Profiles (Page No. - 86)
(Business Overview, Products and Solutions/Services Offered, Recent Developments, SWOT Analysis, and MnM View)*
12.1 IBM
12.2 CA Technologies
12.3 Netapp
12.4 HPE
12.5 VMWare
12.6 CPT Global
12.7 BMC Software
12.8 Riverbed Technology
12.9 Teoco Corporation
12.10 Sumerian
12.11 Syncsort
12.12 Teamquest
12.13 Nlyte Software
12.14 Key Innovators
12.14.1 Axway
12.14.2 Idera
12.14.3 Solarwinds
12.14.4 Turbonomic
12.14.5 Aspire
12.14.6 ASG Technologies
12.14.7 Manageengine
12.14.8 Planview
12.14.9 Helpsystems
12.14.10 Neubrain
*Details on Business Overview, Products and Solutions/Services Offered, Recent Developments, SWOT Analysis, and MnM View might not be captured in case of unlisted companies.
13 Appendix (Page No. - 125)
13.1 Discussion Guide
13.2 Knowledge Store: Marketsandmarkets� Subscription Portal
13.3 Introducing RT: Real-Time Market Intelligence
13.4 Available Customization
13.5 Related Reports
13.6 Author Details
List of Tables (65 Tables)
Table 1 United States Dollar Exchange Rate, 2014�2017
Table 2 Capacity Management Market Size and Growth, 2016�2023 (USD Million, Y-O-Y%)
Table 3 Market Use Cases
Table 4 Market Size By Solution, 2016�2023 (USD Million)
Table 5 Network Capacity Management: Market Size, By Region, 2016�2023 (USD Million)
Table 6 Storage Capacity Management: Market Size, By Region, 2016�2023 (USD Million)
Table 7 Application Capacity Management: Market Size, By Region, 2016�2023 (USD Million)
Table 8 Market, By Service, 2016�2023 (USD Million)
Table 9 Implementation and Testing: Market Size, By Region 2016�2023 (USD Million)
Table 10 Consulting: Market Size, By Region, 2016�2023 (USD Million)
Table 11 Training and Education: Market Size, By Region, 2016�2023 (USD Million)
Table 12 Support and Maintenance: Market Size, By Region, 2016�2023 (USD Million)
Table 13 Capacity Management Market Size, By Organization Size, 2016�2023 (USD Million)
Table 14 Large Enterprises: Market Size, By Region, 2016�2023 (USD Million)
Table 15 Small and Medium-Sized Enterprises: Market Size, By Region, 2016�2023 (USD Million)
Table 16 Market Size By Deployment Type, 2016�2023 (USD Million)
Table 17 On-Premises: Market Size, By Region, 2016�2023(USD Million)
Table 18 Cloud: Market Size, By Region, 2016�2023(USD Million)
Table 19 Market Size, By Vertical, 2016�2023 (USD Million)
Table 20 Telecom: Market Size, By Region, 2016�2023 (USD Million)
Table 21 Information Technology: Market Size, By Region, 2016�2023 (USD Million)
Table 22 Healthcare: Market Size, By Region, 2016�2023 (USD Million)
Table 23 Manufacturing: Market Size, By Region, 2016�2023 (USD Million)
Table 24 Banking, Financial Services, and Insurance: Market Size, By Region, 2016�2023 (USD Million)
Table 25 Retail: Market Size, By Region, 2016�2023 (USD Million)
Table 26 Hospitality: Market Size, By Region, 2016�2023 (USD Million)
Table 27 Government and Public: Market Size, By Region, 2016�2023 (USD Million)
Table 28 Others: Market Size, By Region, 2016�2023 (USD Million)
Table 29 Capacity Management Market Size, By Region, 2016�2023 (USD Million)
Table 30 North America: Market Size By Country, 2016�2023 (USD Million)
Table 31 North America: Market Size By Component, 2016�2023 (USD Million)
Table 32 North America: Market Size By Solution, 2016�2023 (USD Million)
Table 33 North America: Market Size By Service, 2016�2023 (USD Million)
Table 34 North America: Market Size By Organization Size, 2016�2023 (USD Million)
Table 35 North America: Market Size By Deployment Type, 2016�2023 (USD Million)
Table 36 North America: Market Size By Vertical, 2016�2023 (USD Million)
Table 37 Europe: Capacity Management Market Size, By Country, 2016�2023 (USD Million)
Table 38 Europe: Market Size By Component, 2016�2023 (USD Million)
Table 39 Europe: Market Size By Solution, 2016�2023 (USD Million)
Table 40 Europe: Market Size By Service, 2016�2023 (USD Million)
Table 41 Europe: Market Size By Organization Size, 2016�2023 (USD Million)
Table 42 Europe: Market Size By Deployment Type, 2016�2023 (USD Million)
Table 43 Europe: Market Size By Vertical, 2016�2023 (USD Million)
Table 44 Asia Pacific: Market Size, By Component, 2016�2023 (USD Million)
Table 45 Asia Pacific: Market Size By Solution, 2016�2023 (USD Million)
Table 46 Asia Pacific: Market Size By Service, 2016�2023 (USD Million)
Table 47 Asia Pacific: Market Size By Organization Size, 2016�2023 (USD Million)
Table 48 Asia Pacific: Market Size By Deployment Type, 2016�2023 (USD Million)
Table 49 Asia Pacific: Capacity Management Market Size, By Vertical, 2016�2023 (USD Million)
Table 50 Middle East and Africa: Market Size By Component, 2016�2023 (USD Million)
Table 51 Middle East and Africa: Market Size By Solution, 2016�2023 (USD Million)
Table 52 Middle East and Africa: Market Size By Service, 2016�2023 (USD Million)
Table 53 Middle East and Africa: Market Size By Organization Size, 2016�2023 (USD Million)
Table 54 Middle East and Africa: Market Size By Deployment Type, 2016�2023 (USD Million)
Table 55 Middle East and Africa: Market Size By Vertical, 2016�2023 (USD Million)
Table 56 Latin America: Capacity Management Market Size, By Component, 2016�2023 (USD Million)
Table 57 Latin America: Market Size, By Solution, 2016�2023(USD Million)
Table 58 Latin America: Market Size, By Service, 2016�2023 (USD Million)
Table 59 Latin America: Market Size, By Organization Size, 2016�2023 (USD Million)
Table 60 Latin America: Market Size, By Deployment Type, 2016�2023 (USD Million)
Table 61 Latin America: Market Size, By Vertical, 2016�2023 (USD Million)
Table 62 New Product Launches, 2016�2017
Table 63 Business Expansions, 2016�2018
Table 64 Mergers and Acquisitions, 2016�2017
Table 65 Partnerships, Agreements, and Collaborations, 2016�2017
List of Figures (39 Figures)
Figure 1 Capacity Management Market Segmentation
Figure 2 Market Research Design
Figure 3 Breakdown of Primaries: By Company, Designation, and Region
Figure 4 Data Triangulation
Figure 5 Market Size Estimation Methodology: Bottom-Up Approach
Figure 6 Market Size Estimation Methodology: Top-Down Approach
Figure 7 Capacity Management Market: Assumptions
Figure 8 Market Segmentation
Figure 9 Market By Solution
Figure 10 Market By Organization Size
Figure 11 Market By Region
Figure 12 Growing Need for Business Agility is Expected to Drive the Growth of the Market During the Forecast Period
Figure 13 Services Segment is Expected to Grow at A Higher CAGR During the Forecast Period
Figure 14 Cloud Deployment Type is Expected to Grow at A Higher CAGR During the Forecast Period
Figure 15 Consulting Segment is Expected to Grow at the Highest CAGR During the Forecast Period
Figure 16 Information Technology Vertical and North America Region are Estimated to Dominate the Market in 2018
Figure 17 Capacity Management Market: Drivers, Restraints, Opportunities, and Challenges
Figure 18 Application Capacity Management Segment is Expected to Grow at the Highest CAGR During the Forecast Period
Figure 19 Consulting Segment is Expected to Grow at the Highest CAGR During the Forecast Period
Figure 20 Small and Medium-Sized Enterprises Segment is Expected to Register A Higher CAGR During the Forecast Period
Figure 21 Cloud Deployment Type is Expected to Grow at A Higher CAGR During the Forecast Period
Figure 22 Banking, Financial Services, and Insurance Vertical is Expected to Grow at the Highest CAGR During the Forecast Period
Figure 23 North America is Expected to Hold the Largest Market Share During the Forecast Period
Figure 24 Asia Pacific is Expected to Register the Highest CAGR During the Forecast Period
Figure 25 North America: Market Snapshot
Figure 26 Asia Pacific: Market Snapshot
Figure 27 Key Developments By the Leading Players in the Capacity Management Market During 2014�2018
Figure 28 IBM: Company Snapshot
Figure 29 IBM: SWOT Analysis
Figure 30 CA Technologies: Company Snapshot
Figure 31 CA Technologies: SWOT Analysis
Figure 32 Netapp: Company Snapshot
Figure 33 Netapp: SWOT Analysis
Figure 34 HPE: Company Snapshot
Figure 35 HPE: SWOT Analysis
Figure 36 VMWare: Company Snapshot
Figure 37 VMWare: SWOT Analysis
Figure 38 CPT Global: Company Snapshot
Figure 39 Axway: Company Snapshot


Growth opportunities and latent adjacency in Capacity Management Market