Butylated Hydroxytoluene Market by Grade (Food, Technical), End-Use Industry (Plastic & Rubber, Food & Beverage, Animal Feed, Personal Care) and Region (APAC, Europe, North America, South America, Middle East & Africa) - Global Forecast to 2027
Updated on : August 28, 2025
Butylated Hydroxytoluene Market
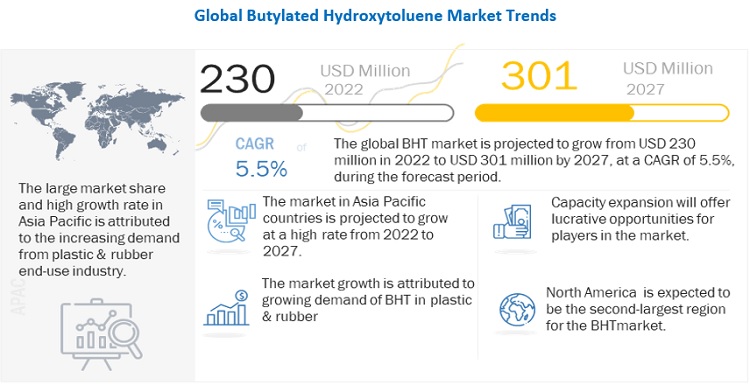
The global butylated hydroxytoluene market was valued at USD 230 million in 2022 and is projected to reach USD 301 million by 2027, growing at 5.5% cagr from 2022 to 2027. Butylated hydroxytoluene is extensively used in the plastic & rubber, animal feed and food & beverage industries. Thus, the growth of the butylated hydroxytoluene market is directly associated with the growth of these sectors. The rise in demand for butylated hydroxytoluene from emerging economies and the growth of the plastic & rubber industry are creating growth opportunities in the market.
To know about the assumptions considered for the study, Request for Free Sample Report
Covid-19 Impact
In 2020, the butylated hydroxytoluene market was impacted by the COVID-19 pandemic due to the low plastic and rubber production. The industry for plastic and rubber goods has been severely constrained in 2020 by the COVID-19. Trade restrictions disrupted supply chains, and government-imposed worldwide lockdowns caused demand to fall. As a result, several factories in the food and beverage processing, personal care, and rubber industries were forced to close. Due to this, demand for butylated hydroxytoluene has decreased internationally. The market started recovering from year 2021.
Butylated Hydroxytoluene Market Dynamics
Driver: Growth in global plastics production
BHT is extensively used as an antioxidant in the production of plastics. Oxidation is an important limiting factor in all thermoplastics and thermosetting resins. Its adverse effect includes loss of flexibility, loss of tensile strength and elongation, color change, reduced impact resistance, surface deterioration, and cracking. It also affects the molecular weight of a polymer, which in turn affects its other properties. BHT plays a vital role in plastics production to retard the oxidation. According to the Plastic Atlas 2019, the global plastics production was 460 million tons in 2019. China is the largest producer of plastics globally accounting for one-third of the total share in 2019. The growing demand from end-use industries, such as packaging, automotive, construction, and agriculture, are expected to drive the production of plastics in emerging economies as well as Europe and North America. These factors are expected to create a hugedemand for BHT in the stabilization of plastics.
Restraint: Growing concern regarding the use of BHT in food & beverage industry
The food & beverage industry is a major BHT consumer. BHT is used as an antioxidant in cake mixes, cereal-based snacks, chewing gum, dehydrated potato, flaked and mashed potato, sauces, processed nuts, milk powders, frying oil, snack foods, condiments, heat-treated foodstuffs, dry mixes of beverages and desserts, ready meals, precooked cereals, glazed fruits, poultry, and meat products, and active dry yeast.
However, studies suggest that consuming unusually large quantities of BHT may have some interactions with hormonal birth control methods or steroid hormones. It may also increase the levels of liver enzymes. According to the US Department of Health and Human Services, National Toxicology Program’s Report on Carcinogens, butylated hydroxyanisole (BHA) “is reasonably anticipated to be a human carcinogen.” It may also trigger allergic reactions and hyperactivity, while BHT can cause organ system toxicity. Such attributes are restraining the growth of the BHT market, despite the current FDA approval for the use of BHT by food manufacturers. The use of BHT in food products is mostly banned in Australia, Canada, New Zealand, Japan, and throughout Europe.
Opportunity: Industrial growth in Asia Pacific
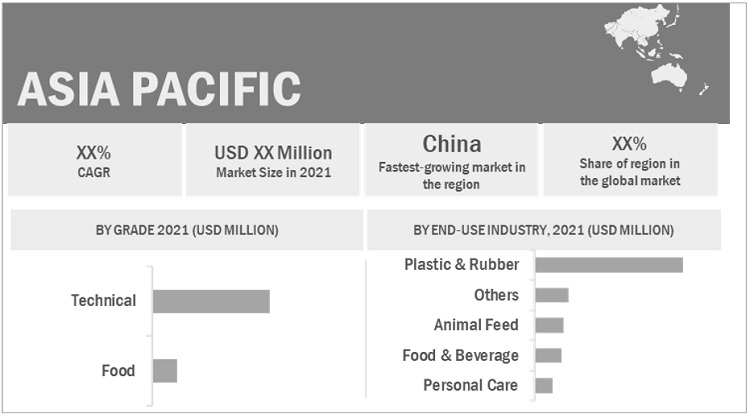
Asia Pacific is the global manufacturing hub for the chemical industry, accounting for more than 50% of the global polymer production output. Increasing per capita expenditure on healthcare and food products, huge consumer base, rising urban population, low labor costs, and easy availability of raw materials are attracting global petrochemicals, personal care, and food & beverage manufacturers to shift their production facilities to the region. Due to these reasons, several companies have also invested in Asia Pacific countries, such as China. China is estimated to be the largest and fastest-growing market for BHT in the region during the forecast period. Thus, the industrial growth in the region is expected to fuel the consumption of BHT as an antioxidant.
Challenge: Development of sustainable and non-toxic alternatives to BHT
Pet-food producers and consumers are highly concerned about the safety and long-term impact of synthetic additives in pet-food, which in turn has impelled the demand for natural, safe, and sustainable feed ingredients. This factor is driving the use of antioxidant products for pet-food stabilization, which can provide prominent benefits to both pet-food manufacturers and consumers.
BHT is the synthetic antioxidant commonly utilized to stabilize pet-food and pet-food ingredients. BHT gets bio-accumulated in the environment and is identified to be very toxic to aquatic organisms. Thus, pet antioxidant manufacturers are focusing on the development of safe and sustainable products. For instance, Kemin Industries Inc., a US-based feed ingredient manufacturer, has developed natural antioxidants as an alternative to BHT. These natural antioxidants have now become a preferred choice for animal feed owing to their non-toxic nature. Such initiatives to develop alternatives are becoming a challenge for the BHT market.
Butylated Hydroxytoluene Market Ecosystem
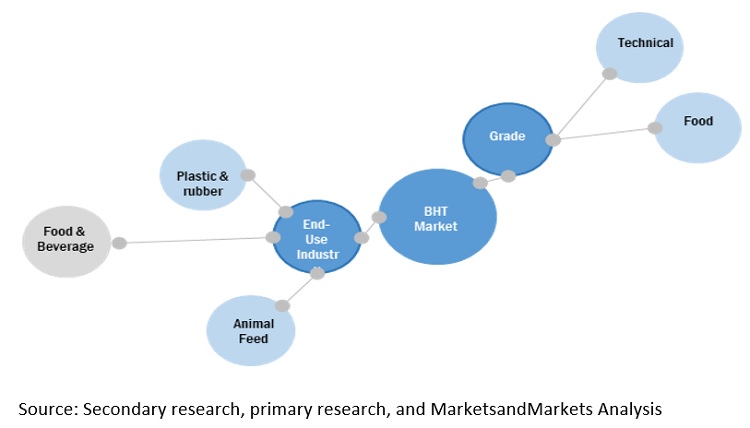
Plastic & rubber to be the largest end-use industry in butylated hydroxytoluene market
The plastic & rubber segment accounts for the largest share of the butylated hydroxytoluene market, with a share of 57.7%, in terms of value, in 2021. The market in the plastic & rubber end-use industry is expected to be the largest and the fastest-growing segment, in terms of volume and value, during the forecast period. BHT is used as an antioxidant to stabilize polymer during processing and protect it throughout the service life of the finished product. It is recognized as safe and is also approved for use in plastic food containers and wrappings.
APAC region to lead the global butylated hydroxytoluene market by 2027
Asia Pacific was the largest market for butylated hydroxytoluene in terms of value, in 2021. Emerging economies in the region are expected to experience significant demand for butylated hydroxytoluene because of the expansion of plastic & rubber and food & beverage sectors due to rapid economic development and government initiatives toward economic development. In addition to this, the growing population in these countries represents a strong customer base. Asia Pacific is the fastest-growing market for butylated hydroxytoluene globally, in terms of value and volume, during the forecast period.
To know about the assumptions considered for the study, download the pdf brochure
Butylated Hydroxytoluene Market Players
The butylated hydroxytoluene market is dominated by a few globally established players, such as Sasol Limited (South Africa), LANXESS (Germany), Eastman Chemical Company (US), Oxiris Chemicals S.A. (Spain), Camlin Fine Science (India), Finoric LLC (US) and others.
Butylated Hydroxytoluene Market Report Scope
|
Report Metric |
Details |
|
Market size available for years |
2020–2027 |
|
Base year considered |
2021 |
|
Forecast period |
2022–2027 |
|
Forecast units |
Value (USD Million) and Volume (Ton) |
|
Segments covered |
Grade, End-Use Industry and Region |
|
Geographies covered |
North America, Asia Pacific, Europe, Middle East & Africa, and South America |
|
Companies covered |
The major players include Sasol Limited (South Africa), LANXESS (Germany), Eastman Chemical Company (US), Oxiris Chemicals S.A. (Spain), Camlin Fine Science (India), Finoric LLC (US) and others. |
This research report categorizes the Butylated hydroxytoluene based on grade, end-use industry and region.
On the basis of grade:
- Technical
- Food
On the basis of End-Use Industry:
- Plastic & rubber
- Food & beverage
- Animal feed
- Personal care
- Others
On the basis of region:
- North America
- Europe
- Asia Pacific
- Middle East & Africa
- South America
Frequently Asked Questions (FAQ):
What is the current size of global butylated hydroxytoluene market?
The global butylated hydroxytoluene market is projected to grow from USD 230 million in 2022 to USD 301 million by 2027, at a CAGR of 5.5% from 2022 to 2027.
How is the butylated hydroxytoluene market aligned?
The butylated hydroxytoluene market is competitive, and have number of manufacturer operating at the regional, and domestic level.
What are the latest ongoing trends in the butylated hydroxytoluene market?
The latest ongoing trends in the butylated hydroxytoluene market are increasing demand for butylated hydroxytoluene in manufacturing of plastic & rubber. .
To speak to our analyst for a discussion on the above findings, click Speak to Analyst

TABLE OF CONTENTS
1 INTRODUCTION (Page No. - 19)
1.1 STUDY OBJECTIVES
1.2 MARKET DEFINITION
1.3 INCLUSIONS & EXCLUSIONS
TABLE 1 INCLUSIONS & EXCLUSIONS
1.4 STUDY SCOPE
FIGURE 1 BHT MARKET SEGMENTATION
1.4.1 YEARS CONSIDERED
1.4.2 REGIONAL SCOPE
FIGURE 2 BHT MARKET, BY REGION
1.5 CURRENCY CONSIDERED
1.6 UNITS CONSIDERED
1.7 STAKEHOLDERS
1.8 LIMITATIONS
1.9 SUMMARY OF CHANGES
2 RESEARCH METHODOLOGY (Page No. - 23)
2.1 RESEARCH DATA
FIGURE 3 BHT MARKET: RESEARCH DESIGN
2.1.1 SECONDARY DATA
2.1.1.1 Key data from secondary sources
2.1.2 PRIMARY DATA
2.1.2.1 Key data from primary sources
FIGURE 4 LIST OF STAKEHOLDERS INVOLVED AND BREAKDOWN OF PRIMARY INTERVIEWS
2.2 MARKET SIZE ESTIMATION
FIGURE 5 MARKET SIZE ESTIMATION: BOTTOM-UP APPROACH
FIGURE 6 MARKET SIZE ESTIMATION: TOP-DOWN APPROACH
2.3 DATA TRIANGULATION
FIGURE 7 BHT MARKET: DATA TRIANGULATION
2.4 ASSUMPTIONS
2.5 LIMITATIONS
3 EXECUTIVE SUMMARY (Page No. - 30)
FIGURE 8 TECHNICAL GRADE SEGMENT TO DOMINATE BHT MARKET
FIGURE 9 PLASTIC & RUBBER END-USE INDUSTRY TO LEAD BHT MARKET
FIGURE 10 ASIA PACIFIC LED BHT MARKET
4 PREMIUM INSIGHTS (Page No. - 32)
4.1 SIGNIFICANT OPPORTUNITIES IN BHT MARKET
FIGURE 11 GROWTH IN PLASTIC PRODUCTION DRIVING BHT MARKET
FIGURE 12 ASIA PACIFIC TO BE FASTEST-GROWING MARKET
4.2 ASIA PACIFIC: BHT MARKET
FIGURE 13 CHINA HELD LARGEST SHARE OF BHT MARKET
4.3 BHT MARKET: KEY COUNTRIES
FIGURE 14 CHINA TO WITNESS HIGHEST CAGR
5 MARKET OVERVIEW (Page No. - 34)
5.1 INTRODUCTION
5.2 MARKET DYNAMICS
FIGURE 15 DRIVERS, RESTRAINTS, OPPORTUNITIES, AND CHALLENGES IN BHT MARKET
5.2.1 DRIVERS
5.2.1.1 Growth in global plastics production
FIGURE 16 GLOBAL PLASTIC PRODUCTION 1950-2030
5.2.1.2 High demand from the prepared food industry
5.2.2 RESTRAINTS
5.2.2.1 Growing concerns regarding the use of BHT in food & beverage industry
5.2.3 OPPORTUNITIES
5.2.3.1 Industrial growth in Asia Pacific
5.2.4 CHALLENGES
5.2.4.1 Development of sustainable and non-toxic alternatives to BHT
5.3 PORTER’S FIVE FORCES ANALYSIS
FIGURE 17 BHT MARKET: PORTER’S FIVE FORCES ANALYSIS
5.3.1 THREAT OF NEW ENTRANTS
5.3.2 THREAT OF SUBSTITUTES
5.3.3 BARGAINING POWER OF SUPPLIERS
5.3.4 BARGAINING POWER OF BUYERS
5.3.5 INTENSITY OF COMPETITIVE RIVALRY
5.4 MACROECONOMIC INDICATORS
TABLE 2 REAL GDP GROWTH, 2014–2021
6 BHT MARKET, BY GRADE (Page No. - 40)
6.1 INTRODUCTION
FIGURE 18 TECHNICAL TO BE LARGER GRADE SEGMENT IN BHT MARKET
TABLE 3 BHT MARKET SIZE, BY GRADE, 2020–2027 (USD MILLION)
TABLE 4 BHT MARKET SIZE, BY GRADE, 2020–2027 (TON)
6.2 TECHNICAL GRADE
6.2.1 INCREASING PLASTICS PRODUCTION TO DRIVE SEGMENT
6.3 FOOD GRADE
6.3.1 HIGH DEMAND FOR FOOD-GRADE BHT IN CHEWING GUMS
7 BHT MARKET, BY END-USE INDUSTRY (Page No. - 43)
7.1 INTRODUCTION
FIGURE 19 PLASTIC & RUBBER END-USE INDUSTRY TO LEAD BHT MARKET
TABLE 5 BHT MARKET SIZE, BY END-USE INDUSTRY, 2020–2027 (USD MILLION)
TABLE 6 BHT MARKET SIZE, BY END-USE INDUSTRY, 2020–2027 (TON)
7.2 PLASTIC & RUBBER
7.2.1 DEMAND FOR BHT IN POLYPROPYLENE AND POLYETHYLENE STABILIZATION
7.3 FOOD & BEVERAGE
7.3.1 USE OF BHT CHARACTERIZED BY STRINGENT REGULATIONS
7.4 ANIMAL FEED
7.4.1 DEMAND FOR POULTRY FEED BOOSTS MARKET
7.5 PERSONAL CARE
7.5.1 MAKEUP PRODUCTS INCREASING DEMAND FOR BHT
7.6 OTHERS
8 REGIONAL ANALYSIS (Page No. - 47)
8.1 INTRODUCTION
FIGURE 20 BHT MARKET IN ASIA PACIFIC TO GROW AT HIGHEST CAGR DURING FORECAST PERIOD
TABLE 7 BHT MARKET SIZE, BY REGION, 2020–2027 (USD MILLION)
TABLE 8 BHT MARKET SIZE, BY REGION, 2020–2027 (TON)
8.2 ASIA PACIFIC
FIGURE 21 ASIA PACIFIC: BHT MARKET SNAPSHOT
TABLE 9 ASIA PACIFIC: BHT MARKET SIZE, BY COUNTRY, 2020–2027 (USD MILLION)
TABLE 10 ASIA PACIFIC: BHT MARKET SIZE, BY COUNTRY, 2020–2027 (TON)
TABLE 11 ASIA PACIFIC: BHT MARKET SIZE, BY GRADE, 2020–2027 (USD MILLION)
TABLE 12 ASIA PACIFIC: BHT MARKET SIZE, BY GRADE, 2020–2027 (TON)
TABLE 13 ASIA PACIFIC: BHT MARKET SIZE, BY END-USE INDUSTRY, 2020–2027 (USD MILLION)
TABLE 14 ASIA PACIFIC: BHT MARKET SIZE, BY END-USE INDUSTRY, 2020–2027 (TON)
8.2.1 CHINA
8.2.1.1 Well-established polymers industry in country
TABLE 15 CHINA: BHT MARKET SIZE, BY GRADE, 2020–2027 (USD MILLION)
TABLE 16 CHINA: BHT MARKET SIZE, BY GRADE, 2020–2027 (TON)
TABLE 17 CHINA: BHT MARKET SIZE, BY END-USE INDUSTRY, 2020–2027 (USD MILLION)
TABLE 18 CHINA: BHT MARKET SIZE, BY END-USE INDUSTRY, 2020–2027 (TON)
8.2.2 JAPAN
8.2.2.1 Presence of key automotive manufacturers
TABLE 19 JAPAN: BHT MARKET SIZE, BY GRADE, 2020–2027 (USD MILLION)
TABLE 20 JAPAN: BHT MARKET SIZE, BY GRADE, 2020–2027 (TON)
TABLE 21 JAPAN: BHT MARKET SIZE, BY END-USE INDUSTRY, 2020–2027 (USD MILLION)
TABLE 22 JAPAN: BHT MARKET SIZE, BY END-USE INDUSTRY, 2020–2027 (TON)
8.2.3 INDIA
8.2.3.1 Government initiatives have a positive impact
TABLE 23 INDIA: BHT MARKET SIZE, BY GRADE, 2020–2027 (USD MILLION)
TABLE 24 INDIA: BHT MARKET SIZE, BY GRADE, 2020–2027 (TON)
TABLE 25 INDIA: BHT MARKET SIZE, BY END-USE INDUSTRY, 2020–2027 (USD MILLION)
TABLE 26 INDIA: BHT MARKET SIZE, BY END-USE INDUSTRY, 2020–2027 (TON)
8.2.4 SOUTH KOREA
8.2.4.1 Growth in pharmaceutical industry
TABLE 27 SOUTH KOREA: BHT MARKET SIZE, BY GRADE, 2020–2027 (USD MILLION)
TABLE 28 SOUTH KOREA: BHT MARKET SIZE, BY GRADE, 2020–2027 (TON)
TABLE 29 SOUTH KOREA: BHT MARKET SIZE, BY END-USE INDUSTRY, 2020–2027 (USD MILLION)
TABLE 30 SOUTH KOREA: BHT MARKET SIZE, BY END-USE INDUSTRY, 2020–2027 (TON)
8.2.5 REST OF ASIA PACIFIC
TABLE 31 REST OF ASIA PACIFIC: BHT MARKET SIZE, BY GRADE, 2020–2027 (USD MILLION)
TABLE 32 REST OF ASIA PACIFIC: BHT MARKET SIZE, BY GRADE, 2020–2027 (TON)
TABLE 33 REST OF ASIA PACIFIC: BHT MARKET SIZE, BY END-USE INDUSTRY, 2020–2027 (USD MILLION)
TABLE 34 REST OF ASIA PACIFIC: BHT MARKET SIZE, BY END-USE INDUSTRY, 2020–2027 (TON)
8.3 EUROPE
TABLE 35 EUROPE: BHT MARKET SIZE, BY COUNTRY, 2020–2027 (USD MILLION)
TABLE 36 EUROPE: BHT MARKET SIZE, BY COUNTRY, 2020–2027 (TON)
TABLE 37 EUROPE: BHT MARKET SIZE, BY GRADE, 2020–2027 (USD MILLION)
TABLE 38 EUROPE: BHT MARKET SIZE, BY GRADE, 2020–2027 (TON)
TABLE 39 EUROPE: BHT MARKET SIZE, BY END-USE INDUSTRY, 2020–2027 (USD MILLION)
TABLE 40 EUROPE: BHT MARKET SIZE, BY END-USE INDUSTRY, 2020–2027 (TON)
8.3.1 GERMANY
8.3.1.1 Established chemical industry to create high-growth opportunities
TABLE 41 GERMANY: BHT MARKET SIZE, BY GRADE, 2020–2027 (USD MILLION)
TABLE 42 GERMANY: BHT MARKET SIZE, BY GRADE, 2020–2027 (TON)
TABLE 43 GERMANY: BHT MARKET SIZE, BY END-USE INDUSTRY, 2020–2027 (USD MILLION)
TABLE 44 GERMANY: BHT MARKET SIZE, BY END-USE INDUSTRY, 2020–2027 (TON)
8.3.2 ITALY
8.3.2.1 Growing plastic production in country
TABLE 45 ITALY: BHT MARKET SIZE, BY GRADE, 2020–2027 (USD MILLION)
TABLE 46 ITALY: BHT MARKET SIZE, BY GRADE, 2020–2027 (TON)
TABLE 47 ITALY: BHT MARKET SIZE, BY END-USE INDUSTRY, 2020–2027 (USD MILLION)
TABLE 48 ITALY: BHT MARKET SIZE, BY END-USE INDUSTRY, 2020–2027 (TON)
8.3.3 FRANCE
8.3.3.1 Increasing opportunities for BHT manufacturers due to growing international investments
TABLE 49 FRANCE: BHT MARKET SIZE, BY GRADE, 2020–2027 (USD MILLION)
TABLE 50 FRANCE: BHT MARKET SIZE, BY GRADE, 2020–2027 (TON)
TABLE 51 FRANCE: BHT MARKET SIZE, BY END-USE INDUSTRY, 2020–2027 (USD MILLION)
TABLE 52 FRANCE: BHT MARKET SIZE, BY END-USE INDUSTRY, 2020–2027 (TON)
8.3.4 SPAIN
8.3.4.1 Country is a net exporter of food products
TABLE 53 SPAIN: BHT MARKET SIZE, BY GRADE, 2020–2027 (USD MILLION)
TABLE 54 SPAIN: BHT MARKET SIZE, BY GRADE, 2020–2027 (TON)
TABLE 55 SPAIN: BHT MARKET SIZE, BY END-USE INDUSTRY, 2020–2027 (USD MILLION)
TABLE 56 SPAIN: BHT MARKET SIZE, BY END-USE INDUSTRY, 2020–2027 (TON)
8.3.5 UK
8.3.5.1 Increased demand for convenience food
TABLE 57 UK: BHT MARKET SIZE, BY GRADE, 2020–2027 (USD MILLION)
TABLE 58 UK: BHT MARKET SIZE, BY GRADE, 2020–2027 (TON)
TABLE 59 UK: BHT MARKET SIZE, BY END-USE INDUSTRY, 2020–2027 (USD MILLION)
TABLE 60 UK: BHT MARKET SIZE, BY END-USE INDUSTRY, 2020–2027 (TON)
8.3.6 REST OF EUROPE
TABLE 61 REST OF EUROPE: BHT MARKET SIZE, BY GRADE, 2020–2027 (USD MILLION)
TABLE 62 REST OF EUROPE: BHT MARKET SIZE, BY GRADE, 2020–2027 (TON)
TABLE 63 REST OF EUROPE: BHT MARKET SIZE, BY END-USE INDUSTRY, 2020–2027 (USD MILLION)
TABLE 64 REST OF EUROPE: BHT MARKET SIZE, BY END-USE INDUSTRY, 2020–2027 (TON)
8.4 NORTH AMERICA
TABLE 65 NORTH AMERICA: BHT MARKET SIZE, BY COUNTRY, 2020–2027 (USD MILLION)
TABLE 66 NORTH AMERICA: BHT MARKET SIZE, BY COUNTRY, 2020–2027 (TON)
TABLE 67 NORTH AMERICA: BHT MARKET SIZE, BY GRADE, 2020–2027 (USD MILLION)
TABLE 68 NORTH AMERICA: BHT MARKET SIZE, BY GRADE, 2020–2027 (TON)
TABLE 69 NORTH AMERICA: BHT MARKET SIZE, BY END-USE INDUSTRY, 2020–2027 (USD MILLION)
TABLE 70 NORTH AMERICA: BHT MARKET SIZE, BY END-USE INDUSTRY, 2020–2027 (TON)
8.4.1 US
8.4.1.1 Investments in plastics production driving BHT market
TABLE 71 US: BHT MARKET SIZE, BY GRADE, 2020–2027 (USD MILLION)
TABLE 72 US: BHT MARKET SIZE, BY GRADE, 2020–2027 (TON)
TABLE 73 US: BHT MARKET SIZE, BY END-USE INDUSTRY, 2020–2027 (USD MILLION)
TABLE 74 US: BHT MARKET SIZE, BY END-USE INDUSTRY, 2020–2027 (TON)
8.4.2 CANADA
8.4.2.1 Established chemical industry to create lucrative growth opportunities for market players
TABLE 75 CANADA: BHT MARKET SIZE, BY GRADE, 2020–2027 (USD MILLION)
TABLE 76 CANADA: BHT MARKET SIZE, BY GRADE, 2020–2027 (TON)
TABLE 77 CANADA: BHT MARKET SIZE, BY END-USE INDUSTRY, 2020–2027 (USD MILLION)
TABLE 78 CANADA: BHT MARKET SIZE, BY END-USE INDUSTRY, 2020–2027 (TON)
8.4.3 MEXICO
8.4.3.1 Government initiatives to provide favorable market conditions for BHT manufacturers
TABLE 79 MEXICO: BHT MARKET SIZE, BY GRADE, 2020–2027 (USD MILLION)
TABLE 80 MEXICO: BHT MARKET SIZE, BY GRADE, 2020–2027 (TON)
TABLE 81 MEXICO: BHT MARKET SIZE, BY END-USE INDUSTRY, 2020–2027 (USD MILLION)
TABLE 82 MEXICO: BHT MARKET SIZE, BY END-USE INDUSTRY, 2020–2027 (TON)
8.5 MIDDLE EAST & AFRICA
TABLE 83 MIDDLE EAST & AFRICA: BHT MARKET SIZE, BY COUNTRY, 2020–2027 (USD MILLION)
TABLE 84 MIDDLE EAST & AFRICA: BHT MARKET SIZE, BY COUNTRY, 2020–2027 (TON)
TABLE 85 MIDDLE EAST & AFRICA: BHT MARKET SIZE, BY GRADE, 2020–2027 (USD MILLION)
TABLE 86 MIDDLE EAST & AFRICA: BHT MARKET SIZE, BY GRADE, 2020–2027 (TON)
TABLE 87 MIDDLE EAST & AFRICA: BHT MARKET SIZE, BY END-USE INDUSTRY, 2020–2027 (USD MILLION)
TABLE 88 MIDDLE EAST & AFRICA: BHT MARKET SIZE, BY END-USE INDUSTRY, 2020–2027 (TON)
8.5.1 SAUDI ARABIA
8.5.1.1 Increased investments in chemical and food & beverage industries
TABLE 89 SAUDI ARABIA: BHT MARKET SIZE, BY GRADE, 2020–2027 (USD MILLION)
TABLE 90 SAUDI ARABIA: BHT MARKET SIZE, BY GRADE, 2020–2027 (TON)
TABLE 91 SAUDI ARABIA: BHT MARKET SIZE, BY END-USE INDUSTRY, 2020–2027 (USD MILLION)
TABLE 92 SAUDI ARABIA: BHT MARKET SIZE, BY END-USE INDUSTRY, 2020–2027 (TON)
8.5.2 IRAN
8.5.2.1 Plastics production boosting BHT market
TABLE 93 IRAN: BHT MARKET SIZE, BY GRADE, 2020–2027 (USD MILLION)
TABLE 94 IRAN: BHT MARKET SIZE, BY GRADE, 2020–2027 (TON)
TABLE 95 IRAN: BHT MARKET SIZE, BY END-USE INDUSTRY, 2020–2027 (USD MILLION)
TABLE 96 IRAN: BHT MARKET SIZE, BY END-USE INDUSTRY, 2020–2027 (TON)
8.5.3 REST OF MIDDLE EAST & AFRICA
TABLE 97 REST OF MIDDLE EAST & AFRICA: BHT MARKET SIZE, BY GRADE, 2020–2027 (USD MILLION)
TABLE 98 REST OF MIDDLE EAST & AFRICA: BHT MARKET SIZE, BY GRADE, 2020–2027 (TON)
TABLE 99 REST OF MIDDLE EAST & AFRICA: BHT MARKET SIZE, BY END-USE INDUSTRY, 2020–2027 (USD MILLION)
TABLE 100 REST OF MIDDLE EAST & AFRICA: BHT MARKET SIZE, BY END-USE INDUSTRY, 2020–2027 (TON)
8.6 SOUTH AMERICA
TABLE 101 SOUTH AMERICA: BHT MARKET SIZE, BY COUNTRY, 2020–2027 (USD MILLION)
TABLE 102 SOUTH AMERICA: BHT MARKET SIZE, BY COUNTRY, 2020–2027 (TON)
TABLE 103 SOUTH AMERICA: BHT MARKET SIZE, BY GRADE, 2020–2027 (USD MILLION)
TABLE 104 SOUTH AMERICA: BHT MARKET SIZE, BY GRADE, 2020–2027 (TON)
TABLE 105 SOUTH AMERICA: BHT MARKET SIZE, BY END-USE INDUSTRY, 2020–2027 (USD MILLION)
TABLE 106 SOUTH AMERICA: BHT MARKET SIZE, BY END-USE INDUSTRY, 2020–2027 (TON)
8.6.1 BRAZIL
8.6.1.1 Well-established manufacturing industry to create lucrative growth opportunities
TABLE 107 BRAZIL: BHT MARKET SIZE, BY GRADE, 2020–2027 (USD MILLION)
TABLE 108 BRAZIL: BHT MARKET SIZE, BY GRADE, 2020–2027 (TON)
TABLE 109 BRAZIL: BHT MARKET SIZE, BY END-USE INDUSTRY 2020–2027 (USD MILLION)
TABLE 110 BRAZIL: BHT MARKET SIZE, BY END-USE INDUSTRY, 2020–2027 (TON)
8.6.2 ARGENTINA
8.6.2.1 Government initiatives attracting investments
TABLE 111 ARGENTINA: BHT MARKET SIZE, BY GRADE, 2020–2027 (USD MILLION)
TABLE 112 ARGENTINA: BHT MARKET SIZE, BY GRADE, 2020–2027 (TON)
TABLE 113 ARGENTINA: BHT MARKET SIZE, BY END-USE INDUSTRY, 2020–2027 (USD MILLION)
TABLE 114 ARGENTINA: BHT MARKET SIZE, BY END-USE INDUSTRY, 2020–2027 (TON)
8.6.3 REST OF SOUTH AMERICA
TABLE 115 REST OF SOUTH AMERICA: BHT MARKET SIZE, BY GRADE, 2020–2027 (USD MILLION)
TABLE 116 REST OF SOUTH AMERICA: BHT MARKET SIZE, BY GRADE, 2020–2027 (TON)
TABLE 117 REST OF SOUTH AMERICA: BHT MARKET SIZE, BY END-USE INDUSTRY, 2020–2027 (USD MILLION)
TABLE 118 REST OF SOUTH AMERICA: BHT MARKET SIZE, BY END-USE INDUSTRY, 2020–2027 (TON)
9 COMPETITIVE LANDSCAPE (Page No. - 88)
9.1 OVERVIEW
9.2 MARKET RANKING
FIGURE 22 MARKET RANKING ANALYSIS: SASOL LED BHT MARKET
9.3 MARKET SHARE ANALYSIS
TABLE 119 BHT MARKET: MARKET SHARE OF KEY PLAYERS
FIGURE 23 BHT MARKET: MARKET SHARE ANALYSIS
9.4 REVENUE ANALYSIS OF TOP MARKET PLAYERS
FIGURE 24 REVENUE ANALYSIS FOR KEY COMPANIES IN BHT MARKET
9.5 COMPANY EVALUATION QUADRANT
9.5.1 STAR PLAYERS
9.5.2 EMERGING LEADERS
9.5.3 PERVASIVE PLAYERS
9.5.4 PARTICIPANTS
FIGURE 25 COMPETITIVE LEADERSHIP MAPPING: BHT MARKET, 2021
9.6 SMALL & MEDIUM-SIZED ENTERPRISES (SMES) MATRIX, 2021
9.6.1 PROGRESSIVE COMPANIES
9.6.2 RESPONSIVE COMPANIES
9.6.3 DYNAMIC COMPANIES
9.6.4 STARTING BLOCKS
FIGURE 26 SMES MATRIX: BHT MARKET, 2021
10 COMPANY PROFILES (Page No. - 94)
10.1 MAJOR PLAYERS
(Business Overview, Products Offered, Recent Developments, and MnM View (Key strengths/Right to Win, Strategic Choices Made, and Weaknesses and Competitive Threats))*
10.1.1 SASOL LIMITED
TABLE 120 SASOL LIMITED: BUSINESS OVERVIEW
FIGURE 27 SASOL LIMITED: COMPANY SNAPSHOT
10.1.2 LANXESS
TABLE 121 LANXESS: BUSINESS OVERVIEW
FIGURE 28 LANXESS: COMPANY SNAPSHOT
10.1.3 EASTMAN CHEMICAL COMPANY
TABLE 122 EASTMAN CHEMICAL COMPANY: BUSINESS OVERVIEW
FIGURE 29 EASTMAN CHEMICAL: COMPANY SNAPSHOT
10.1.4 CAMLIN FINE SCIENCE
TABLE 123 CAMLIN FINE SCIENCE: BUSINESS OVERVIEW
FIGURE 30 CAMLIN FINE SCIENCE: COMPANY SNAPSHOT
10.1.5 OXIRIS CHEMICALS S.A.
TABLE 124 OXIRIS CHEMICALS S.A.: BUSINESS OVERVIEW
10.1.6 FINORIC LLC
TABLE 125 FINORIC LLC: BUSINESS OVERVIEW
10.1.7 FINAR LIMITED
TABLE 126 FINAR LIMITED: BUSINESS OVERVIEW
10.1.8 YASHO INDUSTRIES LIMITED
TABLE 127 YASHO INDUSTRIES LIMITED: BUSINESS OVERVIEW
FIGURE 31 YASHO INDUSTRIES LIMITED: COMPANY SNAPSHOT
10.1.9 JAY DINESH CHEMICALS
TABLE 128 JAY DINESH CHEMICALS: BUSINESS OVERVIEW
10.1.10 TWINKLE CHEMI LAB PVT. LTD.
TABLE 129 TWINKLE CHEMI LAB PVT LTD: BUSINESS OVERVIEW
10.2 OTHER PLAYERS
10.2.1 DOUBLE BOND CHEMICAL IND., CO., LTD.
10.2.2 DYCON CHEMICALS
10.2.3 HONSHU CHEMICAL INDUSTRY CO., LTD.
10.2.4 VDH CHEM TECH PVT. LTD.
10.2.5 KH CHEMICALS
10.2.6 OTTO CHEMIE PVT. LTD.
TABLE 130 OTTO CHEMIE PVT. LTD.: COMPANY OVERVIEW
10.2.7 SHIV SHAKTI GROUP
TABLE 131 SHIV SHAKTI GROUP: COMPANY OVERVIEW
10.2.8 WEGO CHEMICAL GROUP
TABLE 132 WEGO CHEMICAL GROUP: COMPANY OVERVIEW
10.2.9 OCTA CHEM
TABLE 133 OCTA CHEM: COMPANY OVERVIEW
10.2.10 SHANGHAI CHEMEX
TABLE 134 SHANGHAI CHEMEX: COMPANY OVERVIEW
10.2.11 UNIVAR SOLUTIONS
TABLE 135 UNIVAR SOLUTIONS: COMPANY OVERVIEW
10.2.12 SILVERLINE CHEMICALS
TABLE 136 SILVERLINE CHEMICALS: COMPANY OVERVIEW
10.2.13 CHEMEX CHEMICALS
TABLE 137 CHEMEX CHEMICALS: COMPANY OVERVIEW
10.2.14 KEMIN INDUSTRIES
TABLE 138 KEMIN INDUSTRIES: COMPANY OVERVIEW
10.2.15 CALDIC B.V.
TABLE 139 CALDIC B.V.: COMPANY OVERVIEW
*Details on Business Overview, Products Offered, Recent Developments, and MnM View (Key strengths/Right to Win, Strategic Choices Made, and Weaknesses and Competitive Threats) might not be captured in case of unlisted companies.
11 APPENDIX (Page No. - 123)
11.1 DISCUSSION GUIDE
11.2 KNOWLEDGESTORE: MARKETSANDMARKETS’ SUBSCRIPTION PORTAL
11.3 CUSTOMIZATION OPTIONS
11.4 RELATED REPORTS
11.5 AUTHOR DETAILS
The study involved four major activities for estimating the current global size of the butylated hydroxytoluene. The exhaustive secondary research was carried out to collect information on the market, the peer market, and the parent market. The next step was to validate these findings, assumptions and sizes with the industry experts across the value chain of Butylated hydroxytoluene through primary research. The supply-side approach was employed to estimate the overall size of the butylated hydroxytoluene. Thereafter, market breakdown and data triangulation procedures were used to estimate the size of different segments and sub-segments of the market.
Secondary Research
In the secondary research process, various secondary sources such as Hoovers, Factiva, Bloomberg BusinessWeek, and Dun & Bradstreet were referred to, so as to identify and collect information for this study on the butylated hydroxytoluene. These secondary sources included annual reports, press releases & investor presentations of companies, white papers, certified publications, articles by recognized authors, regulatory bodies, trade directories, and databases.
Primary Research
Various primary sources from both the supply and demand sides of the Butylated hydroxytoluene were interviewed to obtain qualitative and quantitative information. The primary sources from the supply-side included industry experts, such as Chief Executive Officers (CEOs), vice presidents, marketing directors, sales professionals, and related key executives from various leading companies and organizations operating in the Butylated hydroxytoluene industry. Primary sources from the demand side include experts and key personnel in various end-use industries. The breakdown of the profiles of primary respondents is as follows:
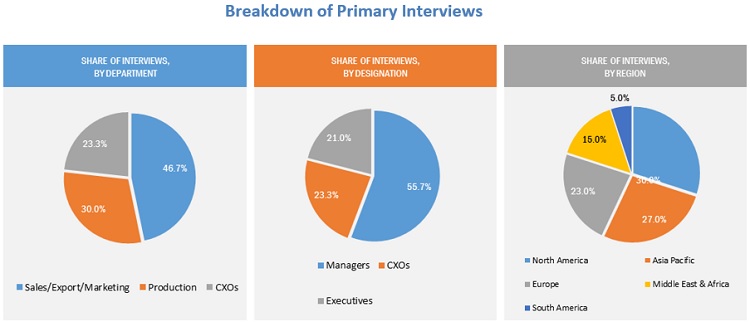
To know about the assumptions considered for the study, download the pdf brochure
Market Size Estimation
The bottom-up and top-down approaches have been used to estimate the Butylated hydroxytoluene market by product type, end use, and region. The research methodology used to calculate the market size includes the following steps:
- The key players of each type in the Butylated hydroxytoluene market have been identified through secondary research, and their revenues have been determined through primary and secondary research.
- The market size of the butylated hydroxytoluene market has been derived from the aggregation of the market shares of the leading players in each product, and the forecast is based on the analysis of market trends, such as pricing and consumption of butylated hydroxytoluene grades used in various end-use industries.
- The market size of the butylated hydroxytoluene by region has been calculated by using the market sizes of each product in each end-use.
- The market size for Butylated hydroxytoluene for each end-use, in terms of value, has been calculated by multiplying the average price of the product with their volumes.
All percentage shares, splits, and breakdowns were determined using secondary sources and verified through primary sources.
Butylated hydroxytoluene Market: Bottom-Up Approach
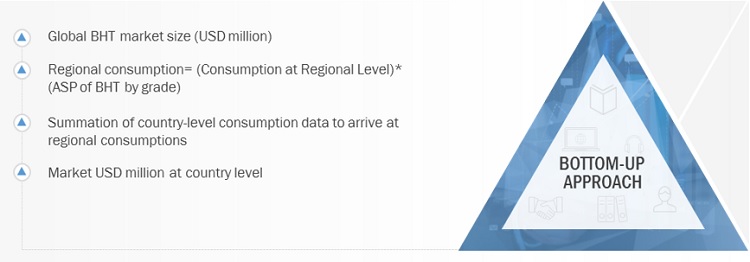
To know about the assumptions considered for the study, Request for Free Sample Report
Butylated hydroxytoluene Market: Top-Down Approach
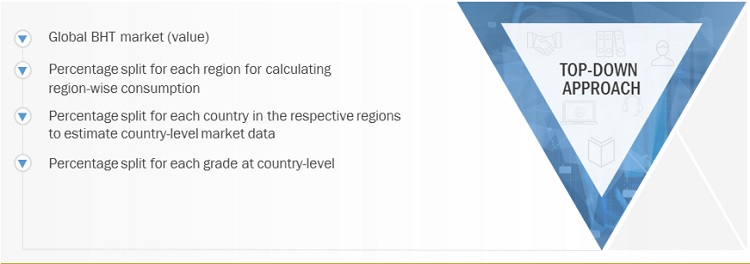
Data Triangulation
After arriving at the overall market size, the overall market has been split into several segments. In order to complete the market engineering process and arrive at the exact statistics for all segments, the data triangulation and market breakdown procedures have been employed, wherever applicable. The data has been triangulated by studying various factors and trends from the demand and supply sides. Along with this, the market has been validated using both the top-down and bottom-up approaches. It has been then verified through primary interviews. Hence, for every data segment, there are three sources — the top- down approach, the bottom-up approach, and interviews with experts. The data is assumed correct only when the values arrived at from these three sources match.
Report Objectives
- To define, analyze, and project the size of the Butylated hydroxytoluene in terms of value and volume based on Type, Product, Process, End-Use Industry and Region
- To project the size of the market and its segments in terms of value and volume, with respect to the five main regions, namely, North America, Europe, Asia Pacific, Middle East & Africa, and South America
- To provide detailed information about the key factors, such as drivers, restraints, opportunities, and challenges influencing the growth of the market
- To strategically analyze the micro markets with respect to individual growth trends, future prospects, and their contribution to the total market
- To analyze the opportunities in the market for stakeholders and provide a detailed competitive landscape of the market leaders
- To strategically profile the key players operating in the market and comprehensively analyze their market shares and core competencies
Available Customizations
With the given market data, MarketsandMarkets offers customizations according to client-specific needs. The following customization options are available for the Butylated hydroxytoluene report:
Product Analysis
- Product matrix, which offers a detailed comparison of the product portfolio of companies
Regional Analysis
- Further analysis of the Butylated hydroxytoluene for additional countries
Company Information
- Detailed analysis and profiling of additional market players (up to five)



 Generating Response ...


Growth opportunities and latent adjacency in Butylated Hydroxytoluene Market
BHT may be a helpful treatment for covid 19. A lot has been written about BHTs use to treat viral diseases including herpes, hepatitis C, AIDS and other viral diseases. The recommended dose is .5 to 1mg per pound of body weight. So a 200 pound person would use 100mg to 200mg of BHT per day to treat and prevent viral diseases. Also BHT has been proven to occur naturally in phytoplankton, lichen, and other plants. This is useful for selling people on the idea of using BHT to treat people. It is as natural as any herbal supplement. No supplement has been more thoroughly examined for food safety than BHT.