Busbar Trunking System Market by End-User (Industrial, Commercial, Large Residential, and Transportation), Power Rating (Lighting, Low, Medium, and High), Conductor (Copper and Aluminum), Insulation (Air and Sandwich), and by Low Voltage Segment - Global Forecast to 2022


[215 Pages] The global busbar trunking system market was valued at USD 5.90 Billion in 2016 and is expected to grow at a CAGR of 6.88%, from 2017 to 2022. Increasing demand for electricity, increased government mandates to save electricity, multiple operational and technical advantages to potential end-users, and space constraints in multi-storey buildings are the major drivers that would trigger the market of busbar trunking system.
The years considered for the study are as follows:
- Base Year- 2016
- Estimated Year- 2017
- Projected Year- 2022
- Forecast Period- 2017 to 2022
The base year considered for company profiles is 2016. Whenever information was unavailable for the base year, the prior year has been considered.
Objectives of the Study
- To define, describe, and forecast the global market by end-users power rating, conductors, insulation, low voltage busbar trunking system, and region
- To provide detailed information regarding major factors influencing the growth of the market (drivers, restraints, opportunities, and industry-specific challenges related to the market)
- To strategically analyze the market with respect to individual growth trends, future prospects, and contribution of each segment to the market
- To analyze opportunities in the market for stakeholders and provide details of a competitive landscape for market leaders
- To forecast the market size of segments with respect to six major regions (along with countries), namely, North America, Europe, Asia-Pacific, South America, the Middle East, and Africa
- To strategically profile key players and comprehensively analyze their market shares and core competencies for the market
- To analyze competitive developments such as contracts & agreements, mergers & acquisitions, new product developments, and expansions in the market
Research Methodology
This research study involved the use of extensive secondary sources, directories, and databases, such as Hoover�s, Bloomberg Businessweek, Factiva, and OneSource, to identify and collect information useful for a technical, market-oriented, and commercial study of the global busbar trunking system market. Primary sources are mainly industry experts from core and related industries, preferred suppliers, manufacturers, distributors, service providers, technology developers, standard and certification organizations of companies, and organizations related to all the segments of this industry�s value chain. The points given below explain the research methodology.
- Study of the annual revenue and market developments of major players providing busbar trunking system and related products
- Analysis of major applications and demand for busbar trunking system from end-users
- Assessment of future trends and growth of busbar trunking system
- Assessment of the market with respect to the demand for each type of busbar trunking system used for different applications
- Analysis of market trends in various regions or countries by studying the application of busbar trunking system in various end-users
- Study of contracts & developments related to busbar trunking system by key players across different regions
- Finalization of overall market sizes by triangulating the supply-side data, which includes product developments and annual revenues of companies providing busbar trunking system across the globe
After arriving at the overall busbar trunking system market size, the total market has been split into several segments and sub-segments. The figure given below illustrates the breakdown of primaries conducted during the research study on the basis of company type, designation, and region.
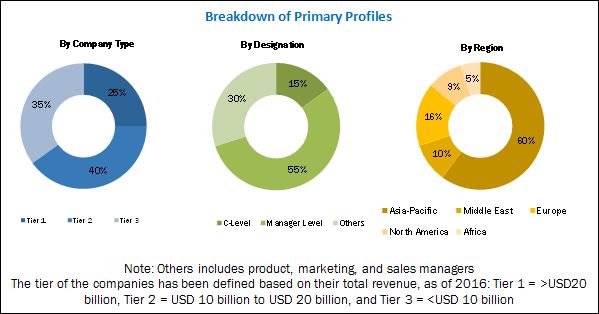
To know about the assumptions considered for the study, download the pdf brochure
Market Ecosystem:
The busbar trunking system market ecosystem comprises power and automation technology companies such as ABB, Ltd. (Switzerland) and Schneider Electric (France) among others; industry and energy companies such as Eaton Corporation, Plc (Ireland) and Larsen & Toubro (India), among others; manufacturing and engineering companies such as Siemens AG (Germany) and General Electric (U.S.), among others; and developers, manufacturers, and marketers of T&D equipment such as C&S Electric Limited (India), Legrand SA (France), and Godrej & Boyce Manufacturing Company Limited (India), among others, who integrate the busbar trunking system and sell them to end-users to cater to their unique requirements.
Target Audience:
The target audience of this report includes:
- Busbar trunking manufacturers, distributors, and suppliers
- Industrial, commercial, and large residential construction companies
- Renewable power generation and equipment manufacturing companies
- Energy management, audit, and green building consulting companies
- Copper and aluminum raw material suppliers
- Government and research organizations
- Environment and industrial associations
- State and national regulatory authorities
- Banks, venture capitalists, financial institutions, and other investors
- Market research and consulting firms
Scope of the Report:
- By Conductor
- Copper
- Aluminum
- By End-User
- Industrial
- Manufacturing
- Process
- Renewable Power Generation
- Commercial
- Large Residential
- Transportation
- Others (Public Infrastructure and IT/ITES)
- By Power Rating
- Lighting Power Range
- Low Power Range
- Medium Power Range
- High Power Range
- By Insulation
- Air Insulated
- Sandwich
- By Region
- North America
- The U.S.
- Canada
- Mexico
- Asia-Pacific
- China
- India
- Japan
- Australia
- South Korea
- Rest of Asia-Pacific
- Europe
- The U.K.
- Russia
- Italy
- Spain
- France
- Germany
- The Rest of Europe
- Middle East
- Saudi Arabia
- The U.A.E.
- Iran
- Qatar
- Iraq
- Rest of the Middle East
- South America
- Argentina
- Venezuela
- Brazil
- Colombia
- Rest of South America
- Africa
- South Africa
- Egypt
- Nigeria
- Algeria
- Rest of Africa
- North America
- Low Voltage Busbar Trunking Market, By End-User
- Industrial
- Commercial
- Large Residential
- Transportation
- Low Voltage Busbar Trunking Market, By Conductor
- Copper
- Aluminum
- Low Voltage Busbar Trunking Market, By Power Rating
- Lighting Power Range
- Low Power Range
- Medium Power Range
- High Power Range
- Low Voltage Busbar Trunking Market, By Insulation
- Air Insulated
- Sandwich
- Oilfield Communications Market, By Region
- North America
- Europe
- Asia-Pacific
- Middle East & Africa
- South America
Available Customizations:
With the given market data, MarketsandMarkets offers customizations as per the client�s specific needs. The following customization options are available for this report:
Regional Analysis
Further breakdown of region or country-specific analysis
Company Information
Detailed analysis and profiling of additional market players (up to five)
The global busbar trunking system market is projected to grow at a CAGR of 6.88%, from 2017 to 2022, to reach a market size of USD 8.85 Billion by 2022. This growth is attributed to increased adoption of energy efficiency practices, various operational and technical advantages to the potential end-users, and growing demand for power.
The report also covers the low voltage busbar trunking system market which is further segmented into end-users, power rating, conductor, and region. The report segments the low voltage market, based on conductor type, into copper and aluminum conductors. The copper conductor would account for the maximum share in the low voltage market. The energy efficient and compact nature of copper busbar trunking system makes it more suitable for applications such as high-rise buildings, shopping complexes, IT parks, manufacturing, and process industries. The Aluminum conductor is cost effective as compared to copper low voltage busbar trunking system, which makes it suitable for small and medium enterprises.
The report segments the market of busbar trunking system market, on the basis of end-users, into industrial, commercial, large residential, transportation, and others (public infrastructure and IT/ITES). There are several key areas in the industrial sector where busbar trunking system is installed. For instance, they are used to deliver consistent power supply to the production floor. It is used by manufacturers of motor drives, fork lift trucks, welding machines, power generators, and industrial testing machines among others.
The global busbar trunking system market has been segmented, based on insulation, into air insulated and sandwich. The sandwich busbar trunking sub-segment, within the insulation segment, led the market of busbar trunking system in 2016, and is projected to dominate the market during the forecast period. The segment is expected to grow at the fastest rate during the forecast period.
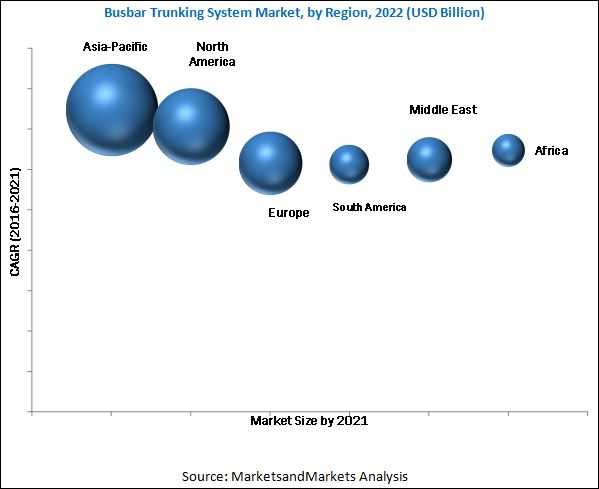
In this report, the global market has been analysed with respect to six regions, namely, North America, Europe, Asia-Pacific, South America, the Middle East, and Africa. Asia-Pacific is expected to dominate the global market, during the forecast period, owing to the extensive use of busbar trunking system in the T&D sector all across the globe.
Instability in raw material prices could be a restraint for the market of busbar trunking system, leading to declining profits.
The leading players in the busbar trunking system market include ABB, Ltd. (Switzerland), Siemens AG (Germany), Schneider Electric (France), General Electric (U.S.), and Eaton Corporation, Plc (Ireland). Contracts & agreements was the strategy most commonly adopted by top players, constituting 60.9% of the total developments, from 2013 to 2017. It was followed by new product developments, expansions, and mergers & acquisitions.
To speak to our analyst for a discussion on the above findings, click Speak to Analyst
 Exclusive indicates content/data unique to MarketsandMarkets and not available with any competitors.
TABLE OF CONTENTS
1 INTRODUCTION (Page No. - 19)
1.1 OBJECTIVES OF THE STUDY
1.2 MARKET DEFINITION
1.3 MARKET SCOPE
1.3.1 BUSBAR TRUNKING MARKET: MARKET SEGMENTATION
1.3.2 REGIONAL SCOPE
1.3.3 YEARS CONSIDERED FOR THE STUDY
1.4 CURRENCY
1.5 LIMITATIONS
1.6 STAKEHOLDERS
2 RESEARCH METHODOLOGY (Page No. - 23)
2.1 RESEARCH DATA
2.1.1 SECONDARY DATA
2.1.1.1 Key data from secondary sources
2.1.2 PRIMARY DATA
2.1.2.1 Key data from primary sources
2.1.2.2 Key industry insights
2.1.2.3 Breakdown of primaries
2.2 MARKET SIZE ESTIMATION
2.2.1 BOTTOM-UP APPROACH
2.2.2 TOP-DOWN APPROACH
2.3 MARKET BREAKDOWN & DATA TRIANGULATION
2.4 RESEARCH ASSUMPTIONS
3 EXECUTIVE SUMMARY (Page No. - 31)
4 PREMIUM INSIGHTS (Page No. - 36)
4.1 BUSBAR TRUNKING SYSTEM MARKET, BY REGION
4.2 BUSBAR TRUNKING SYSTEM MARKET, BY END USER
4.3 BUSBAR TRUNKING SYSTEM MARKET, BY CONDUCTOR
4.4 ASIA-PACIFIC BUSBAR TRUNKING SYSTEM MARKET
5 MARKET OVERVIEW (Page No. - 39)
5.1 INTRODUCTION
5.2 ADVANTAGES OF THE BUSBAR TRUNKING SYSTEMS OVER CABLE TRAY SYSTEMS
5.3 MARKET DYNAMICS
5.3.1 DRIVERS
5.3.1.1 Increase in electricity consumption
5.3.1.2 Space constraints in multi-storied buildings
5.3.1.3 Multiple operational and technical advantages to attract users
5.3.1.4 Increased adoption of energy efficiency practices and government mandates to save electricity
5.3.2 RESTRAINTS
5.3.2.1 Instability of raw material prices
5.3.2.2 Busbar trunking systems are not economical for SMEs
5.3.3 OPPORTUNITIES
5.3.3.1 Development of smart cities & green constructions
5.3.3.2 Increased sustainability and investment in renewable energy
5.3.4 CHALLENGES
5.3.4.1 Increasing cost of capital expenditure
5.4 SUPPLY CHAIN ANALYSIS
6 BUSBAR TRUNKING SYSTEM MARKET, BY END USER (Page No. - 48)
6.1 INTRODUCTION
6.2 INDUSTRIAL
6.2.1 MANUFACTURING INDUSTRY
6.2.2 PROCESS INDUSTRY
6.2.3 RENEWABLE POWER GENERATION
6.3 COMMERCIAL
6.4 LARGE RESIDENTIAL
6.5 TRANSPORTATION
6.6 OTHERS
7 BUSBAR TRUNKING SYSTEM MARKET, BY CONDUCTOR (Page No. - 60)
7.1 INTRODUCTION
7.2 COPPER
7.3 ALUMINUM
8 BUSBAR TRUNKING SYSTEM MARKET, BY POWER RATING (Page No. - 64)
8.1 INTRODUCTION
8.2 LIGHTING POWER RANGE
8.3 LOW POWER RANGE
8.4 MEDIUM POWER RANGE
8.5 HIGH POWER RANGE
9 BUSBAR TRUNKING SYSTEM MARKET, BY INSULATION (Page No. - 70)
9.1 INTRODUCTION
9.2 AIR INSULATED
9.3 SANDWICH INSULATION
10 BUSBAR TRUNKING SYSTEM, BY REGION (Page No. - 74)
10.1 INTRODUCTION
10.2 ASIA-PACIFIC
10.2.1 CHINA
10.2.2 JAPAN
10.2.3 INDIA
10.2.4 SOUTH KOREA
10.2.5 AUSTRALIA
10.2.6 REST OF ASIA-PACIFIC
10.3 NORTH AMERICA
10.3.1 U.S.
10.3.2 CANADA
10.3.3 MEXICO
10.4 SOUTH AMERICA
10.4.1 BRAZIL
10.4.2 ARGENTINA
10.4.3 COLOMBIA
10.4.4 VENEZUELA
10.4.5 REST OF SOUTH AMERICA
10.5 EUROPE
10.5.1 GERMANY
10.5.2 U.K.
10.5.3 ITALY
10.5.4 RUSSIA
10.5.5 SPAIN
10.5.6 FRANCE
10.5.7 REST OF EUROPE
10.6 MIDDLE EAST
10.6.1 SAUDI ARABIA
10.6.2 U.A.E.
10.6.3 QATAR
10.6.4 IRAN
10.6.5 IRAQ
10.6.6 REST OF THE MIDDLE EAST
10.7 AFRICA
10.7.1 SOUTH AFRICA
10.7.2 NIGERIA
10.7.3 ALGERIA
10.7.4 EGYPT
10.7.5 REST OF AFRICA
11 LOW VOLTAGE BUSBAR TRUNKING SYSTEM MARKET (Page No. - 116)
11.1 INTRODUCTION
11.2 LOW VOLTAGE BUSBAR TRUNKING SYSTEM MARKET, BY END USER
11.2.1 INDUSTRIAL
11.2.2 COMMERCIAL
11.2.3 LARGE RESIDENTIAL
11.2.4 TRANSPORTATION
11.3 LOW VOLTAGE BUSBAR TRUNKING SYSTEM MARKET, BY CONDUCTOR
11.3.1 COPPER
11.3.2 ALUMINUM
11.4 LOW VOLTAGE BUSBAR TRUNKING SYSTEM MARKET, BY POWER RATING
11.4.1 LIGHTING POWER RANGE
11.4.2 LOW POWER RANGE
11.4.3 MEDIUM POWER RANGE
11.4.4 HIGH POWER RANGE
11.5 REGIONAL ANALYSIS
11.5.1 INTRODUCTION
11.6 NORTH AMERICA
11.7 EUROPE
11.8 ASIA-PACIFIC
11.9 THE MIDDLE EAST
11.1 SOUTH AMERICA
11.11 AFRICA
12 COMPETITIVE LANDSCAPE (Page No. - 130)
12.1 OVERVIEW
12.2 MARKET RANKING, BUSBAR TRUNKING SYSTEM MARKET, 2016
12.3 COMPETITIVE SITUATION & TRENDS
12.4 VENDOR DIVE MATRIX
13 COMPANY PROFILES (Page No. - 136)
(Business Overview, Scorecard, Products Offered, Developments, and MnM View)*
13.1 INTRODUCTION
13.2 ABB LTD.
13.3 EATON CORPORATION, PLC.
13.4 GE
13.5 SCHNEIDER ELECTRIC SE
13.6 SIEMENS
13.7 LARSEN & TOUBRO
13.8 C&S ELECTRIC LIMITED
13.9 LEGRAND SA
13.10 GODREJ & BOYCE MANUFACTURING COMPANY LIMITED
13.11 IBAR (EMEA) LTD.
13.12 KGS ENGINEERING LTD.
13.13 MEGABARRE GROUP
13.14 NAXSO S.R.L
13.15 DBTS INDUSTRIES SDN. BHD.
13.16 E.A.E ELEKTRIK A.S.
13.17 ENTRACO POWER
13.18 GERSAN ELEKTRIK AS
13.19 GRAZIADIO & C. S.P.A.
13.20 NOVA LTD.
13.21 POGLIANO S.R.L
13.22 POWER PLUG BUSDUCT SDN. BHD.
13.23 POWERBAR SYSTEM
13.24 RITTAL GMBH & CO.
13.25 SMITHS POWER (POWER DISTRIBUTION, INC.)
13.26 VASS ELECTRICAL INDUSTRIES
13.27 VMTEC
13.28 ARJ GROUP
13.29 BUSBAR SERVICES
*Details on Business Overview, Scorecard, Products Offered, Developments, and MnM View might not be captured in case of unlisted companies.
14 APPENDIX (Page No. - 207)
14.1 INSIGHTS OF INDUSTRY EXPERTS
14.2 DISCUSSION GUIDE
14.3 KNOWLEDGE STORE: MARKETSANDMARKETS� SUBSCRIPTION PORTAL
14.4 INTRODUCING RT: REAL-TIME MARKET INTELLIGENCE
14.5 AVAILABLE CUSTOMIZATIONS
14.6 RELATED REPORTS
14.7 AUTHOR DETAILS
LIST OF TABLES (116 Tables)
TABLE 1 GLOBAL BUSBAR TRUNKING SYSTEM SNAPSHOT
TABLE 2 ADVANTAGES OF BUSBAR TRUNKING SYSTEMS OVER CABLE TRAY SYSTEMS
TABLE 3 INCREASED MARKET PENETRATION DUE TO ADVANTAGES AND ENERGY EFFICIENCY MANDATES
TABLE 4 BUSBAR TRUNKING SYSTEM ARE NOT ECONOMICAL FOR LOW BUDGET PROJECTS, RESTRAINING GROWTH OF THE MARKET
TABLE 5 UPCOMING SMART CITIES AND GREEN CONSTRUCTIONS IS AN OPPORTUNITY FOR THE BUSBAR TRUNKING SYSTEM MARKET
TABLE 6 UPCOMING SMART CITIES AND GREEN CONSTRUCTIONS IS AN OPPORTUNITY FOR THE BUSBAR TRUNKING SYSTEM MARKET
TABLE 7 BUSBAR TRUNKING SYSTEM MARKET SIZE, BY END USER, 2015�2022 (USD MILLION)
TABLE 8 INDUSTRIAL: BUSBAR TRUNKING SYSTEM MARKET SIZE, BY REGION, 2015�2022 (USD MILLION)
TABLE 9 INDUSTRIAL: BUSBAR TRUNKING SYSTEM MARKET SIZE, BY POWER RATING, 2015�2022 (USD MILLION)
TABLE 10 INDUSTRIAL: BUSBAR TRUNKING SYSTEM MARKET SIZE, BY TYPE, 2015�2022 (USD MILLION)
TABLE 11 MANUFACTURING INDUSTRY: BUSBAR TRUNKING SYSTEM MARKET SIZE, BY REGION, 2015�2022 (USD MILLION)
TABLE 12 PROCESS INDUSTRY: BUSBAR TRUNKING SYSTEM MARKET SIZE, BY REGION, 2015�2022 (USD MILLION)
TABLE 13 RENEWABLE POWER GENERATION INDUSTRY: BUSBAR TRUNKING SYSTEM MARKET SIZE, BY REGION, 2015�2022 (USD MILLION)
TABLE 14 COMMERCIAL: BUSBAR TRUNKING SYSTEM MARKET SIZE, BY REGION,2015�2022 (USD MILLION)
TABLE 15 COMMERCIAL: BUSBAR TRUNKING SYSTEM MARKET SIZE, BY POWER RATING, 2015�2022 (USD MILLION)
TABLE 16 LARGE RESIDENTIAL: BUSBAR TRUNKING SYSTEM MARKET SIZE, BY REGION, 2015�2022 (USD MILLION)
TABLE 17 LARGE RESIDENTIAL: BUSBAR TRUNKING SYSTEM MARKET SIZE, BY POWER RATING, 2015�2022 (USD MILLION)
TABLE 18 TRANSPORTATION: BUSBAR TRUNKING SYSTEM MARKET SIZE, BY REGION, 2015�2022 (USD MILLION)
TABLE 19 TRANSPORTATION: BUSBAR TRUNKING SYSTEM MARKET SIZE, BY POWER RATING, 2015�2022 (USD MILLION)
TABLE 20 OTHERS: BUSBAR TRUNKING SYSTEM MARKET SIZE, BY REGION, 2015�2022 (USD MILLION)
TABLE 21 OTHERS: BUSBAR TRUNKING SYSTEM MARKET SIZE, BY POWER RATING, 2015�2022 (USD MILLION)
TABLE 22 BUSBAR TRUNKING SYSTEM MARKET SIZE, BY CONDUCTOR, 2015�2022 (USD MILLION)
TABLE 23 COPPER BUSBAR TRUNKING SYSTEM MARKET SIZE, BY REGION, 2015�2022 (USD MILLION)
TABLE 24 ALUMINUM BUSBAR TRUNKING SYSTEM MARKET SIZE, BY REGION, 2015�2022 (USD MILLION)
TABLE 25 BUSBAR TRUNKING SYSTEM MARKET SIZE, BY POWER RATING, 2015�2022 (USD MILLION)
TABLE 26 LIGHTING POWER RANGE: BUSBAR TRUNKING SYSTEM MARKET SIZE, BY END USER, 2015�2022 (USD MILLION)
TABLE 27 LOW POWER RANGE: BUSBAR TRUNKING SYSTEM MARKET SIZE, BY END USER, 2015�2022 (USD MILLION)
TABLE 28 MEDIUM POWER RANGE: BUSBAR TRUNKING SYSTEM MARKET SIZE, BY END USER, 2015�2022 (USD MILLION)
TABLE 29 HIGH POWER RANGE: BUSBAR TRUNKING SYSTEM MARKET SIZE, BY END USER, 2015�2022 (USD MILLION)
TABLE 30 BUSBAR TRUNKING SYSTEM MARKET SIZE, BY INSULATION, 2015�2022 (USD MILLION)
TABLE 31 AIR INSULATED BUSBAR TRUNKING SYSTEM MARKET SIZE, BY REGION, 2015�2022 (USD MILLION)
TABLE 32 SANDWICH BUSBAR TRUNKING SYSTEM MARKET SIZE, BY REGION, 2015�2022 (USD MILLION)
TABLE 33 BUSBAR TRUNKING SYSTEM MARKET SIZE, BY REGION, 2015�2022 (USD MILLION)
TABLE 34 ASIA-PACIFIC: BUSBAR TRUNKING SYSTEM MARKET SIZE, BY COUNTRY, 2015�2022 (USD MILLION)
TABLE 35 ASIA-PACIFIC: BUSBAR TRUNKING SYSTEM MARKET SIZE, BY CONDUCTOR, 2015�2022 (USD MILLION)
TABLE 36 ASIA-PACIFIC: BUSBAR TRUNKING SYSTEM MARKET SIZE, BY INSULATION TYPE, 2015�2022 (USD MILLION)
TABLE 37 ASIA-PACIFIC: BUSBAR TRUNKING SYSTEM MARKET SIZE, BY END USER, 2015�2022 (USD MILLION)
TABLE 38 ASIA-PACIFIC: INDUSTRIAL BUSBAR TRUNKING SYSTEM MARKET SIZE, BY TYPE, 2015�2022 (USD MILLION)
TABLE 39 CHINA: BUSBAR TRUNKING SYSTEM MARKET SIZE, BY END USER, 2015�2022 (USD MILLION)
TABLE 40 JAPAN: BUSBAR TRUNKING SYSTEM MARKET SIZE, BY END USER, 2015�2022 (USD MILLION)
TABLE 41 INDIA: BUSBAR TRUNKING SYSTEM MARKET SIZE, BY END USER, 2015�2022 (USD MILLION)
TABLE 42 SOUTH KOREA: BUSBAR TRUNKING SYSTEM MARKET SIZE, BY END USER, 2015�2022 (USD MILLION)
TABLE 43 AUSTRALIA: BUSBAR TRUNKING SYSTEM MARKET SIZE, BY END USER, 2015�2022 (USD MILLION)
TABLE 44 REST OF ASIA-PACIFIC: BUSBAR TRUNKING SYSTEM MARKET SIZE, BY END USER, 2015�2022 (USD MILLION)
TABLE 45 NORTH AMERICA: BUSBAR TRUNKING SYSTEM MARKET SIZE, BY COUNTRY, 2015�2022 (USD MILLION)
TABLE 46 NORTH AMERICA: BUSBAR TRUNKING SYSTEM MARKET SIZE, BY CONDUCTOR, 2017�2022 (USD MILLION)
TABLE 47 NORTH AMERICA: BUSBAR TRUNKING SYSTEM MARKET SIZE, BY INSULATION TYPE, 2015�2022 (USD MILLION)
TABLE 48 NORTH AMERICA: BUSBAR TRUNKING SYSTEM MARKET SIZE, BY END USER, 2015�2022 (USD MILLION)
TABLE 49 NORTH AMERICA: INDUSTRIAL BUSBAR TRUNKING SYSTEM MARKET SIZE, BY TYPE, 2015�2022 (USD MILLION)
TABLE 50 U.S.: BUSBAR TRUNKING SYSTEM MARKET SIZE, BY END USER, 2015�2022 (USD MILLION)
TABLE 51 CANADA: BUSBAR TRUNKING SYSTEM MARKET SIZE, BY END USER, 2015�2022 (USD MILLION)
TABLE 52 MEXICO: BUSBAR TRUNKING SYSTEM MARKET SIZE, BY END USER, 2015�2022 (USD MILLION)
TABLE 53 SOUTH AMERICA: BUSBAR TRUNKING SYSTEM MARKET SIZE, BY COUNTRY, 2015�2022 (USD MILLION)
TABLE 54 SOUTH AMERICA: BUSBAR TRUNKING SYSTEM MARKET SIZE, BY CONDUCTOR, 2015�2022 (USD MILLION)
TABLE 55 SOUTH AMERICA: BUSBAR TRUNKING SYSTEM MARKET SIZE, BY INSULATION TYPE, 2015�2022 (USD MILLION)
TABLE 56 SOUTH AMERICA: BUSBAR TRUNKING SYSTEM MARKET SIZE, BY END USER, 2015�2022 (USD MILLION)
TABLE 57 SOUTH AMERICA: INDUSTRIAL BUSBAR TRUNKING SYSTEM MARKET SIZE, BY TYPE, 2015�2022 (USD MILLION)
TABLE 58 BRAZIL: BUSBAR TRUNKING SYSTEM MARKET SIZE, BY END USER,2015�2022 (USD MILLION)
TABLE 59 ARGENTINA: BUSBAR TRUNKING SYSTEM MARKET SIZE, BY END USER, 2015�2022 (USD MILLION)
TABLE 60 COLOMBIA: BUSBAR TRUNKING SYSTEM MARKET SIZE, BY END USER, 2015�2022 (USD MILLION)
TABLE 61 VENEZUELA: BUSBAR TRUNKING SYSTEM MARKET SIZE, BY END USER, 2015�2022 (USD MILLION)
TABLE 62 REST OF SOUTH AMERICA: BUSBAR TRUNKING SYSTEM MARKET SIZE, BY END USER, 2015�2022 (USD MILLION)
TABLE 63 EUROPE: BUSBAR TRUNKING SYSTEM MARKET SIZE, BY COUNTRY, 2015�2022 (USD MILLION)
TABLE 64 EUROPE: BUSBAR TRUNKING SYSTEM MARKET SIZE, BY CONDUCTOR,2015�2022 (USD MILLION)
TABLE 65 EUROPE: BUSBAR TRUNKING SYSTEM MARKET SIZE, BY INSULATION TYPE, 2015�2022 (USD MILLION)
TABLE 66 EUROPE: BUSBAR TRUNKING SYSTEM MARKET SIZE, BY END USER, 2015�2022 (USD MILLION)
TABLE 67 EUROPE: INDUSTRIAL BUSBAR TRUNKING SYSTEM MARKET SIZE, BY TYPE, 2015�2022 (USD MILLION)
TABLE 68 GERMANY: BUSBAR TRUNKING SYSTEM MARKET SIZE, BY END USER, 2015�2022 (USD MILLION)
TABLE 69 U.K.: BUSBAR TRUNKING SYSTEM MARKET SIZE, BY END USER, 2015�2022 (USD MILLION)
TABLE 70 ITALY: BUSBAR TRUNKING SYSTEM MARKET SIZE, BY END USER, 2015�2022 (USD MILLION)
TABLE 71 RUSSIA: BUSBAR TRUNKING SYSTEM MARKET SIZE, BY END USER, 2015�2022 (USD MILLION)
TABLE 72 SPAIN: BUSBAR TRUNKING SYSTEM MARKET SIZE, BY END USER, 2015�2022 (USD MILLION)
TABLE 73 FRANCE: BUSBAR TRUNKING SYSTEM MARKET SIZE, BY END USER, 2015�2022 (USD MILLION)
TABLE 74 REST OF EUROPE: BUSBAR TRUNKING SYSTEM MARKET SIZE, BY END USER, 2015�2022 (USD MILLION)
TABLE 75 MIDDLE EAST: BUSBAR TRUNKING SYSTEM MARKET SIZE, BY COUNTRY, 2015�2022 (USD MILLION)
TABLE 76 MIDDLE EAST: BUSBAR TRUNKING SYSTEM MARKET SIZE, BY CONDUCTOR, 2015�2022 (USD MILLION)
TABLE 77 MIDDLE EAST: BUSBAR TRUNKING SYSTEM MARKET SIZE, BY INSULATION TYPE, 2015�2022 (USD MILLION)
TABLE 78 MIDDLE EAST: BUSBAR TRUNKING SYSTEM MARKET SIZE, BY END USER, 2015�2022 (USD MILLION)
TABLE 79 MIDDLE EAST: INDUSTRIAL BUSBAR TRUNKING SYSTEM MARKET SIZE, BY TYPE, 2015�2022 (USD MILLION)
TABLE 80 SAUDI ARABIA: BUSBAR TRUNKING SYSTEM MARKET SIZE, BY END USER, 2015�2022 (USD MILLION)
TABLE 81 U.A.E.: BUSBAR TRUNKING SYSTEM MARKET SIZE, BY END USER, 2015�2022 (USD MILLION)
TABLE 82 QATAR: BUSBAR TRUNKING SYSTEM MARKET SIZE, BY END USER, 2015�2022 (USD MILLION)
TABLE 83 IRAN: BUSBAR TRUNKING SYSTEM MARKET SIZE, BY END USER, 2015�2022 (USD MILLION)
TABLE 84 IRAQ: BUSBAR TRUNKING SYSTEM MARKET SIZE, BY END USER, 2015�2022 (USD MILLION)
TABLE 85 REST OF THE MIDDLE EAST: BUSBAR TRUNKING SYSTEM MARKET SIZE, BY END USER, 2015�2022 (USD MILLION)
TABLE 86 AFRICA: BUSBAR TRUNKING SYSTEM MARKET SIZE, BY COUNTRY, 2015�2022 (USD MILLION)
TABLE 87 AFRICA: BUSBAR TRUNKING SYSTEM MARKET SIZE, BY CONDUCTOR, 2015�2022 (USD MILLION)
TABLE 88 AFRICA: BUSBAR TRUNKING SYSTEM MARKET SIZE, BY INSULATION TYPE, 2015�2022 (USD MILLION)
TABLE 89 AFRICA: BUSBAR TRUNKING SYSTEM MARKET SIZE, BY END USER, 2015�2022 (USD MILLION)
TABLE 90 AFRICA: INDUSTRIAL BUSBAR TRUNKING SYSTEM MARKET SIZE, BY TYPE, 2015�2022 (USD MILLION)
TABLE 91 SOUTH AFRICA: BUSBAR TRUNKING SYSTEM MARKET SIZE, BY END USER,2015�2022 (USD MILLION)
TABLE 92 NIGERIA: BUSBAR TRUNKING SYSTEM MARKET SIZE, BY END USER,2015�2022 (USD MILLION)
TABLE 93 ALGERIA: BUSBAR TRUNKING SYSTEM MARKET SIZE, BY END USER, 2015�2022 (USD MILLION)
TABLE 94 EGYPT: BUSBAR TRUNKING SYSTEM MARKET SIZE, BY END USER, 2015�2022 (USD MILLION)
TABLE 95 REST OF AFRICA: BUSBAR TRUNKING SYSTEM MARKET SIZE, BY END USER, 2015�2022 (USD MILLION)
TABLE 96 LOW VOLTAGE BUSBAR TRUNKING SYSTEM MARKET, BY END USER,2015�2022 (USD MILLION)
TABLE 97 INDUSTRIAL: LOW VOLTAGE BUSBAR TRUNKING SYSTEM MARKET, BY REGION, 2015�2022 (USD MILLION)
TABLE 98 COMMERCIAL: LOW VOLTAGE BUSBAR TRUNKING SYSTEM MARKET, BY REGION, 2015�2022 (USD MILLION)
TABLE 99 LARGE RESIDENTIAL: LOW VOLTAGE BUSBAR TRUNKING SYSTEM MARKET, BY REGION, 2015�2022 (USD MILLION)
TABLE 100 TRANSPORTATION: LOW VOLTAGE BUSBAR TRUNKING SYSTEM MARKET, BY REGION, 2015�2022 (USD MILLION)
TABLE 101 LOW VOLTAGE BUSBAR TRUNKING SYSTEM MARKET, BY CONDUCTOR, 2015�2022 (USD MILLION)
TABLE 102 COPPER: LOW VOLTAGE BUSBAR TRUNKING SYSTEM MARKET, BY REGION, 2015�2022 (USD MILLION)
TABLE 103 ALUMINUM: LOW VOLTAGE BUSBAR TRUNKING SYSTEM MARKET, BY REGION, 2015�2022 (USD MILLION)
TABLE 104 LOW VOLTAGE BUSBAR TRUNKING SYSTEM MARKET, BY POWER RATING, 2015�2022 (USD MILLION)
TABLE 105 LIGHTING POWER RANGE: LOW VOLTAGE BUSBAR TRUNKING SYSTEM MARKET, BY REGION, 2015�2022 (USD MILLION)
TABLE 106 LOW POWER RANGE: LOW VOLTAGE BUSBAR TRUNKING SYSTEM MARKET, BY REGION, 2015�2022 (USD MILLION)
TABLE 107 MEDIUM POWER RANGE: LOW VOLTAGE BUSBAR TRUNKING SYSTEM MARKET, BY REGION, 2015�2022 (USD MILLION)
TABLE 108 HIGH POWER RANGE: LOW VOLTAGE BUSBAR TRUNKING SYSTEM MARKET, BY REGION, 2015�2022 (USD MILLION)
TABLE 109 LOW VOLTAGE BUSBAR TRUNKING SYSTEM MARKET SIZE, BY REGION, 2015�2022 (USD MILLION)
TABLE 110 NORTH AMERICA: LOW VOLTAGE BUSBAR TRUNKING SYSTEM MARKET SIZE, BY COUNTRY, 2015�2022 (USD MILLION)
TABLE 111 EUROPE: LOW VOLTAGE BUSBAR TRUNKING SYSTEM MARKET SIZE, BY COUNTRY, 2015�2022 (USD MILLION)
TABLE 112 ASIA-PACIFIC: LOW VOLTAGE BUSBAR TRUNKING SYSTEM MARKET SIZE, BY COUNTRY, 2015�2022 (USD MILLION)
TABLE 113 THE MIDDLE EAST: LOW VOLTAGE BUSBAR TRUNKING SYSTEM MARKET SIZE, BY COUNTRY, 2015�2022 (USD MILLION)
TABLE 114 SOUTH AMERICA: LOW VOLTAGE BUSBAR TRUNKING SYSTEM MARKET SIZE, BY COUNTRY, 2015�2022 (USD MILLION)
TABLE 115 AFRICA: LOW VOLTAGE BUSBAR TRUNKING SYSTEM MARKET SIZE, BY COUNTRY, 2015�2022 (USD MILLION)
TABLE 116 MARKET RANKING, BUSBAR TRUNKING SYSTEM MARKET, 2016
LIST OF FIGURES (103 Figures)
FIGURE 1 BUSBAR TRUNKING MARKET: RESEARCH DESIGN
FIGURE 2 BOTTOM-UP APPROACH
FIGURE 3 TOP-DOWN APPROACH
FIGURE 4 DATA TRIANGULATION METHODOLOGY
FIGURE 5 ASSUMPTIONS OF THE RESEARCH STUDY
FIGURE 6 THE MARKET IN ASIA-PACIFIC ACCOUNTED FOR THE LARGEST SHARE OF THE BUSBAR TRUNKING SYSTEM MARKET IN 2016
FIGURE 7 THE MEDIUM POWER RANGE SEGMENT IS EXPECTED TO DOMINATE THE BUSBAR TRUNKING SYSTEM MARKET DURING THE FORECAST PERIOD
FIGURE 8 SANDWICH SEGMENT IS EXPECTED TO GROW AT THE HIGHEST CAGR BETWEEN 2017 AND 2022
FIGURE 9 THE COPPER SEGMENT IS EXPECTED TO WITNESS MAXIMUM DEMAND DURING THE FORECAST PERIOD
FIGURE 10 ATTRACTIVE OPPORTUNITIES IN THE BUSBAR TRUNKING SYSTEM MARKET, 2017�2022
FIGURE 11 THE MARKET IN ASIA-PACIFIC IS EXPECTED TO GROW AT THE HIGHEST CAGR FROM 2017 TO 2022
FIGURE 12 THE COPPER SEGMENT IS EXPECTED TO GROW AT THE FASTEST RATE DURING THE FORECAST PERIOD
FIGURE 13 THE INDUSTRIAL SEGMENT IS EXPECTED TO DOMINATE THE BUSBAR TRUNKING SYSTEM MARKET, BY CONDUCTOR, 2017
FIGURE 14 THE MARKET IN CHINA ACCOUNTED FOR THE LARGEST SHARE OF THE ASIA-PACIFIC BUSBAR TRUNKING SYSTEM MARKET IN 2016
FIGURE 15 MARKET DYNAMICS OF THE BUSBAR TRUNKING SYSTEM MARKET
FIGURE 16 GLOBAL METAL PRICES PER METRIC TONNE, 2013�2017
FIGURE 17 WORLD NET ELECTRICITY GENERATION FROM RENEWABLE POWER SOURCES, 2012�2040
FIGURE 18 TOTAL GLOBAL INVESTMENT IN WIND ENERGY (USD BILLION) 2006�2015 INCREASE: USD 784 BILLION OR 454%
FIGURE 19 SUPPLY CHAIN ANALYSIS: BUSBAR TRUNKING SYSTEM
FIGURE 20 INDUSTRIAL SECTOR IS THE FASTEST GROWING END USER MARKET SEGMENT
FIGURE 21 ASIA-PACIFIC: THE FASTEST GROWING BUSBAR TRUNKING MARKET IN THE INDUSTRIAL SEGMENT, 2017�2022
FIGURE 22 LARGE RESIDENTIAL SEGMENT, BY REGION, 2017�2022 (USD MILLION)
FIGURE 23 ASIA-PACIFIC: THE FASTEST GROWING BUSBAR TRUNKING MARKET IN THE TRANSPORTATION SEGMENT, 2017�2022
FIGURE 24 BUSBAR TRUNKING MARKET SIZE, BY CONDUCTOR, 2017�2022
FIGURE 25 MEDIUM POWER RANGE IS THE LARGEST MARKET SEGMENT IN THE BUSBAR TRUNKING SYSTEM MARKET, 2017�2022
FIGURE 26 SANDWICH INSULATION IS PREFERRED TO AIR INSULATION
FIGURE 27 REGIONAL SNAPSHOT: ASIA-PACIFIC IS THE FASTEST GROWING MARKET FOR BUSBAR TRUNKING (2017-2022)
FIGURE 28 BUSBAR TRUNKING SYSTEM MARKET SIZE, BY REGION,2017�2022 (USD MILLION)
FIGURE 29 ASIA-PACIFIC: REGIONAL SNAPSHOT
FIGURE 30 NORTH AMERICA: REGIONAL SNAPSHOT
FIGURE 31 THE INDUSTRIAL END USER SEGMENT IS EXPECTED TO DOMINATE THE LOW VOLTAGE BUSBAR TRUNKING SYSTEM MARKET
FIGURE 32 REGIONAL SNAPSHOT THE ASIA-PACIFIC MARKET HAS THE HIGHEST GROWTH RATE
FIGURE 33 COMPANIES ADOPTED CONTRACTS & AGREEMENTS AS THE KEY GROWTH STRATEGY, 2014�2017
FIGURE 34 MARKET EVALUATION FRAMEWORK, 2013�2017
FIGURE 35 BATTLE FOR MARKET SHARE (2013�2017): CONTRACTS & AGREEMENTS WAS THE KEY STRATEGY ADOPTED BY MAJOR PLAYERS
FIGURE 36 BUSBAR TRUNKING SYSTEM MARKET: VENDOR DIVE MATRIX
FIGURE 37 PRODUCT OFFERING COMPARISON
FIGURE 38 BUSINESS STRATEGY COMPARISON
FIGURE 39 REGIONAL REVENUE MIX OF TOP FIVE COMPANIES
FIGURE 40 ABB LTD.: COMPANY SNAPSHOT (2016)
FIGURE 41 ABB LTD: PRODUCT OFFERINGS SCORECARD
FIGURE 42 ABB LTD: BUSINESS STRATEGY SCORECARD
FIGURE 43 EATON CORPORATION, PLC.: COMPANY SNAPSHOT (2016)
FIGURE 44 EATON CORPORATION, PLC: PRODUCT OFFERINGS SCORECARD
FIGURE 45 EATON CORPORATION, PLC: BUSINESS STRATEGY SCORECARD
FIGURE 46 GE: COMPANY SNAPSHOT (2016)
FIGURE 47 GE: PRODUCT OFFERINGS SCORECARD
FIGURE 48 GE: BUSINESS STRATEGY SCORECARD
FIGURE 49 SCHNEIDER ELECTRIC SE: COMPANY SNAPSHOT (2016)
FIGURE 50 SCHNEIDER ELECTRIC: PRODUCT OFFERINGS SCORECARD
FIGURE 51 SCHNEIDER ELECTRIC: BUSINESS STRATEGY SCORECARD
FIGURE 52 SIEMENS: COMPANY SNAPSHOT (2016)
FIGURE 53 SIEMENS: PRODUCT OFFERINGS SCORECARD
FIGURE 54 SIEMENS: BUSINESS STRATEGY SCORECARD
FIGURE 55 LARSEN & TOUBRO: COMPANY SNAPSHOT (2016)
FIGURE 56 LARSEN & TOUBRO: PRODUCT OFFERINGS SCORECARD
FIGURE 57 LARSEN & TOUBRO: BUSINESS STRATEGY SCORECARD
FIGURE 58 C&S ELECTRIC: PRODUCT OFFERINGS SCORECARD
FIGURE 59 C&S ELECTRIC: BUSINESS STRATEGY SCORECARD
FIGURE 60 LEGRAND SA: COMPANY SNAPSHOT (2016)
FIGURE 61 LEGRAND SA: PRODUCT OFFERINGS SCORECARD
FIGURE 62 LEGRAND SA: BUSINESS STRATEGY SCORECARD
FIGURE 63 GODREJ & BOYCE MANUFACTURING: COMPANY SNAPSHOT (2016)
FIGURE 64 GODREJ & BOYCE MANUFACTURING: PRODUCT OFFERINGS SCORECARD
FIGURE 65 GODREJ & BOYCE MANUFACTURING: BUSINESS STRATEGY SCORECARD
FIGURE 66 IBAR (EMEA) LTD.: PRODUCT OFFERINGS SCORECARD
FIGURE 67 IBAR (EMEA) LTD.: BUSINESS STRATEGY SCORECARD
FIGURE 68 KGS ENGINEERING LTD.: PRODUCT OFFERINGS SCORECARD
FIGURE 69 KGS ENGINEERING LTD.: BUSINESS STRATEGY SCORECARD
FIGURE 70 MEGABARRE GROUP: PRODUCT OFFERINGS SCORECARD
FIGURE 71 MEGABARRE GROUP: BUSINESS STRATEGY SCORECARD
FIGURE 72 NAXSO S.R.L: PRODUCT OFFERINGS SCORECARD
FIGURE 73 NAXSO S.R.L: BUSINESS STRATEGY SCORECARD
FIGURE 74 DBTS INDUSTRIES SDN. BHD.: PRODUCT OFFERINGS SCORECARD
FIGURE 75 DBTS INDUSTRIES SDN. BHD.: BUSINESS STRATEGY SCORECARD
FIGURE 76 E.A.E ELEKTRIK A.S.: PRODUCT OFFERINGS SCORECARD
FIGURE 77 E.A.E ELEKTRIK A.S.: BUSINESS STRATEGY SCORECARD
FIGURE 78 ENTRACO POWER: PRODUCT OFFERINGS SCORECARD
FIGURE 79 ENTRACO POWER: BUSINESS STRATEGY SCORECARD
FIGURE 80 GERSAN ELEKTRIK AS: PRODUCT OFFERINGS SCORECARD
FIGURE 81 GERSAN ELEKTRIK AS: BUSINESS STRATEGY SCORECARD
FIGURE 82 GRAZIADIO & C. S.P.A: PRODUCT OFFERINGS SCORECARD
FIGURE 83 GRAZIADIO & C. S.P.A: BUSINESS STRATEGY SCORECARD
FIGURE 84 NOVA LTD.: PRODUCT OFFERINGS SCORECARD
FIGURE 85 NOVA LTD.: BUSINESS STRATEGY SCORECARD
FIGURE 86 POGLIANO S.R.L.: PRODUCT OFFERINGS SCORECARD
FIGURE 87 POGLIANO S.R.L.: BUSINESS STRATEGY SCORECARD
FIGURE 88 POWER PLUG BUSDUCT SDN. BHD: PRODUCT OFFERINGS SCORECARD
FIGURE 89 POWER PLUG BUSDUCT SDN. BHD: BUSINESS STRATEGY SCORECARD
FIGURE 90 POWERBAR SYSTEM: PRODUCT OFFERINGS SCORECARD
FIGURE 91 POWERBAR SYSTEM: BUSINESS STRATEGY SCORECARD
FIGURE 92 RITTAL GMBH & CO.: PRODUCT OFFERINGS SCORECARD
FIGURE 93 RITTAL GMBH & CO.: BUSINESS STRATEGY SCORECARD
FIGURE 94 SMITHS POWER (POWER DISTRIBUTION, INC.): PRODUCT OFFERINGS SCORECARD
FIGURE 95 SMITHS POWER (POWER DISTRIBUTION, INC.): BUSINESS STRATEGY SCORECARD
FIGURE 96 VASS ELECTRICAL INDUSTRIES: PRODUCT OFFERINGS SCORECARD
FIGURE 97 VASS ELECTRICAL INDUSTRIES: BUSINESS STRATEGY SCORECARD
FIGURE 98 VMTEC: PRODUCT OFFERINGS SCORECARD
FIGURE 99 VMTEC: BUSINESS STRATEGY SCORECARD
FIGURE 100 ARJ GROUP: PRODUCT OFFERINGS SCORECARD
FIGURE 101 ARJ GROUP: BUSINESS STRATEGY SCORECARD
FIGURE 102 BUSBAR SERVICES: PRODUCT OFFERINGS SCORECARD
FIGURE 103 BUSBAR SERVICES: BUSINESS STRATEGY SCORECARD


Growth opportunities and latent adjacency in Busbar Trunking System Market