Building Analytics Market by Application (Fault Detection and Monitoring, Energy Management, Emergency Management, Security Management), Component (Software and Services), Deployment Mode, Building Type, and Region - Global Forecast to 2023


The overall building analytics market expected to grow from USD 4.76 billion in 2017 to USD 11.10 billion by 2023, at a CAGR of 13.3% from 2018 to 2023.
Buildings are the biggest consumers of energy, with an almost 40% share in the world�s energy consumption. Energy-efficient buildings have become a necessity across the globe to help reduce greenhouse gas emissions. Building analytics software are used to generate important insights related to energy consumption across the entire building infrastructure. They help efficiently monitor and control the heating, ventilation, air conditioning, and other systems. Thus, the increasing demand for energy-efficient systems and a decrease in operational costs are driving the overall market growth. Building analytics software are being used in many applications such as energy management, fraud detection and monitoring, security management, emergency management, parking management, operations management, elevators and escalators management, network management and others. The base year considered for the study is 2017, and the forecast has been provided for the period between 2018 and 2023.
Building Analytics Market Dynamics
Drivers
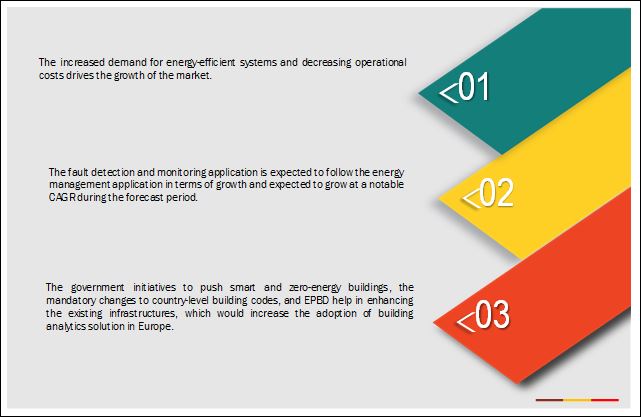
- Increased demand for energy-efficient systems
- Decreasing operational cost
Restraints
- High cost of implementation
Opportunities
- Government initiatives and incentives
- Growing adoption of cloud-based IoT platforms
Challenges
- Lack of awareness about building analytics solutions
Energy management needs in commercial, residential and manufacturing building types drives the global building analytics market
The commercial buildings include IT parks and office buildings, shopping malls, restaurants and bars, and pubs and hotels. Office buildings are the prominent end-users of the building analytics software and services in the commercial buildings segment, due to the major use of energy-consuming equipment, such as HVAC and lighting systems. The proliferation of IoT has also enabled the facility managers to collect large volumes of data about the occupancy patterns, equipment performance, and energy usage trends. Based on the equipment failure reports, the facility managers can save millions of dollars using proactive alerts before the breakdown occurs. The adoption of building analytics software would spur with the increasing number of constructions coming up, mainly in developing countries, such as China, India, and Brazil. Therefore, the ever-growing commercial and residential industry drives the growth of building analytics market.
The following are the major objectives of the study
- To define, describe, and forecast the building analytics market based on applications, components, deployment modes, building types, and regions
- To provide detailed information regarding the major factors, such as drivers, restraints, opportunities, and challenges, influencing the market growth
- To analyze the market�s subsegments with respect to individual growth trends, prospects, and contributions to the total market
- To analyze the opportunities in the market for stakeholders and provide the competitive landscape of the market
- To forecast the revenue of the market segments with respect to 5 major regions, namely, North America, Europe, Asia Pacific (APAC), Middle East and Africa (MEA), and Latin America
- To profile the key players and comprehensively analyze their recent developments and positioning in the building analytics market
- To analyze the competitive developments, such as mergers and acquisitions, new product developments, and Research and Development (R&D) activities, in the market
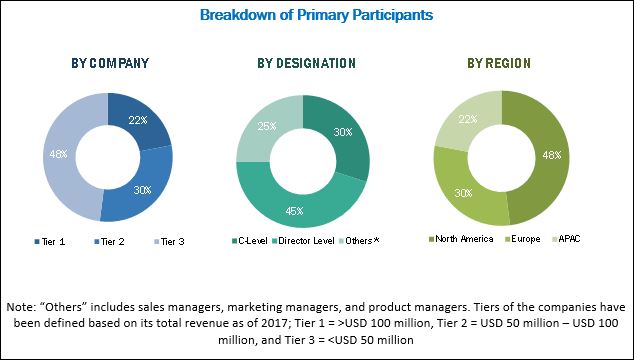
During this research study, major players operating in the building analytics market in various regions have been identified, and their offerings, regional presence, and distribution channels have been analyzed through in-depth discussions. Top-down and bottom-up approaches have been used to determine the overall market size. Sizes of the other individual markets have been estimated using the percentage splits obtained through secondary sources such as Hoovers, Bloomberg BusinessWeek, and Factiva, along with primary respondents. The entire procedure includes the study of the annual and financial reports of the top market players and extensive interviews with industry experts such as CEOs, VPs, directors, and marketing executives for key insights (both qualitative and quantitative) pertaining to the market. The figure below shows the breakdown of the primaries on the basis of the company type, designation, and region considered during the research study.
To know about the assumptions considered for the study, download the pdf brochure
The building analytics market comprises a network of players involved in the research and product development; raw material supply; component manufacturing; distribution and sale; and post-sales services. Key players in building analytics market include Honeywell International Inc. (US), International Business Machines Corporation (US), Johnson Controls International Plc. (Ireland), Schneider Electric SE (France), General Electric Company (US), Siemens AG (Germany), ENGIE Insight Services Inc. (France), Lucid (US), EnerNOC, Inc. (US), BuildingIQ (US), ICONICS, Inc. (US), Senseware (US), KGS Buildings, LLC (US), BuildingLogiX (US), Lutron Electronics Co., Inc. (US), CopperTree Analytics, Inc. (Canada), EcoVox, Inc. (US), GridPoint (US), Energy Advantage (US), Delta Electronics Industry Co., Ltd. (Taiwan), BuildPulse (US), Crestron Electronics, Inc. (US), PointGrab Inc. (Israel), Verdigris (US) and NOVEDA Technologies, Inc. (US).
Major Market Developments
- In February 2018, Honeywell launched CCS Command and Control Suite release 200 (CCS R200) to help building management personnel in improving the operational activities through CCS R200�s data analytics feature.
- In April 2018, BuildingIQ partnered with Cypress Envirosystems to enable digital twinning of older buildings for reduced energy consumption and AI driven efficiency.
- In April 2016, Delta Control acquired by Delta Electronics, a provider of power supply solutions and a wholly owned subsidiary of Delta Electronics.
Key Target Audience for Building Analytics Market
- Building automation component and equipment manufacturers and suppliers
- Device manufacturers and suppliers
- System integrators
- Managed service providers
- Installation, monitoring, and controlling companies
- Technology standard organizations, forums, alliances, and associations related to the building analytics market
- Government organizations
- User data analytics software providers
- Legal agencies
- Professional service providers
Scope of the Report
By Application:
- Fault Detection and Monitoring
- Energy Management
- Security Management
- Emergency Management
- Parking Management
- Operations Management
- Elevators and Escalators Management
- Network Management
- Others
By Component:
- Software
- Services
- Managed Services
- Professional Services
- Consulting
- Support and Maintenance
Building Analytics Market By Deployment Mode:
- On-premises
- Cloud
By Building Type
- Manufacturing Facilities
- Residential Buildings
- Commercial Buildings
- Public Places
- Government Buildings
- Others
By Geography
- North America
- Europe
- Asia Pacific (APAC)
- Middle East and Africa (MEA)
- Latin America
Critical questions which the report answers
- What are new application areas which the building analytics companies are exploring?
- Which are the key players in the market and how intense is the competition?
Available Customizations
- Detailed analysis and profiling of additional market players (Up to 5)
- Where will all these developments take the industry in the mid to long term?
- What are the upcoming industry applications for building analytics software?
Based on the given market data, MarketsandMarkets offers customizations in the reports as per the client�s specific requirements. The available customization options are as follows:
Company Information
The overall building analytics market is expected to grow from USD 5.94 billion in 2018 to USD 11.10 billion by 2023 at a CAGR of 13.3%. Major growth factors for the market include increased demand for energy-efficient systems, and decreasing operational cost requirement. In addition, government initiatives and incentives, and growing cloud-based IoT platforms pose lucrative opportunities for market growth.
Building analytics pinpoints which systems and equipment have irregularities while prioritizing energy cost, severity, and comfort impact. The integration of building analytics solutions enables customers to completely understand building issues and find remedies to challenges. Cloud-based solutions use Artificial Intelligence (AI) to not only identify problem conditions but also guide resolution through suggested actions. Automated, periodic reviews via building diagnostics ensure building analytics software and services continuously drive actions and tracks performance over time. This helps decision-makers access actionable insights and better organize the internal and contract resources for quicker, more efficient repairs and commissioning services. Buildings are the biggest consumers of energy, with an almost 40% share in the world�s energy consumption. Energy-efficient buildings have become a necessity across the globe to help reduce greenhouse gas emissions. Building analytics software are used to generate important insights related to energy consumption across the entire building infrastructure. They help efficiently monitor and control the heating, ventilation, air conditioning, and other systems. Thus, the increasing demand for energy-efficient systems and a decrease in operational costs are driving the overall market growth.
The building analytics market has been segmented on the basis of application into fault detection and monitoring, energy management, security management, emergency management, parking management, operations management, elevators and escalators management, network management and others. The energy management application is expected grow at the highest CAGR between 2018 and 2023. Due to the increasing need to manage the HVAC control systems in real time for its high energy consumption, organizations are rapidly adopting building analytics software and services. This, in turn, is expected to raise the market share of energy management application during the forecast period.
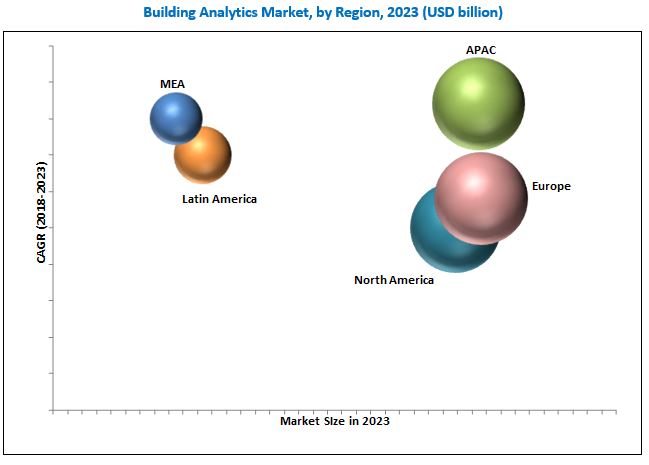
The building analytics market in APAC is expected to grow at the highest CAGR during the forecast period. The APAC region mainly comprises China, Japan, Singapore, and India. The expected high growth can be attributed to the high economic growth witnessed by the major countries in this region such as China, Japan, Singapore and India. The rapid modernization and increase in construction activities in the APAC region have accelerated the growth of automatic centralized control of the HVAC systems installed in the buildings in this region, ultimately leading to the growth of the building analytics market in APAC. As a result, APAC holds a significant share of the overall market.
Energy management and fault detection and monitoring applications in different building types drive the growth of building analytics market
Commercial Buildings
The commercial buildings include IT parks and office buildings, shopping malls, restaurants and bars, and pubs and hotels. Office buildings are the prominent end-users of the building analytics software and services in the commercial buildings segment, due to the major use of energy-consuming equipment, such as HVAC and lighting systems. Similarly, the development of large shopping malls, auditoriums, and marriage halls is encouraging the owners to install building analytics software and services in new as well as old buildings. Retailing is a complex business, wherein store owners face many challenges related to security.
Residential Buildings
Residential buildings are one of the major consumers of energy, where building analytics software has proven to be essential in identifying the wastage of energy and taking steps for minimizing the energy usage. The rising urbanization trends have increased the energy consumption of buildings in the recent past. Moreover, the increased use of smart appliances has further triggered the need for building analytics solutions and saving energy and costs in the long run.
Public Places
Public places such as stadiums, monument buildings, airports, and railway stations require a continuous supply of energy, as they have to function to provide uninterrupted services to customers and visitors. Moreover, these places are occupied with a large number of people and becomes overcrowded at peak hours. The stadiums are built with an aim to minimize the use of resources.
Manufacturing Facilities
The building analytics software allows facility managers to improve the plant and equipment efficiency, thus reducing the energy costs, equipment outages, and occupant discomforts. Manufacturing and various other industrial buildings are equipped with different technological devices and air conditioning units to control the ventilation systems, which majorly contributes to the overall energy consumption of the building. Building analytics software, therefore, enables the facility managers to collect and analyze large volumes of building data and derive actionable insights from the data to identify issues and opportunities for energy savings.
Critical questions the report answers
The high implementation cost is a major factor restraining the growth of the market. With the advancement of technology, growing government initiatives and incentives and increasing adoption of cloud based IoT platforms has reduced the impact to a large extent and created lucrative market opportunities. The government also provides incentives to support the growth of building management systems. For instance, by complying with the USGBC LEED certification, the building owner can get tax rebates. The Government of India launched the Smart Cities Mission in 2015 with an aim to develop more than 100 cities all over the country to make them citizen-friendly and sustainable. All these factors are expected to fuel the growth of the building management system market. This, in turn, would foster the growth of building analytics solutions.
Key players in building analytics market include Honeywell International Inc. (US), International Business Machines Corporation (US), Johnson Controls International Plc. (Ireland), Schneider Electric SE (France), General Electric Company (US), Siemens AG (Germany), ENGIE Insight Services Inc. (France), Lucid (US), EnerNOC, Inc. (US), BuildingIQ (US), ICONICS, Inc. (US), Senseware (US), KGS Buildings, LLC (US), BuildingLogiX (US), Lutron Electronics Co., Inc. (US), CopperTree Analytics, Inc. (Canada), EcoVox, Inc. (US), GridPoint (US), Energy Advantage (US), Delta Electronics Industry Co., Ltd. (Taiwan), BuildPulse (US), Crestron Electronics, Inc. (US), PointGrab Inc. (Israel), Verdigris (US) and NOVEDA Technologies, Inc. (US). These vendors have adopted different types of organic and inorganic growth strategies, such as new product launches, partnerships and collaborations, expansions, and acquisitions, to expand their offerings in the global market.
 Exclusive indicates content/data unique to MarketsandMarkets and not available with any competitors.
Table of Contents
1 Introduction (Page No. - 17)
1.1 Objectives of the Building Analytics Market Study
1.2 Market Definition
1.3 Market Scope
1.4 Years Considered for the Study
1.5 Currency
1.6 Stakeholders
2 Research Methodology (Page No. - 21)
2.1 Research Data
2.1.1 Secondary Data
2.1.2 Primary Data
2.1.2.1 Breakdown of Primaries
2.1.2.2 Key Industry Insights
2.2 Building Analytics Market Size Estimation
2.3 Research Assumptions
2.4 Limitations
3 Executive Summary (Page No. - 28)
4 Premium Insights (Page No. - 33)
4.1 Attractive Opportunities in the Building Analytics Market
4.2 Market Regional Analysis
4.3 Investment Opportunities in the Market
5 Building Analytics Market Overview and Industry Trends (Page No. - 36)
5.1 Introduction
5.2 Market Dynamics
5.2.1 Drivers
5.2.1.1 Increased Demand for Energy-Efficient Systems
5.2.1.2 Decreasing Operational Cost
5.2.2 Restraints
5.2.2.1 High Cost of Implementation
5.2.3 Opportunities
5.2.3.1 Government Initiatives and Incentives
5.2.3.2 Growing Adoption of Cloud-Based IoT Platforms
5.2.4 Challenges
5.2.4.1 Lack of Awareness About Building Analytics Solutions
5.3 Industry Trends
5.4 Building Analytics: Use Cases
5.4.1 Use Case #1: Minimizing Energy Cost and Consumption
5.4.2 Use Case #2: Managing and Improving Asset Life Cycle
5.5 Regulations
5.5.1 Bacnet�A Data Communication Protocol for Building Automation and Control Networks
5.5.2 Knx
5.5.3 Digital Addressable Lighting Interface (DALI)
5.5.4 EU General Data Protection Regulation (GDPR)
5.5.5 Modbus
5.5.6 Cloud Standard Customer Council (CSCC)
5.6 Ecosystem
6 Building Analytics Market, By Application (Page No. - 43)
6.1 Introduction
6.2 Fault Detection and Monitoring
6.3 Energy Management
6.3.1 Heating, Ventilation, and Air Conditioning Control Systems Management
6.3.2 Lighting Control Systems Management
6.4 Security Management
6.4.1 Video Surveillance
6.4.2 Access Control
6.5 Emergency Management
6.6 Parking Management
6.6.1 Parking Fee and Revenue Management
6.6.2 Parking Reservation Management
6.6.3 Parking Guidance and Slot Management
6.7 Operations Management
6.8 Elevators and Escalators Management
6.9 Network Management
6.10 Others
7 Building Analytics Market, By Component (Page No. - 53)
7.1 Introduction
7.2 Software
7.3 Services
7.3.1 Managed Services
7.3.2 Professional Services
7.3.2.1 Consulting
7.3.2.2 Support and Maintenance
8 Building Analytics Market By Deployment Mode (Page No. - 61)
8.1 Introduction
8.2 On-Premises
8.3 Cloud
9 Market By Building Type (Page No. - 65)
9.1 Introduction
9.2 Manufacturing Facilities
9.3 Residential Buildings
9.4 Commercial Buildings
9.5 Public Places
9.6 Government Buildings
9.7 Others
10 Building Analytics Market, By Region (Page No. - 72)
10.1 Introduction
10.2 North America
10.2.1 By Application
10.2.2 By Component
10.2.3 By Deployment Mode
10.2.4 By Building Type
10.2.5 By Country
10.2.5.1 United States
10.2.5.2 Canada
10.3 Europe
10.3.1 By Application
10.3.2 By Component
10.3.3 By Deployment Mode
10.3.4 By Building Type
10.3.5 By Country
10.3.5.1 United Kingdom
10.3.5.2 Germany
10.3.5.3 France
10.3.5.4 Rest of Europe
10.4 Asia Pacific
10.4.1 By Application
10.4.2 By Component
10.4.3 By Deployment Mode
10.4.4 By Building Type
10.4.5 By Country
10.4.5.1 Japan
10.4.5.2 China
10.4.5.3 Singapore
10.4.5.4 India
10.4.5.5 Rest of Asia Pacific
10.5 Middle East and Africa
10.5.1 By Application
10.5.2 By Component
10.5.3 By Deployment Mode
10.5.4 By Building Type
10.5.5 By Country
10.5.5.1 United Arab Emirates
10.5.5.2 Kingdom of Saudi Arabia
10.5.5.3 South Africa
10.5.5.4 Rest of Middle East and Africa
10.6 Latin America
10.6.1 By Application
10.6.2 By Component
10.6.3 By Deployment Mode
10.6.4 By Building Type
10.6.5 By Country
10.6.5.1 Mexico
10.6.5.2 Brazil
10.6.5.3 Rest of Latin America
11 Competitive Landscape (Page No. - 96)
11.1 Overview
11.2 Prominent Players in the Building Analytics Market
11.3 Competitive Scenario
11.3.1 New Product Launches and Product Upgradations
11.3.2 Partnerships, Collaborations, and Agreements
11.3.3 Business Expansions
11.3.4 Acquisitions
12 Company Profiles (Page No. - 103)
(Business Overview, Platforms/ Software/ Services/ Solutions Offered, Recent Developments, SWOT Analysis, and MnM View)*
12.1 Schneider Electric
12.2 Johnson Controls
12.3 IBM
12.4 Honeywell
12.5 Siemens
12.6 General Electric
12.7 BuildingIQ
12.8 ICONICS
12.9 CopperTree Analytics
12.10 Delta Electronics
12.11 EnerNOC
12.12 BuildPulse
12.13 ENGIE Insight Services
12.14 GridPoint
12.15 EcoVox
12.16 BuildingLogiX
12.17 Crestron Electronics
12.18 Energy Advantage
12.19 Lucid
12.20 NOVEDA Technologies
12.21 Senseware
12.22 PointGrab
12.23 KGS Buildings
12.24 Verdigris
12.25 Lutron Electronics
*Details on Business Overview, Platforms/ Software/ Services/ Solutions Offered, Recent Developments, SWOT Analysis, and MnM View Might Not Be Captured in Case of Unlisted Companies.
13 Appendix (Page No. - 150)
13.1 Insights of Industry Experts
13.2 Discussion Guide
13.3 Knowledge Store: MarketsandMarkets� Subscription Portal
13.4 Available Customization
13.5 Related Reports
13.6 Author Details
List of Tables (71 Tables)
Table 1 United States Dollar Exchange Rate, 2014�2017
Table 2 Building Analytics Market Size and Growth Rate, 2016�2023 (USD Million, Y-O-Y %)
Table 3 Market Size By Application, 2016�2023 (USD Million)
Table 4 Fault Detection and Monitoring: Market Size By Region, 2016�2023 (USD Million)
Table 5 Energy Management: Market Size By Region, 2016�2023 (USD Million)
Table 6 Security Management: Market Size By Region, 2016�2023 (USD Million)
Table 7 Emergency Management: Market Size By Region, 2016�2023 (USD Million)
Table 8 Parking Management: Market Size By Region, 2016�2023 (USD Million)
Table 9 Operations Management: Market Size By Region, 2016�2023 (USD Million)
Table 10 Elevators and Escalators Management: Market Size By Region, 2016�2023 (USD Million)
Table 11 Network Management: Market Size By Region, 2016�2023 (USD Million)
Table 12 Others: Market Size By Region, 2016�2023 (USD Million)
Table 13 Building Analytics Market Size, By Component, 2016�2023 (USD Million)
Table 14 Software: Market Size By Region, 2016�2023 (USD Million)
Table 15 Services: Market Size By Region, 2016�2023 (USD Million)
Table 16 Services: Market Size By Type, 2016�2023 (USD Million)
Table 17 Managed Services Market Size, By Region, 2016�2023 (USD Million)
Table 18 Professional Services Market Size, By Region, 2016�2023 (USD Million)
Table 19 Professional Services Market Size, By Type, 2016�2023 (USD Million)
Table 20 Consulting Market Size, By Region, 2016�2023 (USD Million)
Table 21 Support and Maintenance Market Size, By Region, 2016�2023 (USD Million)
Table 22 Building Analytics Market Size, By Deployment Mode, 2016�2023 (USD Million)
Table 23 On-Premises: Market Size By Region, 2016�2023 (USD Million)
Table 24 Cloud: Market Size By Region, 2016�2023 (USD Million)
Table 25 Market Size, By Building Type, 2016�2023 (USD Million)
Table 26 Manufacturing Facilities: Market Size By Region, 2016�2023 (USD Million)
Table 27 Residential Buildings: Market Size By Region, 2016�2023 (USD Million)
Table 28 Commercial Buildings: Market Size By Region, 2016�2023 (USD Million)
Table 29 Public Places: Market Size By Region, 2016�2023 (USD Million)
Table 30 Government Buildings: Market Size By Region, 2016�2023 (USD Million)
Table 31 Others: Market Size By Region, 2016�2023 (USD Million)
Table 32 Building Analytics Market Size, By Region, 2016�2023 (USD Million)
Table 33 North America: Market Size By Application, 2016�2023 (USD Million)
Table 34 North America: Market Size By Component, 2016�2023 (USD Million)
Table 35 North America: Market Size By Service, 2016�2023 (USD Million)
Table 36 North America: Market Size By Professional Service, 2016�2023 (USD Million)
Table 37 North America: Market Size By Deployment Mode, 2016�2023 (USD Million)
Table 38 North America: Market Size By Building Type, 2016�2023 (USD Million)
Table 39 North America: Market Size By Country, 2016�2023 (USD Million)
Table 40 Europe: Building Analytics Market Size, By Application, 2016�2023 (USD Million)
Table 41 Europe: Market Size By Component, 2016�2023 (USD Million)
Table 42 Europe: Market Size By Service, 2016�2023 (USD Million)
Table 43 Europe: Market Size By Professional Service, 2016�2023 (USD Million)
Table 44 Europe: Market Size By Deployment Mode, 2016�2023 (USD Million)
Table 45 Europe: Market Size By Building Type, 2016�2023 (USD Million)
Table 46 Europe: Market Size By Country, 2016�2023 (USD Million)
Table 47 Asia Pacific: Building Analytics Market Size, By Application, 2016�2023 (USD Million)
Table 48 Asia Pacific: Market Size By Component, 2016�2023 (USD Million)
Table 49 Asia Pacific: Market Size By Service, 2016�2023 (USD Million)
Table 50 Asia Pacific: Market Size By Professional Service, 2016�2023 (USD Million)
Table 51 Asia Pacific: Market Size By Deployment Mode, 2016�2023 (USD Million)
Table 52 Asia Pacific: Market Size By Building Type, 2016�2023 (USD Million)
Table 53 Asia Pacific: Market Size By Country, 2016�2023 (USD Million)
Table 54 Middle East and Africa: Building Analytics Market Size, By Application, 2016�2023 (USD Million)
Table 55 Middle East and Africa: Market Size By Component, 2016�2023 (USD Million)
Table 56 Middle East and Africa: Market Size By Service, 2016�2023 (USD Million)
Table 57 Middle East and Africa: Market Size By Professional Service, 2016�2023 (USD Million)
Table 58 Middle East and Africa: Market Size By Deployment Mode, 2016�2023 (USD Million)
Table 59 Middle East and Africa: Market Size By Building Type, 2016�2023 (USD Million)
Table 60 Middle East and Africa: Market Size By Country, 2016�2023 (USD Million)
Table 61 Latin America: Building Analytics Market Size, By Application, 2016�2023 (USD Million)
Table 62 Latin America: Market Size By Component, 2016�2023 (USD Million)
Table 63 Latin America: Market Size By Service, 2016�2023 (USD Million)
Table 64 Latin America: Market Size By Professional Service, 2016�2023 (USD Million)
Table 65 Latin America: Market Size By Deployment Mode, 2016�2023 (USD Million)
Table 66 Latin America: Market Size By Building Type, 2016�2023 (USD Million)
Table 67 Latin America: Market Size By Country, 2016�2023 (USD Million)
Table 68 New Product Launches and Product Upgradations, 2016�2018
Table 69 Partnerships, Collaborations, and Agreements, 2016�2018
Table 70 Business Expansions, 2017�2018
Table 71 Acquisitions, 2015�2018
List of Figures (44 Figures)
Figure 1 Building Analytics Market: Market Segmentation
Figure 2 Regional Scope
Figure 3 Market: Research Design
Figure 4 Breakdown of Primary Interviews: By Company, Designation, and Region
Figure 5 Data Triangulation
Figure 6 Market Size Estimation Methodology: Bottom-Up Approach
Figure 7 Market Size Estimation Methodology: Top-Down Approach
Figure 8 Building Analytics Market: Assumptions
Figure 9 Global Market is Expected to Register Significant Growth During the Forecast Period
Figure 10 Market Snapshot, By Component, 2018 vs 2023
Figure 11 Market Snapshot, By Service, 2018 vs 2023
Figure 12 Market Snapshot, By Application, 2018 vs 2023
Figure 13 Market Snapshot, By Deployment Mode, 2018 vs 2023
Figure 14 Market Snapshot, By Building Type, 2018�2023
Figure 15 Increasing Demand for Energy-Efficient Systems and the Decreasing Operational Costs are Expected to Drive the Growth of the Building Analytics Market
Figure 16 Europe is Estimated to Have the Largest Market Share in 2018
Figure 17 Asia Pacific is Expected to Have the Highest CAGR During the Forecast Period
Figure 18 Market: Drivers, Restraints, Opportunities, and Challenges
Figure 19 Building Analytics Market Ecosystem
Figure 20 Energy Management Application is Expected to Grow at the Highest CAGR During the Forecast Period
Figure 21 Services Segment is Expected to Grow at A Higher CAGR During the Forecast Period
Figure 22 Managed Services Segment is Expected to Grow at A Higher CAGR During the Forecast Period
Figure 23 Consulting Services Segment is Expected to Grow at A Higher CAGR During the Forecast Period
Figure 24 Cloud Deployment Mode is Expected to Grow at A Higher CAGR During the Forecast Period
Figure 25 Manufacturing Facilities Segment is Expected to Grow at the Highest CAGR During the Forecast Period
Figure 26 Asia Pacific is Expected to Grow at the Highest CAGR During the Forecast Period
Figure 27 Europe: Building Analytics Market Snapshot
Figure 28 Asia Pacific: Market Snapshot
Figure 29 Key Developments By the Leading Players in the Building Analytics Market, 2015�2018
Figure 30 Schneider Electric: Company Snapshot
Figure 31 Schneider Electric: SWOT Analysis
Figure 32 Johnson Controls: Company Snapshot
Figure 33 Johnson Controls: SWOT Analysis
Figure 34 IBM: Company Snapshot
Figure 35 IBM: SWOT Analysis
Figure 36 Honeywell: Company Snapshot
Figure 37 Honeywell: SWOT Analysis
Figure 38 Siemens: Company Snapshot
Figure 39 Siemens: SWOT Analysis
Figure 40 General Electric: Company Snapshot
Figure 41 BuildingIQ: Company Snapshot
Figure 42 Delta Electronics: Company Snapshot
Figure 43 EnerNOC: Company Snapshot
Figure 44 Engie Insight: Company Snapshot


Growth opportunities and latent adjacency in Building Analytics Market