Brewing Enzymes Market by Type (Amylase, Beta-glucanase, Protease, Xylanase, ALDC, Pectinase), Application (Beer and Wine), Source (Microbial and Plant), Form (Liquid and Powder), Process, and Region - Global Forecast to 2023


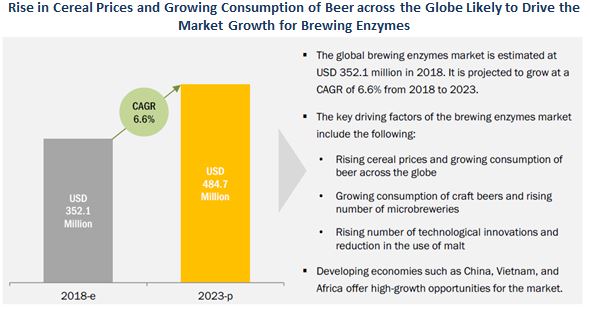
[170 Pages] The brewing enzymes market was valued at USD 332.2 million in 2017 and is projected to reach USD 484.7 million by 2023, at a CAGR of 6.6% from 2018.
For More details on this research, Request Free Sample Report
The objectives of this study are to define, segment, and project the size of the brewing enzymes market based on type, application, source, form, process, and key region.
- Identifying attractive opportunities in the market by determining the largest and fastest-growing segments across regions
- Analyzing demand-side factors based on the impact of macroeconomic factors such as GDP, population size, per capita income, the beer & wine industry, and microeconomic factors such as technological advancements, growing innovations, and the cost/price of enzymes used in the market
- Identifying and profiling key players in the brewing enzymes market
-
Providing a comparative analysis of the market leaders on the basis of the following:
- Product offerings
- Business strategies
- SWOT (strengths, weaknesses, opportunities, threats)
- Key financials
- Understanding the competitive landscape and identifying the major growth strategies adopted by players across key regions
- Analyzing the market dynamics and competitive situations & trends across regions and their impact on prominent market players
The years and periodization considered for the study are as follows:
- Base year: 2017
- Beginning of the projection period: 2018
- End of the projection period: 2023
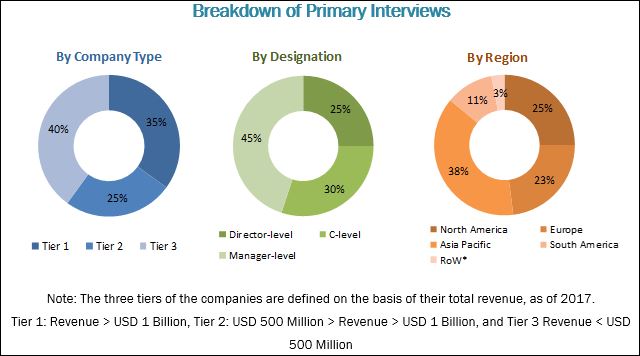
This report includes the estimation of the market size for value (USD million) and volume (tons). Both, top-down and bottom-up approaches have been used to estimate and validate the size of the brewing enzymes market and to estimate the size of various other dependent submarkets in the overall market. Key players in the market have been identified through secondary research (FAO, Bloomberg Businessweek, and companies’ annual reports). All percentage shares, splits, and breakdowns have been determined using secondary sources and verified through primary sources.
To know about the assumptions considered for the study, download the pdf brochure
Market Ecosystem
The various contributors involved in the value chain of brewing enzymes include manufacturers, suppliers, distributors, importers, and exporters of brewing enzymes for manufacturing beer and wine. The key players in the brewing enzymes market include Novozymes (Denmark), DSM (Netherlands), DowDuPont (US), Amano Enzyme (Japan), Chr. Hansen (Denmark), Associated British Foods (UK), Kerry Group (Ireland), Brenntag (Germany), Enzyme Development Corporation (US), Aumgene Biosciences (India), Biocatalysts (UK), and Enzyme Innovation (US).
Opportunities
Demand for enzymes to increase beer manufacturing efficiency
Beer and wine manufacturers continue to look for advanced solutions to meet safety standards and increase productivity to meet the changes in consumer demand for beer and wine. Key beer and wine manufacturers are mostly focused on increasing the level of efficiency to grow their level of volumes for the production of beer. Brewers who seek raw material cost savings or use of local raw materials may source under-modified malts or increase the ration of adjunct. However, the limiting factor is to ensure an adequate complex of enzymatic activities for high-quality wort. Thus, with the intent of increasing efficiency and optimize raw material usage, many brewers are now focused on commercial enzymes to shorten the production time, increase capacity, and for the use of raw material alternatives to malt.
Emerging economies with high growth potential.
The dominance of nuclear double-income families, especially in urban areas in emerging economies contributes to changes in lifestyles among consumers. Changes in consumption patterns have led to an increase in the demand for alcoholic beverages.
Challenges
Low malt prices
Traditionally, the use of barley has been limited to 10-20% of the grist when using high-quality malts. At higher levels of barley or using under modified malts, processing becomes more difficult. In such cases, the mash needs to be supplemented with extra enzyme activity if the brewer is to benefit from the advantages of using unmalted barley while still maintaining brewing performance. Brewers can add a malt-equivalent blend of a-amylase, b-glucanase, and protease. However, traditional brewing practitioners are not inclined towards the use of industrial enzymes, produced by genetically modified microorganisms, in the brewing industry. The use of enzymes such as amylase, glucanase, and protease is hindered by these brewing traditions.
Target Audience
- Government and research organizations
- Associations and industrial bodies
- Raw material suppliers and distributors
- Beer and wine producers/processors
- Commercial research & development (R&D) institutions
Recent Developments
New Product Launches
New Product Launches, 2013–2018
|
DATE |
COMPANY |
DEVELOPMENT |
|
Oct 2017 |
Biocatalysts (UK) |
The company announced the launch of a new enzyme panel for the food industry, which was aimed at companies developing products to address the current trends of sugar reduction and soluble fiber inclusion. |
|
November 2015 |
Biocatalysts (UK) |
Biocatalysts launched a new enzyme development & manufacturing service, which includes enzyme cloning, optimization, and scale-up of enzymes. This helped the company to gain a competitive edge for its product portfolio. |
Partnerships & Agreements
Partnerships & Agreements, 2013–2018
|
DATE |
COMPANY |
DEVELOPMENT |
|
July 2017 |
Associated British Foods (UK) |
Genedata Selector–a leading provider of advanced software solutions for R&D–and AB Enzymes expanded their partnership. The company, as a part of this partnership, was using its software, Genedata Selector, as its bioinformatics platform for strain genome data management on all of its production-relevant organization. As a result of this partnership, the former will use it for decision support on production strain optimization and strain compliance assessment processes. |
|
July 2017 |
Kerry Group (Ireland) |
Kerry announced a new technology partnership with Ginkgo Bioworks, an organism company designing custom microbes for application markets. The partnership would help Kerry and Ginkgo to work to expand into the enzyme business, extending their market reach and leveraging each other’s technologies and processes to improve the production of specific enzymes used in food. |
Scope of the Brewing Enzymes Market Report:
The brewing enzymes market is segmented as follows:
On the basis of Type:
- Amylase
- Beta-glucanase
- Protease
- Xylanase
- Others (alpha acetolactate-decarboxylase (ALDC), pectinase, hydrolase, beta-glucosidase, and amyloglucosidase)
On the basis of Application:
- Beer
- Wine
On the basis of Source:
- Microbial
- Plant
On the basis of Form:
- Liquid
- Powder
On the basis of Process (Qualitative):
- Malting
- Mashing & fermentation
- Wort separation and filtration
- Maturation
Brewing Enzymes Market on the basis of Region:
- North America
- Europe
- Asia Pacific
- South America
- RoW (South Africa and the Middle East & Rest of Africa)
Available Customizations
With the given market data, MarketsandMarkets offers customizations according to the client-specific needs.
The following customization options are available for the report:
Product Analysis
- Product matrix, which gives a detailed comparison of the product portfolio of each company
Regional Analysis
- Further breakdown of the Rest of Asia Pacific brewing enzymes market on the basis of the key contributing countries
- Further breakdown of the Rest of the World brewing enzymes market on the basis of the key South American countries
Company Information
- Detailed analysis and profiling of additional market players (up to five)
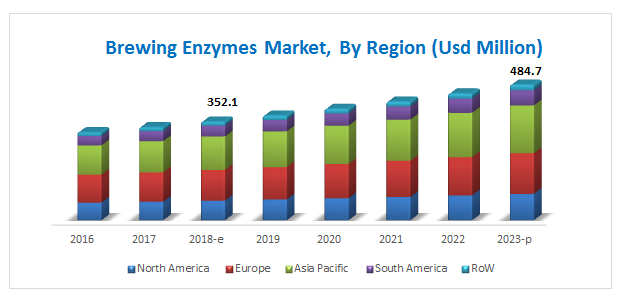
The brewing enzymes market is estimated at USD 352.1 million in 2018. It is projected to reach USD 484.7 million by 2023, at a CAGR of 6.6% from 2018, in terms of value. The use of enzymes has become increasingly important in the brewing industry, as they accelerate the chemical reaction without a change in their own structure. To enhance the brewing process, commercial exogenous enzymes are used in various steps to make the brewing faster, easier, and more consistent. The demand for brewing enzymes in the beer segment is expected to witness significant growth in the near future, due to the rising popularity of beer consumption among young consumers, rise in technological innovations, and growth in the craft beer segment and number of microbreweries.
The amylase segment is projected to dominate the brewing enzymes market through the forecast period. The growth of this market is proportionally dependent on the production of beer globally. Amylases are mainly used in industries because of their cost-effectiveness, less-time-consuming processes, and less space; it is also easy to modify and optimize the processes involving them. The consumption of amylase is significant in the Asia Pacific and African regions, due to lower access to malt in these regions which will lead to higher demand for amylase.
The microbial source is estimated to dominate the global market, as they are easy to handle, can be produced in huge tanks without light, and have a high growth rate. The ideal microorganism grows quickly and produces a significant amount of the desired enzyme at mild temperatures while consuming inexpensive nutrients. Microbial sources are also more cost-effective sources than plant sources, which has fueled the growth of this segment.
The liquid form of brewing enzymes is projected to grow at a higher CAGR between 2018 and 2023. It is preferred in the brewing process as it saves energy, reduces water usage, reduces wastage of beer, and simplifies the filtering process.
For More details on this research, Request Free Sample Report
The Asia Pacific region dominated the brewing enzymes market in 2017 and is projected to grow at the highest CAGR from 2018 to 2023. The main countries contributing significantly toward the growth of the market in the region include Vietnam, China, Australia, and New Zealand. The Asia Pacific region is heterogeneous, with diversity in income levels, technology, and demand for quality beer products, leading to enhanced scope for future growth. These factors influence the use of brewing enzymes in the beer and wine segment.
In the European region, the growth of brewing enzymes can be attributed to the increase in the production of wine, flavored beers, and gluten-free beers. Additionally, the increase in domestic consumption of premium products with better taste and quality also drives the production of beers and wine in Europe. Growth in the craft beer market acts as a major driver for the growth in this market. The increase in the number of craft breweries, the rise in popularity of such beers among consumers, growing awareness about some health benefits of consuming beer, and the increase in disposable income, especially in Western European countries, have fueled the growth of the brewing enzymes market in the region.
Lack of uniformity in regulations affect international trade and hence are a restraining factor for the growth of the this market
The brewing enzymes market is concentrated, with leading companies driving the market growth. This report provides a qualitative analysis of the prominent market players and their preferred development strategies. Key players such as Novozymes (Denmark), DSM (Netherlands), DowDuPont (US), Amano Enzyme (Japan), Chr. Hansen (Denmark), Associated British Foods (UK), and Kerry Group (Ireland) have been profiled in the report. These leading players have adopted strategies such as expansions & investments, new product launches, mergers & acquisitions, and partnerships & agreements to explore new and untapped markets, expand in local areas of emerging markets, and develop a new customer base for long-term client relationships. This has not only enabled the key players to expand their geographical reach but has also reinforced their market position by gaining a larger share in terms of revenue and product portfolios.
Small-scale players have also adopted these strategies to expand their businesses globally by investing in the establishment of manufacturing facilities and technical service centers in various regions. This inorganic growth strategy enables them to improve their technical expertise through intensive R&D infrastructure offered by bigger players.
To speak to our analyst for a discussion on the above findings, click Speak to Analyst
Drivers
Forecasted high cereal price trend
Despite the high production estimations for cereals, as per FAO estimates for 2017, their prices are expected to increase in the coming years owing to a forecasted downfall in output. Even with the improved availability of cereals and sugar in the global market, the price of both these commodities has seen a sharp rise. The FAO cereal index (a trade-weighted measure of the monthly change in international prices of food commodities namely sugar, cereals, dairy, meat, meat, and vegetable oils) also increased by 3.4% from December to a six month high.
Increasing per capita income driving beer consumption in Asia Pacific
Rapid economic and income growth, urbanization, and globalization are leading to a dramatic shift in the cultural patterns in the Asia Pacific region. The fast pace of lifestyles and consumer willingness to try out new alcoholic beverages is identified as a factor responsible for increasing beer consumption and subsequently driving the demand for brewing enzymes. Higher levels of income are resulting in a higher demand for alcohol and subsequently driving the demand for beer and wine. The nominal per-capita income is estimated to grow at a CAGR of ~8%, which is expected to fuel the growth of the beer industry and is expected to result in high demand for brewing enzyme.
Restraint
Lack of Uniformity in Regulations
The manufacturers of enzymes are required to comply with regulations imposed by different governing agencies such as the Enzyme Technical Association (ETA), Association of Manufacturers & Formulators of Enzyme Products (AMFEP), and the Food and Drug Administration (FDA). Enzymes in the food industry are required to adhere to the guidelines defined by the Food Chemicals Codex as well. There is lack of a uniform regulatory structure for the use of industrial enzymes, even though stringent regulations are imposed for their in industries in the UK, Canada, and the European Union.
Expansions & Investments
Expansions & Investments, 2013–2018
|
DATE |
COMPANY |
DEVELOPMENT |
|
June 2018 |
DowDuPont (US) |
DuPont Industrial Biosciences (IB), which develops enzymes, biomaterials, opened up a new facility in Wilmington, Delaware, for developing new science-based innovations. |
|
January 2018 |
Associated British Foods (UK) |
AB Enzymes, a subsidiary of ABF Plc (UK), opened a new warehousing and distribution center known as Diversified Entities LLC in North America. It is likely to strengthen the supply chain of AB Enzymes in North America. |
Mergers & Acquisitions
Mergers & Acquisitions, 2013–2018
|
DATE |
COMPANY |
DEVELOPMENT |
|
March 2018 |
Biocatalysts (UK) |
Majority of stakes of Biocatalysts was acquired by Brain AG. This acquisition aimed to accelerate the latter’s business in high-growth markets. |
|
September 2017 |
DowDuPont (US) |
DuPont merged with Dow Chemicals to form a combined entity named “DowDuPont.” This merger would form one of the leading conglomerates in agriculture, specialty product, and material science industries. |
Frequently Asked Questions (FAQ):
What is the leading application in the brewing enzymes market?
The beer segment was the highest revenue contributor to the market, with USD 284.0 million in 2017, and is estimated to reach USD 419.5 million by 2023, with a CAGR of 6.8%.
What is the estimated industry size of brewing enzymes?
The global brewing enzymes market was valued at USD 332.2 million in 2017, and is projected to reach USD 484.7 million by 2023, registering a CAGR of 6.6% from 2018 to 2023.
What is the leading type of brewing enzymes market?
The amylase segment was the highest revenue contributor to the market, with USD 115.9 million in 2017, and is estimated to reach USD 165.0 million by 2023, with a CAGR of 6.2%. .
To speak to our analyst for a discussion on the above findings, click Speak to Analyst
 Exclusive indicates content/data unique to MarketsandMarkets and not available with any competitors.
Table of Contents
1 Introduction (Page No. - 15)
1.1 Objectives of the Study
1.2 Market Definition
1.3 Study Scope
1.4 Periodization Considered
1.5 Currency Considered
1.6 Unit Considered
1.7 Stakeholders
2 Research Methodology (Page No. - 19)
2.1 Research Data
2.1.1 Secondary Data
2.1.2 Primary Data
2.1.2.1 Key Industry Insights
2.1.2.2 Breakdown of Primaries
2.2 Market Size Estimation
2.3 Data Triangulation
2.4 Research Assumptions & Limitations
2.4.1 Assumptions
2.4.2 Limitations
3 Executive Summary (Page No. - 27)
4 Premium Insights (Page No. - 31)
4.1 Attractive Opportunities in this Market
4.2 Market For Brewing Enzymes, By Type
4.3 Market For Brewing Enzymes, By Form & Region
4.4 Asia Pacific: Brewing Enzymes Market, By Type & Country
4.5 Market For Brewing Enzymes, By Region
5 Market Overview (Page No. - 36)
5.1 Introduction
5.2 Market Dynamics
5.2.1 Drivers
5.2.1.1 Forecasted High Cereal Price Trend
5.2.1.2 Increasing Per Capita Income Driving Beer Consumption in Asia Pacific
5.2.1.3 Continuous R&D, Resulting in Product and Process Innovations
5.2.1.4 Increasing Popularity of Craft Breweries and Specialty Beers
5.2.1.5 Need for Cost Reduction and Resource Optimization
5.2.2 Restraints
5.2.2.1 Lack of Uniformity in Regulations
5.2.3 Opportunities
5.2.3.1 Demand for Enzymes to Increase Beer Manufacturing Efficiency
5.2.3.2 Emerging Economies With High Growth Potential.
5.2.4 Challenges
5.2.4.1 Low Malt Prices
6 Brewing Enzymes Market, By Type (Page No. - 44)
6.1 Introduction
6.2 Amylase
6.3 Beta-Glucanase
6.4 Protease
6.5 Xylanase
6.6 Others
7 Brewing Enzymes Market, By Application (Page No. - 54)
7.1 Introduction
7.2 Beer
7.3 Wine
8 Brewing Enzymes Market, By Source (Page No. - 60)
8.1 Introduction
8.2 Microbial
8.3 Plant
9 Brewing Enzymes Market, By Form (Page No. - 66)
9.1 Introduction
9.2 Liquid
9.3 Powder
10 Brewing Enzymes Market, By Process (Page No. - 71)
10.1 Introduction
10.2 Malting
10.3 Mashing & Fermentation
10.4 Wort Separation and Filtration
10.5 Maturation
11 Brewing Enzymes Market, By Region (Page No. - 74)
11.1 Introduction
11.2 North America
11.2.1 US
11.2.2 Canada
11.2.3 Mexico
11.3 Europe
11.3.1 Spain
11.3.2 France
11.3.3 Italy
11.3.4 UK
11.3.5 Germany
11.3.6 Netherlands
11.3.7 Rest of Europe
11.4 Asia Pacific
11.4.1 China
11.4.2 Japan
11.4.3 Vietnam
11.4.4 Australia
11.4.5 New Zealand
11.4.6 Rest of Asia Pacific
11.5 South America
11.5.1 Brazil
11.5.2 Argentina
11.5.3 Rest of South America
11.6 Rest of the World (RoW)
11.6.1 South Africa
11.6.2 Middle East & Rest of Africa
12 Competitive Landscape (Page No. - 129)
12.1 Overview
12.2 Competitive Scenario
12.2.1 Expansions & Investments
12.2.2 New Product Launches
12.2.3 Mergers & Acquisitions
12.2.4 Partnerships & Agreements
13 Company Profiles (Page No. - 135)
(Business Overview, Products Offered, Recent Developments, SWOT Analysis, MnM View)*
13.1 Novozymes
13.2 DSM
13.3 Dowdupont
13.4 Amano Enzymes
13.5 Chr. Hansen
13.6 Associated British Foods
13.7 Kerry Group
13.8 Brenntag
13.9 Enzyme Development Corporation
13.10 Aumgene Biosciences
13.11 Biocatalysts
13.12 Enzyme Innovation (A Subsidiary of Specialty Enzymes and Biotechnologies)
*Details on Business Overview, Products Offered, Recent Developments, SWOT Analysis, MnM View Might Not Be Captured in Case of Unlisted Companies.
14 Appendix (Page No. - 162)
14.1 Discussion Guide
14.2 Knowledge Store: Marketsandmarkets’ Subscription Portal
14.3 Introducing RT: Real-Time Market Intelligence
14.4 Available Customizations
14.5 Related Reports
14.6 Author Details
List of Tables (132 Tables)
Table 1 Currency Conversion
Table 2 Major Product and Process Developments in Brewing Enzymes Industry
Table 3 GDP Growth of Emerging Countries, 2014–2015
Table 4 Market Size For Brewing Enzymes, By Type, 2016–2023 (USD Million)
Table 5 Market Size For Brewing Enzymes, By Type, 2016–2023 (Ton)
Table 6 Brewing Amylase Market Size, By Region, 2016–2023 (USD Million)
Table 7 Brewing Amylase Market Size, By Region, 2016–2023 (Ton)
Table 8 Brewing Beta-Glucanase Market Size, By Region, 2016–2023 (USD Million)
Table 9 Brewing Beta-Glucanase Market Size, By Region, 2016–2023 (Ton)
Table 10 Brewing Protease Market Size, By Region, 2016–2023 (USD Million)
Table 11 Brewing Protease Market Size, By Region, 2016–2023 (Ton)
Table 12 Brewing Xylanase Market Size, By Region, 2016–2023 (USD Million)
Table 13 Brewing Xylanase Market Size, By Region, 2016–2023 (Ton)
Table 14 Other Brewing Enzymes Market Size, By Region, 2016–2023 (USD Million)
Table 15 Other Brewing Enzymes Market Size, By Region, 2016–2023 (Ton)
Table 16 Brewing Enzymes Market Size, By Application, 2016–2023 (USD Million)
Table 17 Market Size, By Application, 2016–2023 (Ton)
Table 18 Market Size for Beer, By Region, 2016–2023 (USD Million)
Table 19 Market Size for Beer, By Region, 2016–2023 (Ton)
Table 20 Market Size for Wine, By Region, 2016–2023 (USD Million)
Table 21 Market Size for Wine, By Region, 2016–2023 (Ton)
Table 22 Market Size For Brewing Enzymes, By Source, 2016–2023 (USD Million)
Table 23 Market Size For Brewing Enzymes, By Source, 2016–2023 (Ton)
Table 24 Microbial: Brewing Enzymes Market Size, By Region, 2016–2023 (USD Million)
Table 25 Microbial: Market Size, By Region, 2016–2023 (Ton)
Table 26 Plant: Market Size For Brewing Enzymes, By Region, 2016–2023 (USD Million)
Table 27 Plant: Market Size For Brewing Enzymes, By Region, 2016–2023 (Ton)
Table 28 Brewing Enzymes Market Size, By Form, 2016–2023 (USD Million)
Table 29 Market Size, By Form, 2016–2023 (Ton)
Table 30 Liquid: Market Size For Brewing Enzymes, By Region, 2016–2023 (USD Million)
Table 31 Liquid: Market Size For Brewing Enzymes, By Region, 2016–2023 (Ton)
Table 32 Powder: Brewing Enzymes Market Size, By Region, 2016–2023 (USD Million)
Table 33 Powder: Market Size, By Region, 2016–2023 (Ton)
Table 34 Mashing: Ideal Temperatures
Table 35 Market Size For Brewing Enzymes, By Region, 2016–2023 (USD Million)
Table 36 Market Size For Brewing Enzymes, By Region, 2016–2023 (Ton)
Table 37 North America: Brewing Enzymes Market Size, By Country, 2016–2023 (USD Million)
Table 38 North America: Market Size, By Country, 2016–2023 (Ton)
Table 39 North America: Market Size For Brewing Enzymes, By Type, 2016–2023 (USD Million)
Table 40 North America: Market Size For Brewing Enzymes, By Type, 2016–2023 (Ton)
Table 41 North America: Brewing Enzymes Market Size, By Application, 2016–2023 (USD Million)
Table 42 North America: Market Size, By Application, 2016–2023 (Ton)
Table 43 North America: Market Size For Brewing Enzymes, By Source, 2016–2023 (USD Million)
Table 44 North America: Market Size For Brewing Enzymes, By Source, 2016–2023 (Ton)
Table 45 North America: Market Size, By Form, 2016–2023 (USD Million)
Table 46 North America: Market Size, By Form, 2016–2023 (Ton)
Table 47 US: Market Size For Brewing Enzymes, By Type, 2016–2023 (USD Million)
Table 48 US: Market Size For Brewing Enzymes, By Type, 2016–2023 (Ton)
Table 49 Canada: Brewing Enzymes Market Size, By Type, 2016–2023 (USD Million)
Table 50 Canada: Market Size, By Type, 2016–2023 (Ton)
Table 51 Mexico: Market Size For Brewing Enzymes, By Type, 2016–2023 (USD Million)
Table 52 Mexico: Market Size For Brewing Enzymes, By Type, 2016–2023 (Ton)
Table 53 Europe: Brewing Enzymes Market Size, By Country, 2016–2023 (USD Million)
Table 54 Europe:Market Size, By Country, 2016–2023 (Ton)
Table 55 Europe: Market Size For Brewing Enzymes, By Type, 2016–2023 (USD Million)
Table 56 Europe: Market Size For Brewing Enzymes, By Type, 2016–2023 (Ton)
Table 57 Europe: Brewing Enzymes Market Size, By Application, 2016–2023 (USD Million)
Table 58 Europe: Market Size, By Application, 2016–2023 (Ton)
Table 59 Europe: Market Size For Brewing Enzymes, By Source, 2016–2023 (USD Million)
Table 60 Europe: Market Size For Brewing Enzymes, By Source, 2016–2023 (Ton)
Table 61 Europe: Brewing Enzymes Market Size, By Form, 2016–2023 (USD Million)
Table 62 Europe: Market Size, By Form, 2016–2023 (Ton)
Table 63 Spain: Market Size For Brewing Enzymes, By Type, 2016–2023 (USD Million)
Table 64 Spain: Market Size For Brewing Enzymes, By Type, 2016–2023 (Ton)
Table 65 France: Brewing Enzymes Market Size, By Type, 2016–2023 (USD Million)
Table 66 France: Market Size, By Type, 2016–2023 (Ton)
Table 67 Italy: Market Size For Brewing Enzymes, By Type, 2016–2023 (USD Million)
Table 68 Italy: Market Size For Brewing Enzymes, By Type, 2016–2023 (Ton)
Table 69 UK: Brewing Enzymes Market Size, By Type, 2016–2023 (USD Million)
Table 70 UK: Market Size, By Type, 2016–2023 (Ton)
Table 71 Germany: Market Size For Brewing Enzymes, By Type, 2016–2023 (USD Million)
Table 72 Germany: Market Size For Brewing Enzymes, By Type, 2016–2023 (Ton)
Table 73 Netherlands: Brewing Enzymes Market Size, By Type, 2016–2023 (USD Million)
Table 74 Netherlands: Market Size, By Type, 2016–2023 (Ton)
Table 75 Rest of Europe: Market Size For Brewing Enzymes, By Type, 2016–2023 (USD Million)
Table 76 Rest of Europe: Market Size For Brewing Enzymes, By Type, 2016–2023 (Ton)
Table 77 Asia Pacific: Brewing Enzymes Market Size, By Country, 2016–2023 (USD Million)
Table 78 Asia Pacific: Market Size, By Country, 2016–2023 (Ton)
Table 79 Asia Pacific: Market Size For Brewing Enzymes, By Type, 2016–2023 (USD Million)
Table 80 Asia Pacific: Market Size For Brewing Enzymes, By Type, 2016–2023 (Ton)
Table 81 Asia Pacific: Brewing Enzymes Market Size, By Application, 2016–2023 (USD Million)
Table 82 Asia Pacific: Market Size, By Application, 2016–2023 (Ton)
Table 83 Asia Pacific: Market Size For Brewing Enzymes, By Source, 2016–2023 (USD Million)
Table 84 Asia Pacific: Market Size For Brewing Enzymes, By Source, 2016–2023 (Ton)
Table 85 Asia Pacific: Brewing Enzymes Market Size, By Form, 2016–2023 (USD Million)
Table 86 Asia Pacific: Market Size, By Form, 2016–2023 (Ton)
Table 87 China: Market Size For Brewing Enzymes, By Type, 2016–2023 (USD Million)
Table 88 China: Market Size For Brewing Enzymes, By Type, 2016–2023 (Ton)
Table 89 Japan: Brewing Enzymes Market Size, By Type, 2016–2023 (USD Million)
Table 90 Japan: Market Size, By Type, 2016–2023 (Ton)
Table 91 Vietnam: Brewing Enzymes Market Size, By Type, 2016–2023 (USD Million)
Table 92 Vietnam: Market Size For Brewing Enzymes, By Type, 2016–2023 (Ton)
Table 93 Australia: Market Size For Brewing Enzymes, By Type, 2016–2023 (USD Million)
Table 94 Australia: Brewing Enzymes Market Size, By Type, 2016–2023 (Ton)
Table 95 New Zealand: Brewing Enzymes Market Size, By Type, 2016–2023 (USD Million)
Table 96 New Zealand: Market Size, By Type, 2016–2023 (Ton)
Table 97 Rest of Asia Pacific: Market Size For Brewing Enzymes, By Type, 2016–2023 (USD Million)
Table 98 Rest of Asia Pacific: Market Size For Brewing Enzymes, By Type, 2016–2023 (Ton)
Table 99 South America: Brewing Enzymes Market Size, By Country, 2016–2023 (USD Million)
Table 100 South America: Market Size, By Country, 2016–2023 (Ton)
Table 101 South America: Market Size For Brewing Enzymes, By Type, 2016–2023 (USD Million)
Table 102 South America: Market Size For Brewing Enzymes, By Type, 2016–2023 (Ton)
Table 103 South America: Brewing Enzymes Market Size, By Application, 2016–2023 (USD Million)
Table 104 South America: Market Size, By Application, 2016–2023 (Ton)
Table 105 South America: Market Size For Brewing Enzymes, By Source, 2016–2023 (USD Million)
Table 106 South America: Market Size For Brewing Enzymes, By Form, 2016–2023 (Ton)
Table 107 South America: Brewing Enzymes Market Size, By Form, 2016–2023 (USD Million)
Table 108 South America: Market Size, By Form, 2016–2023 (Ton)
Table 109 Brazil: Market Size For Brewing Enzymes, By Type, 2016–2023 (USD Million)
Table 110 Brazil: Market Size For Brewing Enzymes, By Type, 2016–2023 (Ton)
Table 111 Argentina: Brewing Enzymes Market Size, By Type, 2016–2023 (USD Million)
Table 112 Argentina: Market Size, By Type, 2016–2023 (Ton)
Table 113 Rest of South America: Market Size For Brewing Enzymes, By Type, 2016–2023 (USD Million)
Table 114 Rest of South America: Market Size For Brewing Enzymes, By Type, 2016–2023 (Ton)
Table 115 RoW: Brewing Enzymes Market Size, By Country/Region, 2016–2023 (USD Million)
Table 116 RoW: Market Size, By Country/Region, 2016–2023 (Ton)
Table 117 RoW: Market Size For Brewing Enzymes, By Type, 2016–2023 (USD Million)
Table 118 RoW: Market Size For Brewing Enzymes, By Type, 2016–2023 (Ton)
Table 119 RoW: Brewing Enzymes Market Size, By Application, 2016–2023 (USD Million)
Table 120 RoW: Market Size, By Application, 2016–2023 (Ton)
Table 121 RoW: Market Size For Brewing Enzymes, By Source, 2016–2023 (USD Million)
Table 122 RoW: Market Size For Brewing Enzymes, By Source, 2016–2023 (Ton)
Table 123 RoW: Brewing Enzymes Market Size, By Form, 2016–2023 (USD Million)
Table 124 RoW: Market Size, By Form, 2016–2023 (Ton)
Table 125 South Africa: Market Size For Brewing Enzymes, By Type, 2016–2023 (USD Million)
Table 126 South Africa: Market Size For Brewing Enzymes, By Type, 2016–2023 (Ton)
Table 127 Middle East & Rest of Africa: Brewing Enzymes Market Size, By Type, 2016–2023 (USD Million)
Table 128 Middle East & Rest of Africa: Market Size, By Type, 2016–2023 (Ton)
Table 129 Expansions & Investments, 2013–2018
Table 130 New Product Launches, 2013–2018
Table 131 Mergers & Acquisitions, 2013–2018
Table 132 Partnerships & Agreements, 2013–2018
List of Figures (47 Figures)
Figure 1 Market Segmentation
Figure 2 Brewing Enzymes Market, Regional Scope
Figure 3 Brewing Enzymes Market: Research Design
Figure 4 Breakdown of Primary Interviews: By Company Type, Designation, and Region
Figure 5 Market Size Estimation: Bottom-Up Approach
Figure 6 Market Size Estimation Methodology: Top-Down Approach
Figure 7 Data Triangulation
Figure 8 Brewing Enzymes Market Size, By Type, 2018 vs 2023
Figure 9 Market Size, By Form, 2018 vs 2023
Figure 10 Market Size, By Region, 2017 (USD Million)
Figure 11 Growing Consumption of Beer Across the Globe Likely to Drive the Market Growth for Brewing Enzymes
Figure 12 Beta-Glucanase to Grow at the Highest Rate Between 2018 and 2023
Figure 13 Liquid Segment Estimated to Dominate the Market in Terms of Value Across All Regions in 2018
Figure 14 China Dominated the Asia Pacific Market in 2017
Figure 15 Asia Pacific is Projected to Dominate the Market for Brewing Enzymes Through 2023
Figure 16 Brewing Enzymes Market Dynamics
Figure 17 Rise in Income to Drive the Consumption of Beer and Wine, Subsequently Driving the Enzyme Business
Figure 18 Number of Craft Breweries, in Us, 2009–2016
Figure 19 Total Beer Exports By Top Five Countries in Europe, 2016
Figure 20 Beta-Glucanase Segment Projected to Grow at the Highest CAGR Between 2018 and 2023
Figure 21 Beer Segment Projected to Grow at A Higher CAGR Between 2018 and 2023
Figure 22 Top Five Beer Producing Countries, 2016
Figure 23 Top Five Wine Producing Countries, 2015
Figure 24 Microbial Segment Dominated the Global Market Throughout the Forecast Period
Figure 25 Liquid Form Dominated the Brewing Enzymes Market in 2017
Figure 26 North American Beer Production, By Country, 2016
Figure 27 North America: Market Snapshot
Figure 28 Top Ten Beer Producing Countries in Europe, 2016
Figure 29 Per Capita Beer Consumption, 2016
Figure 30 Total Beer Imports By Top Five Countries in Europe, 2016
Figure 31 Total Beer Exports By Top Five Countries in Europe, 2016
Figure 32 Number of Breweries and Microbreweries in Major Countries in Europe, 2016
Figure 33 Asia Pacific: Market Snapshot
Figure 34 Key Developments By Leading Players in the Brewing Enzymes Market, 2013–2018
Figure 35 Number of Developments, 2015–2018
Figure 36 Novozymes: Company Snapshot
Figure 37 Novozymes: SWOT Analysis
Figure 38 DSM: Company Snapshot
Figure 39 DSM: SWOT Analysis
Figure 40 Dowdupont: Company Snapshot
Figure 41 Dowdupont: SWOT Analysis
Figure 42 Chr. Hansen: Company Snapshot
Figure 43 Chr. Hansen: SWOT Analysis
Figure 44 Associated British Food: Company Snapshot
Figure 45 Associated British Foods : SWOT Analysis
Figure 46 Kerry Group: Company Snapshot
Figure 47 Brenntag: Company Snapshot


Growth opportunities and latent adjacency in Brewing Enzymes Market