Blue Ammonia Market by Technology (Steam Methane Reforming, Autothermal Reforming, Gas Partial Oxidation), End-Use Application (Transportation, Power Generation, Industrial Feedstock) Region (North America, Europe, Asia Pacific) -Global Forecast to 2030
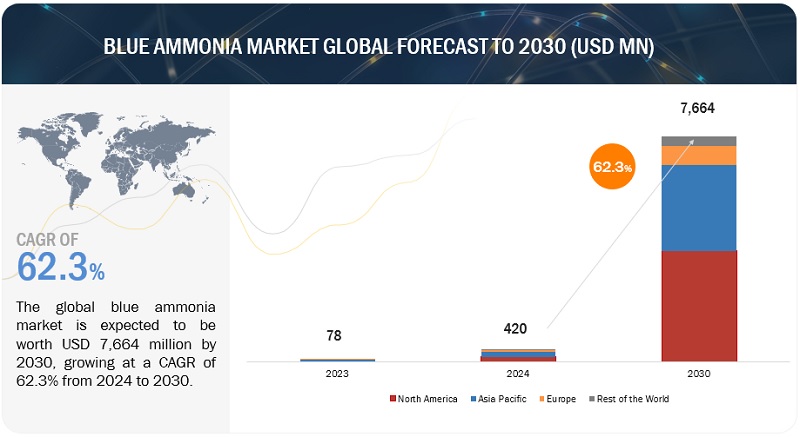
[173 Pages Report] The global Blue Ammonia Market size was valued at USD 78 million in 2023 and to reach USD 7,664 million by 2030, growing at a compound annual growth rate (CAGR) of 62.3% from 2023 to 2030. Blue ammonia demand has increased in recent years as a result of increased government focus on establishing blue ammonia-based economies and investment in blue ammonia infrastructure. The market for blue ammonia is expected to benefit significantly from the increased use of low-emission fuel.
To know about the assumptions considered for the study, Request for Free Sample Report
To know about the assumptions considered for the study, download the pdf brochure
Blue ammonia Market Dynamics
Driver: Increasing efforts toward empowering hydrogen economy
The use of hydrogen gas as a principal energy source in power generation, transportation, and industrial activities is part of the transition to a hydrogen economy. This development is motivated by the desire to reduce greenhouse gas emissions and reliance on fossil fuels while addressing climate change problems. Blue ammonia is an intriguing fuel for the transition to a hydrogen economy. Because of its minimal carbon emissions and many applications, blue ammonia is gaining traction as a potential clean energy carrier and fuel source. Blue ammonia is produced by absorbing carbon dioxide emissions from industrial operations and using them to synthesis ammonia, resulting in a more sustainable alternative to traditional ammonia manufacturing..
Many countries are investigating the potential of hydrogen as a clean energy carrier and implementing decarbonization strategies in a variety of industries, including transportation and power generation. Blue ammonia has various advantages in the context of the hydrogen economy. It can be efficiently stored and transferred, making it appropriate for long-distance energy delivery. Its adaptability and ability to reduce carbon emissions make it a promising alternative for solving climate change concerns and reaching sustainable energy goals. The production, distribution, and consumption of blue ammonia are predicted to expand as the shift to a hydrogen-based economy gains traction..
Restraint: High cost of blue ammonia
The high cost of blue ammonia is one of the main challenges to its commercialization. Several factors contribute to the high cost of blue ammonia. Some of them are listed below.
The cost of CCS: The cost of CCS is a significant factor in the high cost of blue ammonia. CCS is a relatively new technology, and the cost of CCS is significantly high at present. As the technology matures, the cost of CCS is expected to decrease.
The cost of natural gas: Natural gas is another factor contributing to the high cost of blue ammonia. Natural gas is the most common feedstock for producing ammonia, and the cost of natural gas can vary significantly depending on the location and the market.
The cost of transportation: Transportation is also an important factor contributing to the high cost of blue ammonia. Ammonia is a hazardous substance, and it requires specialized transportation equipment. The cost of transporting ammonia can be significant, especially over long distances.
Opportunities: Growing demand for blue ammonia to generate power
Various governments are expected to promote blue ammonia programmes in the future years. It is difficult to develop the best net-zero CO2 emissions approach, including the most effective green blue ammonia strategy. There are decarbonization choices for most applications and end uses, and the relative costs and benefits of each solution are expected to fluctuate over time, depending on the rate of innovation and technical developments. As a result, governments from many nations are investigating technology that are most appropriate for their country while avoiding multiple possible hazards, such as locking in slower or less efficient carbon reduction pathways. As a result, a stronger blue ammonia economy is predicted to provide profitable growth opportunities for the blue ammonia storage tanks and transportation markets.
Challenges: Limited awareness about blue ammonia within specific industries
Blue ammonia was a relatively new concept for chemical manufacturers before 2021. Although technology is slowly gaining attention, and several research activities are going on in this field after 2021, it is likely to take some time to gain widespread attention and become well-documented in public sources.
At the R&D stage, blue ammonia, especially when integrated into a carbon capture and storage (CCS) process, involves complex engineering and technological challenges. Companies and organizations involved in blue ammonia research and development may have proprietary rights over certain technical aspects, leading to limited public disclosures. Hence, commercial-scale projects are not widely implemented or publicly reported.
Additionally, detailed information about blue ammonia is more prevalent within specialized industries and research communities involved in ammonia production, hydrogen technology, carbon capture, and energy transition. Thus, knowledge is limited to specific sectors, including transportation and power generation.
Furthermore, regulatory frameworks and policies related to carbon capture and storage, hydrogen and ammonia production processes are country- or region-specific, affecting the dissemination of information on blue ammonia.
Blue ammonia Market Ecosystem
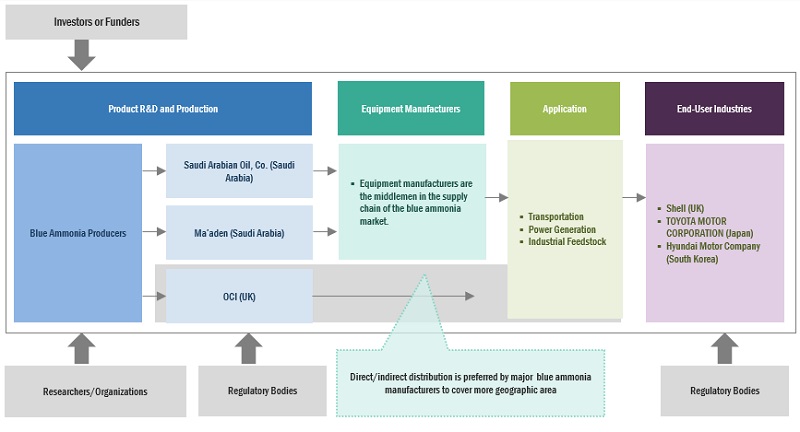
Market has some prominent blue ammonia companies which include well-established, financially stable blue ammonia manufacturers. These companies have been operating in the market for several years and possess a diversified product portfolio, state-of-the-art technologies, and strong global sales and marketing networks. Key players in this market include Yara International ASA (Norway), Saudi Arabian Oil Co. (Saudi Arabia), OCI (UK), Ma’aden (Saudi Arabia), and CF Industries Holdings, Inc. (US).
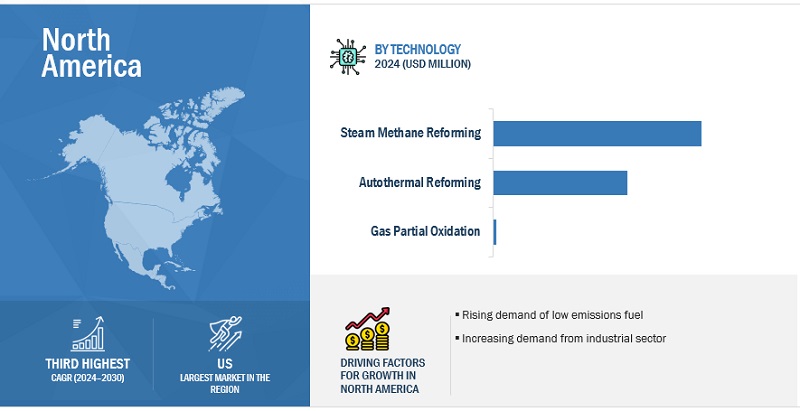
The steam methane reforming, by technology, is expected to be the largest segment during the forecast period.
This report segments the blue ammonia market based on technology into three segment: steam methane reforming, autothermal reforming and gas partial oxidation. Because it is a cost-effective and energy-efficient method of manufacturing pure hydrogen, steam methane reforming leads the market, with the largest market share and the highest growth rate.
By end-use application, the industrial feedstock is expected to be the fastest growing during the forecast period
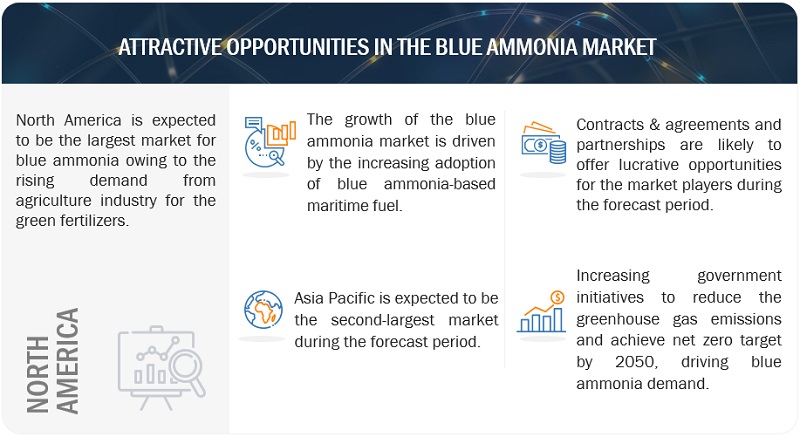
This report segments the blue ammonia market based on application into four segments: transportation, power generation and industrial feedstock. The industrial feedstock is expected to grow at the fastest rate during the forecast period. The fertilizers industry is among the largest sources of CO2 emissions, and the use of blue ammonia could help decrease these emissions while still meeting the demand for fertilizers. Governments and food companies worldwide are endorsing the demand for eco-friendly fertilizers, which are likely to be gradually adopted to minimize emissions from the agriculture sector.
North America is expected to be the largest region in the blue ammonia market
North America is expected to be the largest blue ammonia market during the forecast period. Blue ammonia is viewed as a viable solution to the climate emergency due to its cleaner production process. It is versatile and finds applications in fuel cells, maritime operations, and fertilizer production. With the increasing demand for blue ammonia, there is a high probability of establishing more projects in North America and across the world. Policies are also enforced to propel research and development and encourage the use of clean fuels for energy. Utilities are going through a significant operational shift, including decentralization, digitalization, and decarbonization. On a large scale, renewable energy is used for power generation.
Key Market Players
The market is dominated by a few major players that have a wide regional presence. The major players in the blue ammonia market include Yara International ASA (Norway), Saudi Arabian Oil Co. (Saudi Arabia), OCI (UK), Ma’aden (Saudi Arabia), and CF Industries Holdings, Inc. (US). Between 2019 and 2023, these blue ammonia companies followed strategies such as contracts, agreements, partnerships, mergers, acquisitions, and expansions to capture a larger share of the market.
Scope of the report
|
Report Metric |
Details |
|
Market size available for years |
2022–2030 |
|
Base year considered |
2022 |
|
Forecast period |
2024–2030 |
|
Forecast units |
Value (USD Million); Value (Kilotons) |
|
Segments covered |
Blue ammonia market by technology, end-use application and region. |
|
Geographies covered |
Asia Pacific, North America, Europe, and Rest of the World |
|
Companies covered |
Yara International (Norway), Saudi Arabian Oil Co. (Saudi Arabia), OCI (UK), CF Industries Holdings, Inc. (US), QATAR FERTILISER COMPANY (QAFCO) (Qatar), Ma’aden (Saudi Arabia), Shell (England), ExxonMobil Corporation (US), LSB Industries (US), ITOCHU Corporation (Japan), Técnicas Reunidas S. A. (Spain), PAO NOVATEK (Russia), ADNOC Group (UAE), Linde plc (Ireland), Equinor ASA (Norway), EuroChem Group (Switzerland), Uniper SE (Germany), Hydrofuel Canada Inc. (Canada), Dastur Energy (US), Nutrien Ltd. (Canada) |
This research report categorizes the market by type, portability, application, and region.
On the basis of technology, the blue ammonia market has been segmented as follows:
- Steam methane reforming
- Autothermal reforming
- Gas partial oxidation
On the basis of application, the market has been segmented as follows:
- Transportation
- Power Generation
- Industrial Feedstock
On the basis of region, the market has been segmented as follows:
- Asia Pacific
- Europe
- North America
- Rest of the World
Recent Developments
- In June 2023, Yara International ASA and BASF collaborated to develop and build a world-scale low-carbon blue ammonia production facility with carbon capture in the Gulf Coast region of the United States. To meet the expanding worldwide demand for low-carbon ammonia, the companies are investigating the possibility of a facility with a total capacity of 1.2 to 1.4 million tons annually.
- In April 2023, Saudi Aramco successfully transported the first shipment of blue ammonia to Japan through a collaborative effort involving multiple parties across the low-carbon ammonia value chain. SABIC Agri-Nutrients used Aramco's feedstock to generate the ammonia, which was then sold to Fuji Oil Company by Aramco Trading Company. Mitsui O.S.K. Lines was responsible for the liquid's transportation to Japan, where it was transferred to the Sodegaura Refinery for co-fired power generation with technical support from Japan Oil Engineering Co.
- In March 2023, Linde plc, a global industrial gases and engineering company, and OCI, a global producer and distributor of hydrogen-based products, signed a long-term agreement under which Linde will supply clean hydrogen and nitrogen to OCI's new blue ammonia facility under construction in Texas, US.
- In March 2023, Mitsui & Co., Ltd., a prominent global ammonia marketer, and CF Industries Holdings, Inc., the largest ammonia producer, announced their collaborative plan to develop a greenfield ammonia production facility in the United States. The newly established facility will produce blue ammonia using carbon capture and sequestration techniques, reducing carbon emissions by over 60% rather than using traditional ammonia production methods.
- In December 2022, OCI revealed its intention to construct the biggest blue ammonia facility in Texas. OCI entirely owns the project, and it will require an investment of approximately USD 1 billion. This sum includes expenses for enlarged utilities and available land, which will allow for a potential doubling of the facility's capacity to 2.2 mtpa in the future.
Frequently Asked Questions (FAQ):
What is the current size of the blue ammonia market?
The current market size of the blue ammonia market is 46 million in 2022.
What are the major drivers for the blue ammonia market?
Increasing regulations concerning GHG emissions will be major drivers for the blue ammonia market.
Which is the largest region during the forecasted period in the blue ammonia market?
North America is expected to dominate the blue ammonia market between 2023–2030, followed by Europe and Asia Pacific. The increase in demand of blue ammonia from the industrial sector in recent years is driving the region's market.
Which is the largest segment, by end-use application, during the forecasted period in the blue ammonia market?
Industrial feedstock is expected to be the largest market during the forecast period. Increased demand for low carbon fertilizer due to the increasing investments in renewable energy sources are expected to drive the market for the industrial feedstock blue ammonia segment.
Which is the fastest technology segment during the forecasted period in the blue ammonia market?
The steam methane reforming segment is expected to be the fastest market during the forecast period. The increasing investment in advancing blue ammonia technologiess to meet the blue ammonia demand used in consumer automotive, chemical & refinery etc. would drive the blue ammonia market.
To speak to our analyst for a discussion on the above findings, click Speak to Analyst


- 5.1 INTRODUCTION
-
5.2 MARKET DYNAMICSDRIVERS- Growing focus on reducing greenhouse gas emissions- Increasing efforts toward empowering hydrogen economy- Rising demand for eco-friendly fertilizers- Increasing government investments in commercialization of emission control technologiesRESTRAINTS- High cost associated with infrastructure set up for blue ammonia productionOPPORTUNITIES- Potential of blue ammonia as maritime fuel- Growing demand for blue ammonia to generate powerCHALLENGES- Limited awareness about blue ammonia within specific industries
-
5.3 TRENDS/DISRUPTIONS IMPACTING CUSTOMER BUSINESSREVENUE SHIFT AND NEW REVENUE POCKETS FOR PROVIDERS OF BLUE AMMONIA
-
5.4 SUPPLY CHAIN ANALYSISTECHNOLOGY PROVIDERS AND EPC CONTRACTORSFEEDSTOCK SUPPLIERSBLUE HYDROGEN SUPPLIERSBLUE AMMONIA PRODUCERSEND USERS
- 5.5 MARKET MAPPING
-
5.6 TECHNOLOGY ANALYSISRECENT ADVANCEMENTS IN BLUE AMMONIA PRODUCTION PROCESS
-
5.7 PATENT ANALYSISLIST OF MAJOR PATENTS
-
5.8 TARIFF AND REGULATORY FRAMEWORKREGULATORY BODIES, GOVERNMENT AGENCIES, AND OTHER ORGANIZATIONSREGULATORY FRAMEWORK
- 5.9 KEY CONFERENCES AND EVENTS, 2023–2024
-
5.10 TRADE ANALYSISHS CODE 2814- Export scenario- Import scenarioHS CODE 280410- Export scenario- Import scenario
-
5.11 PRICING ANALYSISAVERAGE LEVELIZED COST, BY REGION
-
5.12 CASE STUDY ANALYSISQATARENERGY PLANS TO BUILD BLUE AMMONIA PRODUCTION FACILITY TO PROMOTE USE OF CLEAN FUEL AND REDUCE GHG EMISSIONS
-
5.13 PORTER'S FIVE FORCES ANALYSISTHREAT OF SUBSTITUTESBARGAINING POWER OF SUPPLIERSBARGAINING POWER OF BUYERSTHREAT OF NEW ENTRANTSINTENSITY OF COMPETITIVE RIVALRY
-
5.14 KEY STAKEHOLDERS AND BUYING CRITERIAKEY STAKEHOLDERS IN BUYING PROCESSBUYING CRITERIA
- 6.1 INTRODUCTION
-
6.2 STEAM METHANE REFORMINGACCELERATING USE OF SMR TECHNOLOGY IN CHEMICAL AND INDUSTRIAL PLANTS TO DRIVE MARKET
-
6.3 AUTOTHERMAL REFORMINGRISING ADOPTION OF ATR TECHNOLOGY IN BLUE AMMONIA PLANTS TO CREATE OPPORTUNITIES FOR MARKET PLAYERS
-
6.4 GAS PARTIAL OXIDATIONINCREASING DEMAND FOR GAS PARTIAL OXIDATION TECHNOLOGY IN ENERGY SECTOR TO FUEL MARKET GROWTH
- 7.1 INTRODUCTION
-
7.2 POWER GENERATIONSIGNIFICANT DEMAND FROM COUNTRIES LACKING RENEWABLE ENERGY INFRASTRUCTURE TO DRIVE SEGMENTAL GROWTH
-
7.3 TRANSPORTATIONPOTENTIAL OF BLUE AMMONIA AS FUEL IN MARINE SHIPPING AND RAIL TRANSPORTATION TO CREATE SIGNIFICANT GROWTH OPPORTUNITIES
-
7.4 INDUSTRIAL FEEDSTOCKCUSTOMER WILLINGNESS TO PAY FOR GREENER ALTERNATIVES TO BOOST DEMAND FOR BLUE AMMONIA IN INDUSTRIAL SECTOR
- 8.1 INTRODUCTION
-
8.2 NORTH AMERICARECESSION IMPACT: NORTH AMERICABY TECHNOLOGYBY END-USE APPLICATIONBY COUNTRY- US- Canada
-
8.3 EUROPERECESSION IMPACT: EUROPEBY TECHNOLOGYBY END-USE APPLICATIONBY COUNTRY- UK- France- Netherlands- Norway- Rest of Europe
-
8.4 ASIA PACIFICRECESSION IMPACT: ASIA PACIFICBY TECHNOLOGYBY END-USE APPLICATIONBY COUNTRY- Japan- South Korea- China- Australia- Rest of Asia Pacific
-
8.5 REST OF THE WORLD (ROW)RECESSION IMPACT: ROWBY TECHNOLOGYBY END-USE APPLICATIONBY COUNTRY- Saudi Arabia- UAE- Other countries

- 9.1 OVERVIEW
- 9.2 INDUSTRY CONCENTRATION OF KEY PLAYERS, 2022
-
9.3 COMPANY EVALUATION FRAMEWORK
- 9.4 SEGMENTAL REVENUE ANALYSIS OF TOP 5 COMPANIES
-
9.5 EVALUATION MATRIX FOR KEY COMPANIES, 2022STARSEMERGING LEADERSPERVASIVE PLAYERSPARTICIPANTSCOMPANY FOOTPRINT
-
9.6 EVALUATION MATRIX FOR STARTUPS/SMES, 2022PROGRESSIVE COMPANIESRESPONSIVE COMPANIESDYNAMIC COMPANIESSTARTING BLOCKSCOMPETITIVE BENCHMARKING
-
9.7 RECENT DEVELOPMENTSDEALSOTHERS
-
10.1 BLUE AMMONIA PRODUCERSYARA INTERNATIONAL ASA- Business overview- Products/Services/Solutions offered- Recent developments- MnM viewSAUDI ARABIAN OIL CO.- Business overview- Products/Services/Solutions offered- Recent developments- MnM viewOCI- Business overview- Products/Services/Solutions offered- Recent developments- MnM viewCF INDUSTRIES HOLDINGS, INC.- Business overview- Products/Services/Solutions offered- Recent developments- MnM viewMA’ADEN- Business overview- Products/Services/Solutions offered- Recent developments- MnM viewQATAR FERTILISER COMPANY (QAFCO)- Business overview- Products/Services/Solutions offered- Recent developmentsSHELL PLC- Business overview- Products/Services/Solutions offered- Recent developmentsEXXONMOBIL CORPORATION- Business overview- Products/Services/Solutions offered- Recent developmentsLINDE PLC- Business overview- Products/Services/Solutions offered- Recent developmentsNUTRIEN LTD.- Business overview- Products/Services/Solutions offered- Recent developmentsUNIPER SE- Business overview- Products/Services/Solutions offered- Recent developmentsADNOC GROUP- Business overview- Products/Services/Solutions offeredLSB INDUSTRIES- Business overview- Products/Services/Solutions offered
-
10.2 OTHER BLUE AMMONIA PRODUCERSEUROCHEM GROUPITOCHU CORPORATIONTÉCNICAS REUNIDAS S.A.PAO NOVATEK
-
10.3 TECHNOLOGY PROVIDERSKBR INC.- Business overview- Products/Services/Solutions offeredTOPSOE- Business overview- Products/Services/Solutions offeredTHYSSENKRUPP UHDE GMBH
-
10.4 EPC COMPANIESTECHNIP ENERGIES N.V.- Business overview- Products/Services/Solutions offeredMAIRETECNIMONT S.P.A.- Business overview- Products/Services/Solutions offeredSAIPEM- Business overview- Products/Services/Solutions offered
- 11.1 INSIGHTS FROM INDUSTRY EXPERTS
- 11.2 DISCUSSION GUIDE
- 11.3 KNOWLEDGESTORE: MARKETSANDMARKETS’ SUBSCRIPTION PORTAL
- 11.4 CUSTOMIZATION OPTIONS
- 11.5 RELATED REPORTS
- 11.6 AUTHOR DETAILS
- TABLE 1 BLUE AMMONIA MARKET SNAPSHOT
- TABLE 2 ROLE OF KEY COMPANIES IN BLUE AMMONIA ECOSYSTEM
- TABLE 3 BLUE AMMONIA: INNOVATIONS AND PATENT REGISTRATIONS, JULY 2020–MARCH 2023
- TABLE 4 NORTH AMERICA: LIST OF REGULATORY BODIES, GOVERNMENT AGENCIES, AND OTHER ORGANIZATIONS
- TABLE 5 EUROPE: LIST OF REGULATORY BODIES, GOVERNMENT AGENCIES, AND OTHER ORGANIZATIONS
- TABLE 6 ASIA PACIFIC: LIST OF REGULATORY BODIES, GOVERNMENT AGENCIES, AND OTHER ORGANIZATIONS
- TABLE 7 MARKET: REGULATORY FRAMEWORK
- TABLE 8 LIST OF KEY CONFERENCES AND EVENTS IN MARKET, 2023–2024
- TABLE 9 EXPORT SCENARIO FOR HS CODE 2814, BY COUNTRY, 2020–2022 (USD)
- TABLE 10 IMPORT SCENARIO FOR HS CODE 2814, BY COUNTRY, 2020–2022 (USD)
- TABLE 11 EXPORT SCENARIO FOR HS CODE 280410, BY COUNTRY, 2020–2022 (USD)
- TABLE 12 IMPORT SCENARIO FOR HS CODE 280410, BY COUNTRY, 2020–2022 (USD)
- TABLE 13 BLUE AMMONIA AVERAGE PRICE PER TON, BY REGION
- TABLE 14 BLUE AMMONIA MARKET: PORTER'S FIVE FORCES ANALYSIS
- TABLE 15 INFLUENCE OF STAKEHOLDERS ON BUYING PROCESS FOR TOP 3 END-USE APPLICATIONS (%)
- TABLE 16 KEY BUYING CRITERIA FOR TOP 3 END-USE APPLICATIONS
- TABLE 17 BLUE AMMONIA MARKET, BY TECHNOLOGY, 2022–2030 (USD MILLION)
- TABLE 18 MARKET, BY END-USE APPLICATION, 2022–2030 (USD MILLION)
- TABLE 19 MARKET, BY END-USE APPLICATION, 2022–2030 (KILOTONS)
- TABLE 20 POWER GENERATION: BLUE AMMONIA MARKET, BY REGION, 2022–2030 (USD MILLION)
- TABLE 21 POWER GENERATION: AMMONIA MARKET, BY REGION, 2022–2030 (KILOTONS)
- TABLE 22 TRANSPORTATION: AMMONIA MARKET, BY REGION, 2022–2030 (USD MILLION)
- TABLE 23 TRANSPORTATION: AMMONIA MARKET, BY REGION, 2022–2030 (KILOTONS)
- TABLE 24 INDUSTRIAL FEEDSTOCK: MARKET, BY REGION, 2022–2030 (USD MILLION)
- TABLE 25 INDUSTRIAL FEEDSTOCK: MARKET, BY REGION, 2022–2030 (KILOTONS)
- TABLE 26 MARKET, BY REGION, 2022–2030 (KILOTONS)
- TABLE 27 BLUE AMMONIA MARKET, BY REGION, 2022–2030 (USD MILLION)
- TABLE 28 NORTH AMERICA: BLUE AMMONIA MARKET, BY TECHNOLOGY, 2022–2030 (USD MILLION)
- TABLE 29 NORTH AMERICA: Market, BY END-USE APPLICATION, 2022–2030 (USD MILLION)
- TABLE 30 NORTH AMERICA: Market, BY END-USE APPLICATION, 2022–2030 (KILOTONS)
- TABLE 31 NORTH AMERICA: Market, BY COUNTRY, 2022–2030 (USD MILLION)
- TABLE 32 NORTH AMERICA: Market, BY COUNTRY, 2022–2030 (KILOTONS)
- TABLE 33 US: Market, BY END-USE APPLICATION, 2022–2030 (USD MILLION)
- TABLE 34 CANADA: Market, BY END-USE APPLICATION, 2022–2030 (USD MILLION)
- TABLE 35 EUROPE: BLUE AMMONIA MARKET, BY TECHNOLOGY, 2022–2030 (USD MILLION)
- TABLE 36 EUROPE: Market, BY END-USE APPLICATION, 2022–2030 (USD MILLION)
- TABLE 37 EUROPE: Market, BY END-USE APPLICATION, 2022–2030 (KILOTONS)
- TABLE 38 EUROPE: Market, BY COUNTRY, 2022–2030 (USD MILLION)
- TABLE 39 EUROPE: Market, BY COUNTRY, 2022–2030 (KILOTONS)
- TABLE 40 UK: Market, BY END-USE APPLICATION, 2022–2030 (USD MILLION)
- TABLE 41 FRANCE: Market, BY END-USE APPLICATION, 2022–2030 (USD MILLION)
- TABLE 42 NETHERLANDS: Market, BY END-USE APPLICATION, 2022–2030 (USD MILLION)
- TABLE 43 NORWAY: Market, BY END-USE APPLICATION, 2022–2030 (USD MILLION)
- TABLE 44 REST OF EUROPE: Market, BY END-USE APPLICATION, 2022–2030 (USD MILLION)
- TABLE 45 ASIA PACIFIC: BLUE AMMONIA MARKET, BY TECHNOLOGY, 2022–2030 (USD MILLION)
- TABLE 46 ASIA PACIFIC: Market, BY END-USE APPLICATION, 2022–2030 (USD MILLION)
- TABLE 47 ASIA PACIFIC: Market, BY END-USE APPLICATION, 2022–2030 (KILOTONS)
- TABLE 48 ASIA PACIFIC: Market, BY COUNTRY, 2022–2030 (USD MILLION)
- TABLE 49 ASIA PACIFIC: Market, BY COUNTRY, 2022–2030 (KILOTONS)
- TABLE 50 JAPAN: Market, BY END-USE APPLICATION, 2022–2030 (USD MILLION)
- TABLE 51 SOUTH KOREA: Market, BY END-USE APPLICATION, 2022–2030 (USD MILLION)
- TABLE 52 CHINA: Market, BY END-USE APPLICATION, 2022–2030 (USD MILLION)
- TABLE 53 AUSTRALIA: Market, BY END-USE APPLICATION, 2022–2030 (USD MILLION)
- TABLE 54 REST OF ASIA PACIFIC: Market, BY END-USE APPLICATION, 2022–2030 (USD MILLION)
- TABLE 55 ROW: BLUE AMMONIA MARKET, BY TECHNOLOGY, 2022–2030 (USD MILLION)
- TABLE 56 ROW: Market, BY END-USE APPLICATION, 2022–2030 (USD MILLION)
- TABLE 57 ROW: Market, BY END-USE APPLICATION, 2022–2030 (KILOTONS)
- TABLE 58 ROW: Market, BY COUNTRY, 2022–2030 (USD MILLION)
- TABLE 59 ROW: Market, BY COUNTRY, 2022–2030 (KILOTONS)
- TABLE 60 SAUDI ARABIA: Market, BY END-USE APPLICATION, 2022–2030 (USD MILLION)
- TABLE 61 UAE: Market, BY END-USE APPLICATION, 2022–2030 (USD MILLION)
- TABLE 62 OTHER COUNTRIES: Market, BY END-USE APPLICATION, 2022–2030 (USD MILLION)
- TABLE 63 COMPANY EVALUATION FRAMEWORK, 2019–2023
- TABLE 64 TECHNOLOGY: COMPANY FOOTPRINT
- TABLE 65 END-USE APPLICATION: COMPANY FOOTPRINT
- TABLE 66 REGION: COMPANY FOOTPRINT
- TABLE 67 BLUE AMMONIA MARKET: LIST OF KEY STARTUPS/SMES
- TABLE 68 TECHNOLOGY: STARTUPS/SMES FOOTPRINT
- TABLE 69 END-USE APPLICATION: STARTUPS/SMES FOOTPRINT
- TABLE 70 REGION: STARTUPS/SMES FOOTPRINT
- TABLE 71 Market: DEALS, 2019–2023
- TABLE 72 Market: OTHERS, 2019–2023
- TABLE 73 YARA INTERNATIONAL ASA: COMPANY OVERVIEW
- TABLE 74 YARA INTERNATIONAL ASA: PRODUCT/SERVICE/SOLUTION OFFERINGS
- TABLE 75 YARA INTERNATIONAL ASA: DEALS
- TABLE 76 SAUDI ARABIAN OIL CO.: COMPANY OVERVIEW
- TABLE 77 SAUDI ARABIAN OIL CO.: PRODUCT/SERVICE/SOLUTION OFFERINGS
- TABLE 78 SAUDI ARABIAN OIL CO.: DEALS
- TABLE 79 OCI: BUSINESS OVERVIEW
- TABLE 80 OCI: PRODUCT/SERVICE/SOLUTION OFFERINGS
- TABLE 81 OCI: DEALS
- TABLE 82 OCI: OTHERS
- TABLE 83 CF INDUSTRIES HOLDINGS, INC.: COMPANY OVERVIEW
- TABLE 84 CF INDUSTRIES HOLDINGS, INC.: PRODUCT/SERVICE/SOLUTION OFFERINGS
- TABLE 85 CF INDUSTRIES HOLDINGS, INC.: DEALS
- TABLE 86 MA’ADEN: COMPANY OVERVIEW
- TABLE 87 MA’ADEN: PRODUCT/SERVICE/SOLUTION OFFERINGS
- TABLE 88 MA’ADEN: DEALS
- TABLE 89 QATAR FERTILISER COMPANY (QAFCO): COMPANY OVERVIEW
- TABLE 90 QATAR FERTILISER COMPANY (QAFCO): PRODUCT/SERVICE/SOLUTION OFFERINGS
- TABLE 91 QATAR FERTILISER COMPANY (QAFCO): DEALS
- TABLE 92 SHELL PLC: COMPANY OVERVIEW
- TABLE 93 SHELL PLC: PRODUCT/SERVICE/SOLUTION OFFERINGS
- TABLE 94 SHELL PLC: DEALS
- TABLE 95 EXXONMOBIL CORPORATION: COMPANY OVERVIEW
- TABLE 96 EXXONMOBIL CORPORATION: PRODUCT/SERVICE/SOLUTION OFFERINGS
- TABLE 97 EXXONMOBIL CORPORATION: OTHERS
- TABLE 98 LINDE PLC: COMPANY OVERVIEW
- TABLE 99 LINDE PLC: PRODUCT/SERVICE/SOLUTION OFFERINGS
- TABLE 100 LINDE PLC: OTHERS
- TABLE 101 NUTRIEN LTD.: COMPANY OVERVIEW
- TABLE 102 NUTRIEN LTD.: PRODUCT/SERVICE/SOLUTION OFFERINGS
- TABLE 103 NUTRIEN LTD.: DEALS
- TABLE 104 UNIPER SE: COMPANY OVERVIEW
- TABLE 105 UNIPER SE: PRODUCT/SERVICE/SOLUTION OFFERINGS
- TABLE 106 UNIPER SE: DEALS
- TABLE 107 ADNOC GROUP: COMPANY OVERVIEW
- TABLE 108 ADNOC GROUP: PRODUCT/SERVICE/SOLUTION OFFERINGS
- TABLE 109 LSB INDUSTRIES: COMPANY OVERVIEW
- TABLE 110 LSB INDUSTRIES: PRODUCT/SERVICE/SOLUTION OFFERINGS
- TABLE 111 KBR INC.: COMPANY OVERVIEW
- TABLE 112 KBR INC.: PRODUCT/SERVICE/SOLUTION OFFERINGS
- TABLE 113 TOPSOE: COMPANY OVERVIEW
- TABLE 114 TOPSOE: PRODUCT/SERVICE/SOLUTION OFFERINGS
- TABLE 115 TECHNIP ENERGIES N.V.: COMPANY OVERVIEW
- TABLE 116 TECHNIP ENERGIES N.V.: PRODUCT/SERVICE/SOLUTION OFFERINGS
- TABLE 117 MAIRETECNIMONT S.P.A.: COMPANY OVERVIEW
- TABLE 118 MAIRETECNIMONT S.P.A.: PRODUCT/SERVICE/SOLUTION OFFERINGS
- TABLE 119 SAIPEM: COMPANY OVERVIEW
- TABLE 120 SAIPEM: PRODUCT/SERVICE/SOLUTION OFFERINGS
- FIGURE 1 BLUE AMMONIA MARKET: RESEARCH DESIGN
- FIGURE 2 DATA TRIANGULATION
- FIGURE 3 BREAKDOWN OF PRIMARIES: BY COMPANY TYPE, DESIGNATION, AND REGION
- FIGURE 4 MARKET: BOTTOM-UP APPROACH
- FIGURE 5 MARKET: TOP-DOWN APPROACH
- FIGURE 6 METRICS CONSIDERED TO ANALYZE DEMAND FOR BLUE AMMONIA
- FIGURE 7 MARKET SIZE ESTIMATION METHODOLOGY: SUPPLY-SIDE ANALYSIS
- FIGURE 8 ASIA PACIFIC TO HOLD LARGEST SHARE OF BLUE AMMONIA MARKET IN 2024
- FIGURE 9 STEAM METHANE REFORMING SEGMENT TO ACCOUNT FOR LARGEST SHARE OF AMMONIA MARKET, BY TECHNOLOGY, IN 2030
- FIGURE 10 INDUSTRIAL FEEDSTOCK SEGMENT TO CAPTURE LARGEST SHARE OF AMMONIA MARKET, BY END-USE APPLICATION, IN 2030
- FIGURE 11 GROWING FOCUS ON REDUCING GREENHOUSE GAS EMISSIONS TO CREATE LUCRATIVE OPPORTUNITIES FOR MARKET PLAYERS
- FIGURE 12 MARKET IN NORTH AMERICA TO GROW AT HIGHEST CAGR DURING FORECAST PERIOD
- FIGURE 13 INDUSTRIAL FEEDSTOCK AND CHINA TO DOMINATE ASIA PACIFIC AMMONIA MARKET IN 2024
- FIGURE 14 AUTOTHERMAL REFORMING TECHNOLOGY TO HOLD LARGEST SHARE OF AMMONIA MARKET IN 2030
- FIGURE 15 INDUSTRIAL FEEDSTOCK SEGMENT TO ACCOUNT FOR LARGEST SHARE OF AMMONIA MARKET IN 2030
- FIGURE 16 BLUE AMMONIA MARKET: DRIVERS, RESTRAINTS, OPPORTUNITIES, AND CHALLENGES
- FIGURE 17 REVENUE SHIFT AND NEW REVENUE POCKETS FOR PLAYERS IN AMMONIA MARKET
- FIGURE 18 BLUE AMMONIA SUPPLY CHAIN ANALYSIS
- FIGURE 19 AMMONIA MARKET MAPPING
- FIGURE 20 HS CODE 2814: EXPORT DATA FOR TOP 5 COUNTRIES, 2020–2022 (USD)
- FIGURE 21 HS CODE 2814: IMPORT DATA FOR TOP 5 COUNTRIES, 2020–2022 (USD)
- FIGURE 22 HS CODE 280410: EXPORT DATA FOR TOP 5 COUNTRIES, 2020–2022 (USD)
- FIGURE 23 HS CODE 280410: IMPORT DATA FOR TOP 5 COUNTRIES, 2020–2022 (USD)
- FIGURE 24 PORTER'S FIVE FORCES ANALYSIS FOR AMMONIA MARKET
- FIGURE 25 INFLUENCE OF STAKEHOLDERS ON BUYING PROCESS FOR TOP 3 END-USE APPLICATIONS
- FIGURE 26 KEY BUYING CRITERIA FOR TOP 3 END-USE APPLICATIONS
- FIGURE 27 BLUE AMMONIA MARKET, BY TECHNOLOGY, 2024
- FIGURE 28 AMMONIA MARKET, BY END-USE APPLICATION, 2024
- FIGURE 29 NORTH AMERICA TO RECORD HIGHEST CAGR IN MARKET DURING FORECAST PERIOD
- FIGURE 30 BLUE AMMONIA MARKET SHARE, IN TERMS OF VALUE, BY REGION, 2024
- FIGURE 31 NORTH AMERICA: BLUE AMMONIA MARKET SNAPSHOT
- FIGURE 32 ASIA PACIFIC: AMMONIA MARKET SNAPSHOT
- FIGURE 33 KEY DEVELOPMENTS IN AMMONIA MARKET, 2019–2023
- FIGURE 34 KEY PLAYERS IN AMMONIA MARKET, 2022
- FIGURE 35 SEGMENTAL REVENUE ANALYSIS, 2018–2022
- FIGURE 36 MARKET: EVALUATION MATRIX FOR KEY COMPANIES, 2022
- FIGURE 37 MARKET: EVALUATION MATRIX FOR STARTUPS/SMES, 2022
- FIGURE 38 YARA INTERNATIONAL ASA: COMPANY SNAPSHOT
- FIGURE 39 SAUDI ARABIAN OIL CO.: COMPANY SNAPSHOT
- FIGURE 40 OCI: COMPANY SNAPSHOT
- FIGURE 42 MA’ADEN: COMPANY SNAPSHOT
- FIGURE 43 QATAR FERTILISER COMPANY (QAFCO): COMPANY SNAPSHOT
- FIGURE 44 SHELL PLC: COMPANY SNAPSHOT
- FIGURE 45 EXXONMOBIL CORPORATION: COMPANY SNAPSHOT
- FIGURE 46 LINDE PLC: COMPANY SNAPSHOT
- FIGURE 47 NUTRIEN LTD.: COMPANY SNAPSHOT
- FIGURE 48 UNIPER SE: COMPANY SNAPSHOT
- FIGURE 49 ADNOC GROUP: COMPANY SNAPSHOT
- FIGURE 50 LSB INDUSTRIES: COMPANY SNAPSHOT
- FIGURE 51 KBR INC.: COMPANY SNAPSHOT
- FIGURE 52 TECHNIP ENERGIES N.V.: COMPANY SNAPSHOT
- FIGURE 53 MAIRETECNIMONT S.P.A.: COMPANY SNAPSHOT
- FIGURE 54 SAIPEM: COMPANY SNAPSHOT
The study involved major activities in estimating the current size of the blue ammonia market. Exhaustive secondary research was done to collect information on the peer and parent markets. The next step was to validate these findings, assumptions, and sizing with industry experts across the value chain through primary research. Both top-down and bottom-up approaches were employed to estimate the total market size. Thereafter, market breakdown and data triangulation were used to estimate the market size of the segments and subsegments.
Secondary Research
This research study on the blue ammonia market involved the use of extensive secondary sources, directories, and databases, such as Bloomberg, Factiva, IRENA, International Energy Agency, Statista Industry Journal, and IEA, to collect and identify information useful for a technical, market-oriented, and commercial study of the market. The other secondary sources included annual reports, press releases & investor presentations of companies, white papers, certified publications, articles by recognized authors, manufacturer associations, trade directories, and databases.
Primary Research
The blue ammonia market comprises several stakeholders, such as blue ammonia manufacturers, technology providers, and technical support providers in the supply chain. The demand side of this market is characterized by the rising demand for blue ammonia in transportation, power generation, and industrial feedstock. The supply side is characterized by rising demand for contracts from the industrial sector and mergers & acquisitions among big players. Various primary sources from both the supply and demand sides of the market were interviewed to obtain qualitative and quantitative information. Following is the breakdown of primary respondents:
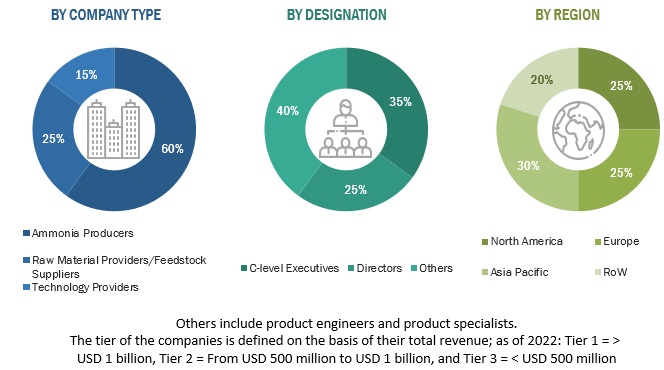
To know about the assumptions considered for the study, download the pdf brochure
Market Size Estimation
Both top-down and bottom-up approaches were used to estimate and validate the total size of the blue ammonia market. These methods were also used extensively to estimate the size of various subsegments in the market. The research methodology used to estimate the market size includes the following:
- The key players in the industry and market have been identified through extensive secondary research.
- The industry’s value chain and market size, in terms of value, have been determined through both primary and secondary research processes.
- All percentage shares, splits, and breakdowns have been determined using secondary sources and verified through primary sources.
Blue ammonia market Size: Top-Down Approach
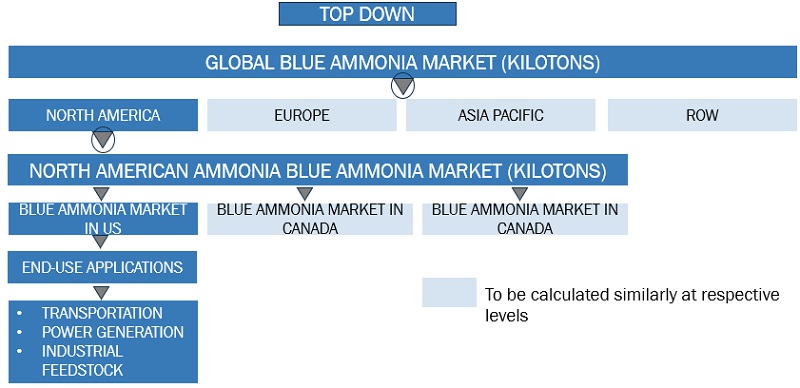
To know about the assumptions considered for the study, Request for Free Sample Report
Blue ammonia market Size: Bottom-Up Approach
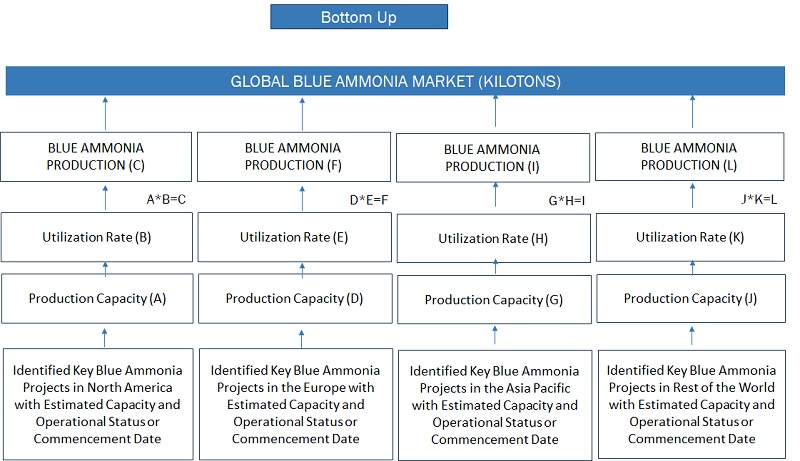
Data Triangulation
After arriving at the overall market size from the above estimation process, the total market has been split into several segment. Data triangulation and market breakdown processes have been employed to complete the overall market engineering process and arrive at the exact statistics for all the segments, wherever applicable. The data has been triangulated by studying various factors and trends from both the demand- and supply sides. Along with this, the market has been validated using both the top-down and bottom-up approaches.
Market Definition
The blue ammonia is the ammonia produced using natural gas as a feedstock, but with the carbon dioxide emissions from the production process captured and stored. Blue ammonia is a lower-carbon alternative to traditional ammonia production, which releases large amounts of greenhouse gases into the atmosphere.
The growth of the blue ammonia market during the forecast period can be attributed to Growing focus on reducing greenhouse gas emissions and increasing efforts toward empowering hydrogen economy across major countries in North America, Europe, Asia Pacific, and Rest of the World.
Key Stakeholders
- Government organizations
- Blue hydrogen suppliers
- Fertilizer manufacturers
- Shipping or maritime industry
- Power generation companies
- Technology providers and EPC companies
- Institutional investors
- Research institutes
Objectives of the Study
- To define, describe, segment, and forecast the blue ammonia market size, by technology, by end-use application and region, in terms of value
- To define, describe, segment, and forecast the blue ammonia market size, by end-use application, in terms of volume
- To forecast the market size across five key regions, namely North America, Europe, Asia Pacific, and Rest of the World in terms of value and volume
- To provide detailed information about the key drivers, restraints, opportunities, and industry-specific challenges influencing the growth of the market
- To strategically analyze the market with respect to individual growth trends, prospects, and contributions of each segment to the market
- To provide information pertaining to the supply chain, trends/disruptions impacting customer business, market map, pricing of hydrogens, and regulatory landscape pertaining to the market
- To strategically analyze the micromarkets with respect to individual growth trends, upcoming expansions, and their contributions to the overall market
- To analyze opportunities for stakeholders in the market and draw a competitive landscape for market players
- To benchmark players within the market using the company evaluation quadrant, which analyzes market players on various parameters within the broad categories of business and product strategies
- To compare key market players with respect to the market share, product specifications, and applications
- To strategically profile key players and comprehensively analyze their market ranking and core competencies.
- To track and analyze competitive developments in the market, sales contracts, agreements, investments, expansions, partnerships, joint ventures, and collaborations
Available Customizations:
With the given market data, MarketsandMarkets offers customizations according to the specific requirements of companies. The following customization options are available for the report:
Product Analysis
- Product Matrix, which provides a detailed comparison of the product portfolio of each company
Company Information
- Detailed analyses and profiling of additional market players


Growth opportunities and latent adjacency in Blue Ammonia Market