Blockchain Gaming Market

Blockchain Gaming Market by Game Type (Role Playing Games, Open World Games, Collectible Games), Platforms (ETH, BNB Chain, Polygon), and Region (North America, Europe, Asia Pacific, Rest of the World) - Global Forecast to 2027

Report Code: TC 8520 Dec, 2022, by marketsandmarkets.com

Blockchain Gaming Market Analysis, Industry Size & Forecast

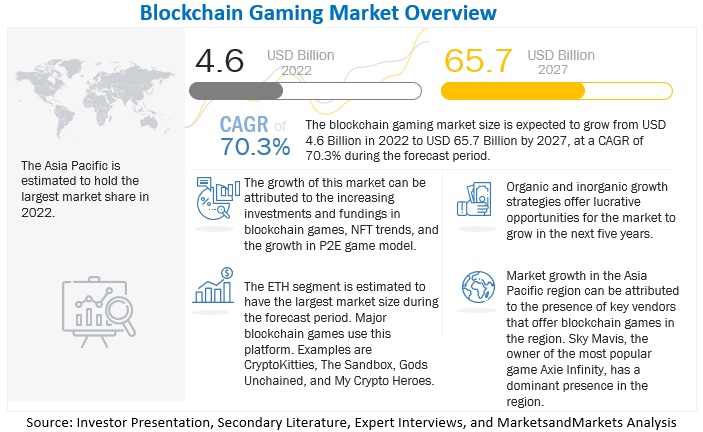
The global Blockchain Gaming Market size as per revenue was exceeded $4.6 billion in 2022 and is poised to hit around $65.7 billion by the end of 2027, records a CAGR of 70.3% for anticipated period, 2022-2027.

The rise in investments in blockchain games is driving the blockchain gaming industry growth. On the other hand, limited awareness about blockchain and NFTs may hinder the market's growth.
Blockchain Gaming Market

To know about the assumptions considered for the study, Request for Free Sample Report

Blockchain Gaming Market Growth Dynamics

Driver: Shift from traditional games to blockchain-based games

Traditional games are centralized, which means all the items, including characters, skins, weapons, and even coding and experience gained while playing, cannot be used in other gaming projects. On the contrary, blockchain gaming enables players to own in-game digital assets. Gamers can now use rewards and in-game items across different crypto-gaming projects. Blockchain games offer various ways for gamers to earn real-world money. This concept is called a Play-To-Earn (P2E) model. For example, in Axie Infinity, one of the world's most famous P2E games, players can buy in-game characters called Axies, level them up, and sell them at a higher price. Gamers can also compete with other players to earn $SLP and $AXS, the project's native tokens. The benefits of using blockchain in gaming are making the game more secure, real-time ownership of items, and enabling gamers to earn real rewards. This is expected to boost the market growth.

Restraint: Regulatory challenges

The regulatory framework surrounding cryptocurrencies and NFTs might discourage gamers and developers from exploring blockchain games to their full potential. For example, the use of cryptocurrencies, such as MANA and Theta, poses a challenge as regulatory bodies are still trying to understand how they function and whether they should be used in blockchain gaming. In April 2022, the government of India introduced a 30% tax on the transfer of virtual digital assets or VDAs. As cryptos are classified as VDAs, players incur tax on crypto income. Crypto tax impacts people who earn reward points and make in-app purchases in crypto gaming. High tax levels could drive people out of blockchain gaming, affecting the industry.

Opportunity: Unique active wallet trends

The standard measurement for the DappRadar (DappRadar is the number one platform for dApp discovery, which gives users access to applications across blockchain ecosystems. For each dApp, DappRadar tracks the unique Active Wallets (UAWs), the number of transactions, and the volume of those transactions) Rankings are the UAW. This key metric shows which app has the most user wallets interacting with it and therefore sits on top of the charts. The growing number of UAWs is expected to hold immense opportunities for the market to grow in the future. As per findings from DappRadar, blockchain games registered 912,000 (8% month-on-month) Unique Active Wallets (UAWs) interacting with games' smart contracts in the quarter that ended in September 2022, which represented 48% of all blockchain-industry UAWs. In-game NFTs generated sales of USD 2.32 billion during that same period, which represents 22% of total NFT trading industry-wide. Alien Worlds and Splinterlands remain the two most played Web3 games. In Q3 September 2022, Alien Worlds became the most played blockchain game with 190,770 average daily UAWs, an increase of 14% from Q2. Splinterlands is the second most played blockchain game this quarter, with 159,522 average daily UAW, a 47% decrease from Q2. Similarly, due to a P2E gaming tournament featuring significant in-game NFTs for winners, the Polygon-based Benji Bananas, a game produced by Animoca Brands, climbed the rankings during the same quarter attracting over 29,000 daily UAWs, a rise UAWs of over 2,400% in September.

Challenge: Limited awareness of blockchain and NFT technologies

The major challenge for the mainstream acceptance and adoption of blockchain gaming is the lack of knowledge of its underlying technology: the blockchain. Blockchain technology is currently one of the hottest and most intriguing technologies in the market. However, end users are still facing some challenges in understanding the technicalities of the blockchain concept. This technology provides enormous benefits; however, even after many blockchain solution vendors have entered the market, the adoption of blockchain solutions is still not up to the mark. Enterprises adopting this technology need skilled staff that has in-depth knowledge of blockchain networks and blockchain applications. While people might have heard about blockchain and NFT technologies, they are not quite aware of their benefits of these. Blockchain awareness needs to grow before a larger number of gamers will want to jump in. 40% of gamers across the US, the UK., and Indonesia are interested in blockchain games. As a result, blockchain-based games and their unique benefits do not get the kind the attention they deserve.

By platform, ETH to account for the largest market share during the forecast period

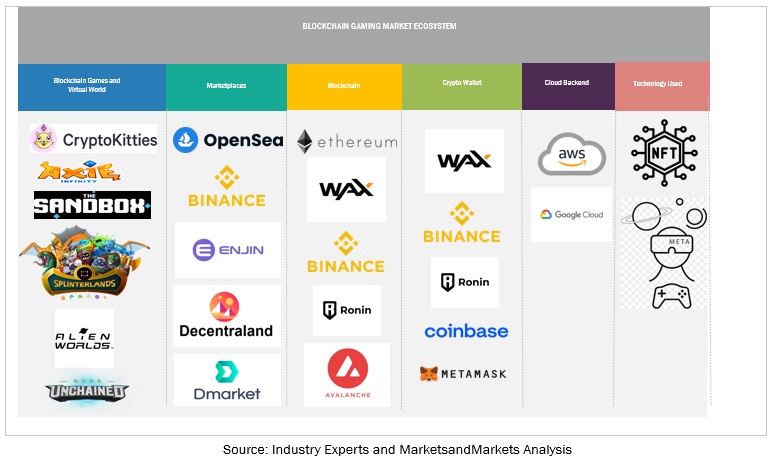
ETH dominates the blockchain gaming market, with the largest market share in 2022. Game developers rely on ETH platform as it dramatically reduces security issues and enables companies to ensure that clients' money and data are kept safe. CryptoKitties was the first NFT project on ETH. In this, players were enabled to collect digital cat collectibles backed using NFTs. After this, many games are developed on the Ethereum platform. Axie Infinity, Gods Unchained, The Sandbox, Decentraland, and CryptoKitties are among the popular games that use the ETH blockchain platform. ETH, as it is a public blockchain, has its own challenges. Hence, blockchain game developers are moving toward the adoption of other blockchain platforms to resolve any scalability or processing power issues. Hence, the ETH market is expected to grow at a slower rate as compared to other blockchain platforms, such as BNB Chain, Polygon, and Solana, in the future.

Blockchain Gaming Market Ecosystem
Blockchain Gaming Market Size, and Share

To know about the assumptions considered for the study, download the pdf brochure

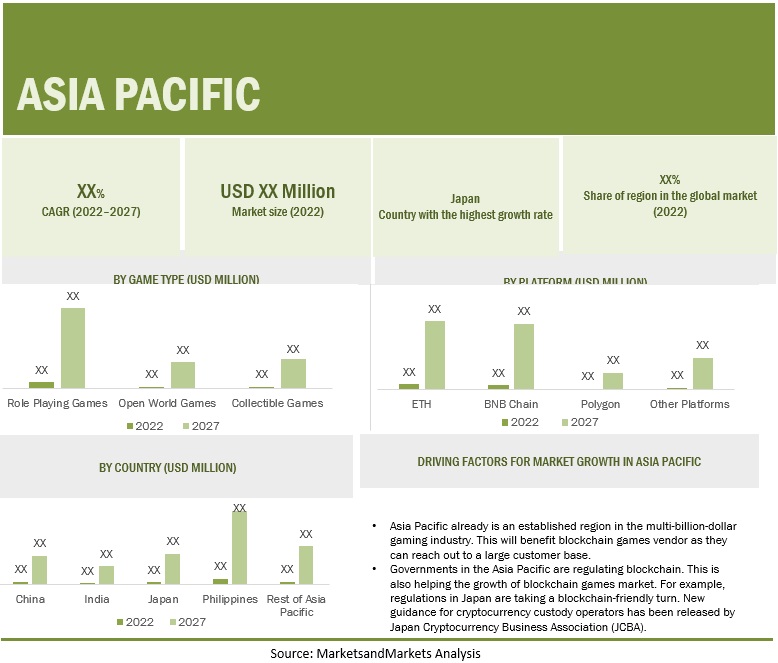
By region, Asia Pacific to account for the largest market share during the forecast period
Blockchain Gaming Market Size, and Share

To promote blockchain gaming in Asia, the Asia Blockchain Gaming Alliance (ABGA) was launched in November of 2021. ABGA helped in building the ecology of the industry and striving to invest in it. ABGA Shares industry knowledge, provides guidance to investors, and incubates and accelerates startups to drive the market. With a huge gamers base residing in the region, gaming is already a multi-billion-dollar industry across the Asia Pacific. This will benefit blockchain game vendors as they can reach out to a large customer base. Government regulations about blockchain are also helping the blockchain gaming market. For example, regulations in Japan are taking a blockchain-friendly turn. New guidance for cryptocurrency custody operators has been released by Japan Cryptocurrency Business Association (JCBA). These new guidelines will help developers comply with regulations while coming up with blockchain-based games that enable players to have greater control of in-game assets.

Key Market Players:

The key players in the global blockchain gaming market include Sky Mavis (Vietnam), Splinterlands (US), Animoca Brands (Hong Kong), Wemade (South Korea), Dacoco (Switzerland), Dapper Labs (Canada), Immutable (Australia), Uplandme (US), AlwaysGeeky Games (Canada), Decentraland Foundation (China), Mythical Games (US), Illuvium (Australia), Sorare (France), PopCap Games (US), G.JIT Japan (Japan), Double Jump.Tokyo (Japan), Gala Games (US), Lucid Sight (US), Rokosoft (Istanbul), Horizon Blockchain Games (Canada), Xaya (Malta), Planetarium (South Korea), Binamon (Argentina), and Codebit Labs (Australia).

Want to explore hidden markets that can drive new revenue in Blockchain Gaming Market?

Scope of the Report

Report Metrics

Details

Market size in 2022

$4.6 billion

Revenue forecast for 2027

$65.7 billion

CAGR (2022-2027)

70.3%

Forecast units

Value (USD Billion)

Key Market Drivers

  • Benefits of blockchain technology
  • Increasing investments and funding in blockchain games

Key Market Opportunities

  • NFTs and play-to-earn model trends
  • Unique active wallets trends

Segments covered

By Game Type, By Platform


Geographies covered

North America, Europe, Asia Pacific, Rest of the World


Major companies covered Sky Mavis (Vietnam), Splinterlands (US), Animoca Brands (Hong Kong), Wemade (South Korea), Dacoco (Switzerland), Dapper Labs (Canada), Immutable (Australia), Uplandme (US), AlwaysGeeky Games (Canada), Decentraland Foundation (China), Mythical Games (US), Illuvium (Australia), Sorare (France)

Market Segmentation:

Blockchain Gaming Market Size, and Share

Recent Developments:

  • In October 2022, Cool Cats Group announced that it received a strategic investment from Animoca Brands. In this partnership, Animoca Brands will help Cool Cats to become a global NFT brand.
  • In August 2022, Splinterlands announced its partnership with MLSPA. These companies will work together to create and develop a Play-to-Earn (P2E) blockchain soccer-based game.
  • In July 2022, Dacoco's Alien Worlds partnered with Zilliqa. Alien Worlds will integrate with Zilliqa for new features by bringing competitive gaming and blockchain gaming together through Zilliqa's eSports partners.
  • In March 2022, Wemade announced its partnership with mobile ad firm YouAppi. With this partnership, Wemade will market games for its WEMIX platform.
  • In November 2021, Community Gaming, a tournament organizer, announced a partnership with Sky Mavis to produce the Axie Infinity Fall Showcase. This will help Sky Mavis to reach out to a larger player base.

Frequently Asked Questions (FAQ):


To speak to our analyst for a discussion on the above findings, click Speak to Analyst


Exclusive indicates content/data unique to MarketsandMarkets and not available with any competitors.

TABLE OF CONTENTS
 
1 INTRODUCTION (Page No. - 18)
    1.1 STUDY OBJECTIVES 
    1.2 MARKET DEFINITION 
           1.2.1 INCLUSIONS AND EXCLUSIONS
    1.3 MARKET SCOPE 
           1.3.1 MARKET SEGMENTATION
           1.3.2 REGIONS COVERED
           1.3.3 YEARS CONSIDERED
    1.4 CURRENCY CONSIDERED 
           TABLE 1 UNITED STATES DOLLAR EXCHANGE RATE, 2018–2021
    1.5 STAKEHOLDERS 
 
2 RESEARCH METHODOLOGY (Page No. - 23)
    2.1 RESEARCH DATA 
           FIGURE 1 BLOCKCHAIN GAMING MARKET: RESEARCH DESIGN
           2.1.1 SECONDARY DATA
                    2.1.1.1 List of key secondary sources
           2.1.2 PRIMARY DATA
                    2.1.2.1 Breakup of primary profiles
                    2.1.2.2 Key industry insights
    2.2 DATA TRIANGULATION 
           FIGURE 2 MARKET: RESEARCH FLOW
    2.3 MARKET SIZE ESTIMATION 
           2.3.1 REVENUE ESTIMATES
                    FIGURE 3 MARKET SIZE ESTIMATION METHODOLOGY—APPROACH 1 (SUPPLY SIDE): REVENUE OF BLOCKCHAIN GAME PROVIDERS
                    FIGURE 4 MARKET SIZE ESTIMATION METHODOLOGY—APPROACH 1, SUPPLY-SIDE ANALYSIS
    2.4 COMPANY EVALUATION QUADRANT METHODOLOGY 
           FIGURE 5 COMPANY EVALUATION QUADRANT: CRITERIA WEIGHTAGE
    2.5 MARKET FORECAST 
           TABLE 2 FACTOR ANALYSIS
    2.6 ASSUMPTIONS 
    2.7 LIMITATIONS 
 
3 EXECUTIVE SUMMARY (Page No. - 33)
    TABLE 3 BLOCKCHAIN GAMING MARKET SIZE AND GROWTH, 2022–2027 (USD MILLION, Y-O-Y GROWTH) 
    FIGURE 6 GLOBAL MARKET TO WITNESS SIGNIFICANT GROWTH DURING FORECAST PERIOD 
    FIGURE 7 ASIA PACIFIC TO ACCOUNT FOR LARGEST MARKET SHARE IN 2022 
    FIGURE 8 FASTEST-GROWING SEGMENTS OF MARKET 
 
4 PREMIUM INSIGHTS (Page No. - 37)
    4.1 BRIEF OVERVIEW OF BLOCKCHAIN GAMING MARKET 
           FIGURE 9 INCREASE IN INVESTMENTS IN BLOCKCHAIN GAMES AND P2E & NFT TRENDS TO DRIVE MARKET
    4.2 MARKET, BY GAME TYPE 
           FIGURE 10 ROLE-PLAYING GAMES TO ACCOUNT FOR LARGEST MARKET SHARE DURING FORECAST PERIOD, 2022
    4.3 MARKET, BY PLATFORM 
           FIGURE 11 ETH PLATFORM TO ACCOUNT FOR LARGEST MARKET SHARE DURING FORECAST PERIOD, 2022
    4.4 MARKET INVESTMENT SCENARIO 
           FIGURE 12 NORTH AMERICA TO EMERGE AS BEST MARKET FOR INVESTMENTS IN NEXT FIVE YEARS
 
5 MARKET OVERVIEW AND INDUSTRY TRENDS (Page No. - 39)
    5.1 INTRODUCTION 
    5.2 MARKET DYNAMICS 
           FIGURE 13 DRIVERS, RESTRAINTS, OPPORTUNITIES, AND CHALLENGES: BLOCKCHAIN GAMING MARKET
           5.2.1 DRIVERS
                    5.2.1.1 Benefits of blockchain technology
                    5.2.1.2 Increasing investments and funding in blockchain games
                               FIGURE 14 INVESTMENTS IN BLOCKCHAIN GAMES, 2021–2022 (USD BILLION)
                               TABLE 4 BLOCKCHAIN GAME FUNDING
                    5.2.1.3 Shift from traditional games to blockchain-based games
           5.2.2 RESTRAINTS
                    5.2.2.1 Initial investments and complexity associated with playing blockchain games
                    5.2.2.2 Hacks and financial losses
                    5.2.2.3 Regulatory challenges
           5.2.3 OPPORTUNITIES
                    5.2.3.1 NFTs and play-to-earn model trends
                    5.2.3.2 Unique active wallets trends
           5.2.4 CHALLENGES
                    5.2.4.1 Limited awareness of blockchain and NFT technologies
    5.3 BLOCKCHAIN GAMING ECOSYSTEM ANALYSIS 
           FIGURE 15 BLOCKCHAIN GAMING MARKET ECOSYSTEM, BY GAME TYPE
           FIGURE 16 MARKET ECOSYSTEM
           TABLE 5 BLOCKCHAIN GAMING: MARKET ECOSYSTEM
    5.4 TECHNOLOGY ANALYSIS 
           5.4.1 BLOCKCHAIN GAMING AND WEB3
           5.4.2 BLOCKCHAIN GAMING AND NFTS
           5.4.3 BLOCKCHAIN GAMING AND METAVERSE
    5.5 COMPARISON BETWEEN CENTRALIZED/PERMISSIONED AND DECENTRALIZED/PERMISSIONLESS BLOCKCHAIN 
           TABLE 6 PERMISSIONLESS BLOCKCHAIN VS. PERMISSIONED BLOCKCHAIN
           TABLE 7 BLOCKCHAIN TYPOLOGY
           FIGURE 17 TYPES OF BLOCKCHAIN
           5.5.1 TYPES OF BLOCKCHAIN TECHNOLOGY
                    5.5.1.1 Private blockchain
                    5.5.1.2 Public blockchain
                    5.5.1.3 Permissioned/hybrid blockchain
    5.6 VALUE CHAIN ANALYSIS 
           5.6.1 GAME DEVELOPERS
           5.6.2 PLAYERS
           5.6.3 GAME ECOSYSTEM
    5.7 PRICING ANALYSIS 
    5.8 USE CASES 
           5.8.1 USE CASE 1: REAL OWNERSHIP
           5.8.2 USE CASE 2: STREAMLINING PAYMENTS
           5.8.3 USE CASE 3: CRYPTO GAMES AND PLAY-TO-EARN
           5.8.4 USE CASE 4: ENHANCED SECURITY
           5.8.5 USE CASE 5: NFTS AND DIGITAL COLLECTIBLES
    5.9 BLOCKCHAIN REGULATIONS 
           TABLE 8 BLOCKCHAIN REGULATIONS/ASSOCIATIONS AND DESCRIPTION
    5.10 TRENDS AND DISRUPTIONS IMPACTING CUSTOMERS 
           FIGURE 18 BLOCKCHAIN GAMING MARKET: TRENDS AND DISRUPTIONS IMPACTING CUSTOMERS
    5.11 PORTER’S FIVE FORCES ANALYSIS 
                    FIGURE 19 MARKET: PORTER’S FIVE FORCES ANALYSIS
                    TABLE 9 PORTER’S FIVE FORCES IMPACT ON MARKET
           5.11.1 THREAT FROM NEW ENTRANTS
           5.11.2 THREAT FROM SUBSTITUTES
           5.11.3 BARGAINING POWER OF SUPPLIERS
           5.11.4 BARGAINING POWER OF BUYERS
           5.11.5 INTENSITY OF COMPETITIVE RIVALRY
 
6 BLOCKCHAIN GAMING MARKET, BY ARCHITECTURE (Page No. - 58)
    6.1 INTRODUCTION 
           TABLE 10 DIFFERENT TYPES OF BLOCKCHAIN GAME ARCHITECTURES
    6.2 DECENTRALIZED MONOLITHIC 
           6.2.1 SIMPLEST FORM OF ARCHITECTURE TO PROCESS GAME LOGIC ENTIRELY INSIDE BLOCKCHAIN SOFTWARE
                    FIGURE 20 DECENTRALIZED MONOLITHIC ARCHITECTURE
                    FIGURE 21 DECENTRALIZED MONOLITHIC ARCHITECTURE VARIATION
    6.3 DECENTRALIZED LAYERED ARCHITECTURE 
           6.3.1 DECENTRALIZED LAYERED ARCHITECTURES USED IN FULLY DECENTRALIZED AND COMPLEX GAMES
                    FIGURE 22 DECENTRALIZED LAYERED ARCHITECTURE
    6.4 HYBRID ARCHITECTURE 
           6.4.1 HYBRID ARCHITECTURES MOSTLY USED FOR BLOCKCHAIN GAMING
                    FIGURE 23 HYBRID ARCHITECTURE
 
7 BLOCKCHAIN GAMING MARKET, BY GAME TYPE (Page No. - 62)
    7.1 INTRODUCTION 
           FIGURE 24 COLLECTIBLE GAMES TO GROW AT HIGHEST CAGR DURING FORECAST PERIOD
           TABLE 11 MARKET, BY GAME TYPE, 2020–2027 (USD MILLION)
    7.2 ROLE-PLAYING GAMES 
           7.2.1 PLAYERS TO HAVE DIRECT CONTROL OVER FICTIONAL GAME CHARACTERS WITH REWARDS DURING GAME PLAY
           7.2.2 ROLE-PLAYING GAMES: MARKET DRIVERS
                    TABLE 12 ROLE-PLAYING GAMES: MARKET, BY REGION, 2020–2027 (USD MILLION)
    7.3 OPEN WORLD GAMES 
           7.3.1 DIVERSE GAMEPLAY EXPERIENCES WITH BLOCKCHAIN NETWORKS TO DRIVE DEMAND FOR OPEN WORLD GAMES
           7.3.2 OPEN WORLD GAMES: MARKET DRIVERS
                    TABLE 13 OPEN WORLD GAMES: MARKET, BY REGION, 2020–2027 (USD MILLION)
    7.4 COLLECTIBLE GAMES 
           7.4.1 COLLECTIBLE GAMES ALLOW BLOCKCHAIN GAME PLAYERS TO OWN AND TRADE DIGITAL ASSETS WHILE PLAYING GAMES
           7.4.2 COLLECTIBLE GAMES: MARKET DRIVERS
                    TABLE 14 COLLECTIBLE GAMES: MARKET, BY REGION, 2020–2027 (USD MILLION)
 
8 BLOCKCHAIN GAMING MARKET, BY PLATFORM (Page No. - 67)
    8.1 INTRODUCTION 
           FIGURE 25 BNB CHAIN TO GROW AT HIGHEST CAGR DURING FORECAST PERIOD
           TABLE 15 MARKET, BY PLATFORM, 2020–2027 (USD MILLION)
    8.2 ETH 
           8.2.1 MOST USED PLATFORM FOR BLOCKCHAIN GAMES
           8.2.2 ETH: MARKET DRIVERS
                    TABLE 16 ETHEREUM: MARKET, BY REGION, 2020–2027 (USD MILLION)
    8.3 BNB CHAIN 
           8.3.1 ACTIVELY USED FOR BLOCKCHAIN GAMES DUE TO LESSER TRANSACTION FEES
           8.3.2 BNB CHAIN: MARKET DRIVERS
                    TABLE 17 BNB CHAIN: MARKET, BY REGION, 2020–2027 (USD MILLION)
    8.4 POLYGON 
           8.4.1 POLYGON PLATFORM TO HELP TACKLE NETWORK CONGESTION
           8.4.2 POLYGON: MARKET DRIVERS
                    TABLE 18 POLYGON: MARKET, BY REGION, 2020–2027 (USD MILLION)
    8.5 OTHER PLATFORMS 
           TABLE 19 OTHER PLATFORMS: MARKET, BY REGION, 2020–2027 (USD MILLION)
 
9 BLOCKCHAIN GAMING MARKET, BY REGION (Page No. - 73)
    9.1 INTRODUCTION 
           FIGURE 26 ASIA PACIFIC TO BE LARGEST MARKET DURING FORECAST PERIOD
           TABLE 20 MARKET, BY REGION, 2020–2027 (USD MILLION)
    9.2 NORTH AMERICA 
           9.2.1 NORTH AMERICA: MARKET DRIVERS
           9.2.2 NORTH AMERICA: REGULATORY LANDSCAPE
                    FIGURE 27 NORTH AMERICA: MARKET SNAPSHOT
                    TABLE 21 NORTH AMERICA: BLOCKCHAIN GAMING MARKET, BY GAME TYPE, 2020–2027 (USD MILLION)
                    TABLE 22 NORTH AMERICA: MARKET, BY PLATFORM, 2020–2027 (USD MILLION)
                    TABLE 23 NORTH AMERICA: MARKET, BY COUNTRY, 2020–2027 (USD MILLION)
           9.2.3 US
                    9.2.3.1 US, an early adopter of blockchain technology, to help blockchain games grow
                               TABLE 24 US: MARKET, BY GAME TYPE, 2020–2027 (USD MILLION)
                               TABLE 25 US: MARKET, BY PLATFORM, 2020–2027 (USD MILLION)
           9.2.4 CANADA
                    9.2.4.1 Government initiatives to support market growth
                               TABLE 26 CANADA: MARKET, BY GAME TYPE, 2020–2027 (USD MILLION)
                               TABLE 27 CANADA: MARKET, BY PLATFORM, 2020–2027 (USD MILLION)
    9.3 EUROPE 
           9.3.1 EUROPE: MARKET DRIVERS
           9.3.2 EUROPE: REGULATORY LANDSCAPE
                    TABLE 28 EUROPE: MARKET, BY GAME TYPE, 2020–2027 (USD MILLION)
                    TABLE 29 EUROPE: BLOCKCHAIN GAMING MARKET, BY PLATFORM, 2020–2027 (USD MILLION)
                    TABLE 30 EUROPE: MARKET, BY COUNTRY, 2020–2027 (USD MILLION)
           9.3.3 UK
                    9.3.3.1 Advancement in technologies such as AI/ML to augment market growth
                               TABLE 31 UK: MARKET, BY GAME TYPE, 2020–2027 (USD MILLION)
                               TABLE 32 UK: MARKET, BY PLATFORM, 2020–2027 (USD MILLION)
           9.3.4 GERMANY
                    9.3.4.1 Large player base in Germany to drive market growth
                               TABLE 33 GERMANY: MARKET, BY GAME TYPE, 2020–2027 (USD MILLION)
                               TABLE 34 GERMANY: MARKET, BY PLATFORM, 2020–2027 (USD MILLION)
           9.3.5 FRANCE
                    9.3.5.1 Government to support adoption of blockchain technology for game developers
                               TABLE 35 FRANCE: MARKET, BY GAME TYPE, 2020–2027 (USD MILLION)
                               TABLE 36 FRANCE: MARKET, BY PLATFORM, 2020–2027 (USD MILLION)
           9.3.6 REST OF EUROPE
                    TABLE 37 REST OF EUROPE: MARKET, BY GAME TYPE, 2020–2027 (USD MILLION)
                    TABLE 38 REST OF EUROPE: MARKET, BY PLATFORM, 2020–2027 (USD MILLION)
    9.4 ASIA PACIFIC 
           9.4.1 ASIA PACIFIC: BLOCKCHAIN GAMING MARKET DRIVERS
           9.4.2 ASIA PACIFIC: REGULATORY LANDSCAPE
                    FIGURE 28 ASIA PACIFIC: MARKET SNAPSHOT
                    TABLE 39 ASIA PACIFIC: MARKET, BY GAME TYPE, 2020–2027 (USD MILLION)
                    TABLE 40 ASIA PACIFIC: MARKET, BY PLATFORM, 2020–2027 (USD MILLION)
                    TABLE 41 ASIA PACIFIC: MARKET, BY COUNTRY, 2020–2027 (USD MILLION)
           9.4.3 CHINA
                    9.4.3.1 Large player base that spends money on video games to make it lucrative market
                               TABLE 42 CHINA: MARKET, BY GAME TYPE, 2020–2027 (USD MILLION)
                               TABLE 43 CHINA: MARKET, BY PLATFORM, 2020–2027 (USD MILLION)
           9.4.4 INDIA
                    9.4.4.1 Quick adopter of blockchain games due to large population
                               TABLE 44 INDIA: MARKET, BY GAME TYPE, 2020–2027 (USD MILLION)
                               TABLE 45 INDIA: MARKET, BY PLATFORM, 2020–2027 (USD MILLION)
           9.4.5 JAPAN
                    9.4.5.1 Adoption of cryptocurrency to play key role in growth of blockchain games
                               TABLE 46 JAPAN: MARKET, BY GAME TYPE, 2020–2027 (USD MILLION)
                               TABLE 47 JAPAN: MARKET, BY PLATFORM, 2020–2027 (USD MILLION)
           9.4.6 PHILIPPINES
                    9.4.6.1 With millions of daily active game users, Philippines to be large source of traffic for blockchain games
                               TABLE 48 PHILIPPINES: BLOCKCHAIN GAMING MARKET, BY GAME TYPE, 2020–2027 (USD MILLION)
                               TABLE 49 PHILIPPINES: MARKET, BY PLATFORM, 2020–2027 (USD MILLION)
           9.4.7 REST OF ASIA PACIFIC
                    TABLE 50 REST OF ASIA PACIFIC: MARKET, BY GAME TYPE, 2020–2027 (USD MILLION)
                    TABLE 51 REST OF ASIA PACIFIC: MARKET, BY PLATFORM, 2020–2027 (USD MILLION)
    9.5 REST OF THE WORLD (ROW) 
           9.5.1 ROW: REGULATORY LANDSCAPE
                    TABLE 52 ROW: MARKET, BY GAME TYPE, 2020–2027 (USD MILLION)
                    TABLE 53 ROW: MARKET, BY PLATFORM, 2020–2027 (USD MILLION)
 
10 COMPETITIVE LANDSCAPE (Page No. - 95)
     10.1 OVERVIEW 
     10.2 MARKET SHARE ANALYSIS OF LEADING PLAYERS 
               FIGURE 29 BLOCKCHAIN GAMING MARKET: REVENUE ANALYSIS
     10.3 MARKET STRUCTURE 
               TABLE 54 MARKET: DEGREE OF COMPETITION
     10.4 RANKING OF KEY PLAYERS 
               FIGURE 30 RANKING OF KEY MARKET PLAYERS
     10.5 MARKET EVALUATION FRAMEWORK 
               FIGURE 31 MARKET EVALUATION FRAMEWORK BETWEEN 2020 & 2022
     10.6 COMPANY EVALUATION QUADRANT 
             10.6.1 COMPANY EVALUATION QUADRANT DEFINITIONS AND METHODOLOGY
                       TABLE 55 EVALUATION CRITERIA
     10.7 COMPETITIVE BENCHMARKING 
               TABLE 56 MARKET: LIST OF COMPANIES
               TABLE 57 MARKET: COMPETITIVE BENCHMARKING OF KEY PLAYERS
     10.8 COMPETITIVE LEADERSHIP MAPPING 
               TABLE 58 EVALUATION CRITERIA
             10.8.1 STARS
             10.8.2 EMERGING LEADERS
             10.8.3 PERVASIVE PLAYERS
             10.8.4 PARTICIPANTS
                       FIGURE 32 BLOCKCHAIN GAMING MARKET: COMPANY EVALUATION QUADRANT
     10.9 COMPETITIVE LANDSCAPE 
               TABLE 59 MARKET: PRODUCT LAUNCHES
               TABLE 60 MARKET: DEALS
 
11 COMPANY PROFILES (Page No. - 109)
     11.1 INTRODUCTION 
(Business overview, Products/Solutions/Services offered, Recent developments & MnM View)*
     11.2 KEY PLAYERS 
             11.2.1 SKY MAVIS
                       TABLE 61 SKY MAVIS: BUSINESS OVERVIEW
                       TABLE 62 SKY MAVIS: GAMES OFFERED
                       TABLE 63 SKY MAVIS: PRODUCT LAUNCHES AND ENHANCEMENTS
                       TABLE 64 SKY MAVIS: DEALS
             11.2.2 SPLINTERLANDS
                       TABLE 65 SPLINTERLANDS: BUSINESS OVERVIEW
                       TABLE 66 SPLINTERLANDS: GAMES OFFERED
                       TABLE 67 SPLINTERLANDS: PRODUCT LAUNCHES AND ENHANCEMENTS
                       TABLE 68 SPLINTERLANDS: DEALS
             11.2.3 ANIMOCA BRANDS
                       TABLE 69 ANIMOCA BRANDS: BUSINESS OVERVIEW
                       TABLE 70 ANIMOCA BRANDS: SOLUTIONS OFFERED
                       TABLE 71 ANIMOCA BRANDS: PRODUCT LAUNCHES
                       TABLE 72 ANIMOCA BRANDS: DEALS
             11.2.4 WEMADE
                       TABLE 73 WEMADE: BUSINESS OVERVIEW
                       FIGURE 33 WEMADE: COMPANY SNAPSHOT
                       TABLE 74 WEMADE: SOLUTIONS OFFERED
                       TABLE 75 WEMADE: PRODUCT LAUNCHES AND ENHANCEMENTS
                       TABLE 76 WEMADE: DEALS
             11.2.5 DACOCO
                       TABLE 77 DACOCO: BUSINESS OVERVIEW
                       TABLE 78 DACOCO: GAMES OFFERED
                       TABLE 79 DACOCO: PRODUCT LAUNCHES AND ENHANCEMENTS
                       TABLE 80 DACOCO: DEALS
             11.2.6 DAPPER LABS
                       TABLE 81 DAPPER LABS: BUSINESS OVERVIEW
                       TABLE 82 DAPPER LABS: SOLUTIONS OFFERED
                       TABLE 83 DAPPER LABS: DEALS
             11.2.7 IMMUTABLE
                       TABLE 84 IMMUTABLE: BUSINESS OVERVIEW
                       TABLE 85 IMMUTABLE: SOLUTIONS OFFERED
                       TABLE 86 IMMUTABLE: PRODUCT LAUNCHES
                       TABLE 87 IMMUTABLE: DEALS
             11.2.8 UPLANDME
                       TABLE 88 UPLANDME: BUSINESS OVERVIEW
                       TABLE 89 UPLANDME: SOLUTIONS OFFERED
                       TABLE 90 UPLANDME: PRODUCT LAUNCHES
                       TABLE 91 UPLANDME: DEALS
             11.2.9 ALWAYSGEEKY GAMES
                       TABLE 92 ALWAYSGEEKY GAMES: BUSINESS OVERVIEW
                       TABLE 93 ALWAYSGEEKY GAMES: SOLUTIONS OFFERED
                       TABLE 94 ALWAYSGEEKY GAMES: PRODUCT LAUNCHES AND ENHANCEMENTS
                       TABLE 95 ALWAYSGEEKY GAMES: DEALS
             11.2.10 DECENTRALAND FOUNDATION
                       TABLE 96 DECENTRALAND FOUNDATION: BUSINESS OVERVIEW
                       TABLE 97 DECENTRALAND FOUNDATION: SOLUTIONS OFFERED
                       TABLE 98 DECENTRALAND FOUNDATION: DEALS
             11.2.11 MYTHICAL GAMES
                       TABLE 99 MYTHICAL GAMES: BUSINESS OVERVIEW
                       TABLE 100 MYTHICAL GAMES: SOLUTIONS OFFERED
                       TABLE 101 MYTHICAL GAMES: PRODUCT LAUNCHES AND ENHANCEMENTS
                       TABLE 102 MYTHICAL GAMES: DEALS
             11.2.12 ILLUVIUM
                       TABLE 103 ILLUVIUM: BUSINESS OVERVIEW
                       TABLE 104 ILLUVIUM: SOLUTIONS OFFERED
                       TABLE 105 ILLUVIUM: PRODUCT LAUNCHES AND ENHANCEMENTS
                       TABLE 106 ILLUVIUM: DEALS
             11.2.13 SORARE
                       TABLE 107 SORARE: BUSINESS OVERVIEW
                       TABLE 108 SORARE: SOLUTIONS OFFERED
                       TABLE 109 SORARE: PRODUCT LAUNCHES AND ENHANCEMENTS
                       TABLE 110 SORARE: DEALS
             11.2.14 POPCAP GAMES
                       TABLE 111 POPCAP GAMES: BUSINESS OVERVIEW
                       TABLE 112 POPCAP GAMES: SOLUTIONS OFFERED
*Details on Business overview, Products/Solutions/Services offered, Recent developments & MnM View might not be captured in case of unlisted companies.
     11.3 OTHER PLAYERS 
             11.3.1 G.JIT JAPAN
             11.3.2 DOUBLE JUMP.TOKYO
             11.3.3 GALA GAMES
             11.3.4 LUCID SIGHT
             11.3.5 ROKOSOFT
             11.3.6 HORIZON BLOCKCHAIN GAMES
             11.3.7 XAYA
             11.3.8 PLANETARIUM
             11.3.9 BINAMON
             11.3.10 CODEBIT LABS
 
12 ADJACENT MARKETS (Page No. - 144)
     12.1 INTRODUCTION TO ADJACENT MARKETS 
               TABLE 113 ADJACENT MARKETS
     12.2 LIMITATIONS 
     12.3 BLOCKCHAIN MARKET 
               TABLE 114 BLOCKCHAIN MARKET, BY COMPONENT, 2018–2020 (USD MILLION)
               TABLE 115 BLOCKCHAIN MARKET, BY COMPONENT, 2021–2026 (USD MILLION)
               TABLE 116 BLOCKCHAIN MARKET, BY APPLICATION AREA, 2018–2020 (USD MILLION)
               TABLE 117 BLOCKCHAIN MARKET, BY APPLICATION AREA, 2021–2026 (USD MILLION)
     12.4 NON-FUNGIBLE TOKENS MARKET 
               TABLE 118 NON-FUNGIBLE TOKENS MARKET, BY OFFERING, 2018–2021 (USD MILLION)
               TABLE 119 NON-FUNGIBLE TOKENS MARKET, BY OFFERING, 2022–2027 (USD MILLION)
               TABLE 120 NON-FUNGIBLE TOKENS MARKET, BY END USER, 2018–2021 (USD MILLION)
               TABLE 121 NON-FUNGIBLE TOKENS MARKET, BY END USER, 2022–2027 (USD MILLION)
     12.5 METAVERSE MARKET 
               TABLE 122 METAVERSE MARKET, BY COMPONENT, 2018–2021 (USD BILLION)
               TABLE 123 METAVERSE MARKET, BY COMPONENT, 2022–2027 (USD BILLION)
               TABLE 124 METAVERSE MARKET, BY VERTICAL, 2018–2021 (USD BILLION)
               TABLE 125 METAVERSE MARKET, BY VERTICAL, 2022–2027 (USD BILLION)
 
13 APPENDIX (Page No. - 149)
     13.1 DISCUSSION GUIDE 
     13.2 KNOWLEDGESTORE: MARKETSANDMARKETS’ SUBSCRIPTION PORTAL 
     13.3 CUSTOMIZATIONS OFFERED 
     13.4 RELATED REPORTS 
     13.5 AUTHOR DETAILS 

The study involved major activities in estimating the current market size for the blockchain gaming market. Exhaustive secondary research was done to collect information on the blockchain gaming industry. The next step was to validate these findings, assumptions, and sizing with industry experts across the value chain using primary research. Different approaches, such as top-down and bottom-up, were employed to estimate the total market size. After that, the market breakup and data triangulation procedures were used to estimate the market size of the segments and subsegments of the blockchain gaming market.

Secondary Research

The market for the companies offering blockchain gaming solutions for various verticals is arrived at based on the secondary data available through paid and unpaid sources and by analyzing the product portfolio of major companies in the ecosystem and rating them based on their performance and quality. In the secondary research process, various sources were referred to for identifying and collecting information for this study. The secondary sources included annual reports, press releases, investor presentations of companies; white papers, journals, certified publications; and articles from recognized authors, directories, and databases.

Secondary research was mainly used to obtain key information about the industry’s value chain, the total pool of key players, market classification, and segmentation according to the industry trends to the bottom-most level, regional markets, and key developments from both market and technology-oriented perspectives, all of which were further validated by primary sources.

Primary Research

Various primary sources from both supply and demand sides were interviewed to obtain qualitative and quantitative information for this report in the primary research process. The primary sources from the supply side included various industry experts, including Chief Executive Officers (CEOs), marketing directors, technology and innovation directors, investors, and related key executives from organizations operating in the blockchain gaming market.

In the market engineering process, top-down and bottom-up approaches were extensively used, along with several data triangulation methods, to perform the market estimation and market forecasting for the overall market segments and subsegments listed in this report. The complete market engineering process was extensive qualitative and quantitative analysis to list key information/insights throughout the report.

After the complete market engineering process (calculations for market statistics, market breakups, market size estimations, market forecasts, and data triangulation), extensive primary research was conducted to gather information and verify and validate the critical numbers arrived at. The primary research was also conducted to identify the segmentation types; industry trends; the competitive landscape of the blockchain gaming market players; and the key market dynamics, such as drivers, restraints, opportunities, challenges, and key strategies.

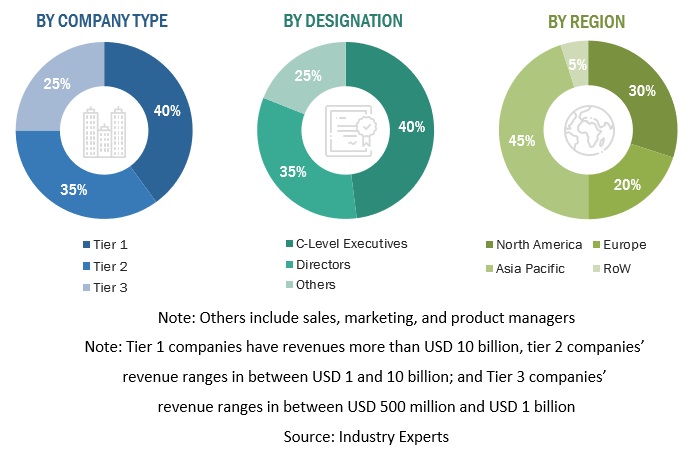
Following is the breakup of the primary respondents:
Blockchain Gaming Market Size, and Share

To know about the assumptions considered for the study, download the pdf brochure

Data Triangulation

After completing the market engineering process (including calculations for market statistics, market breakups, market size estimations, market forecasts, and data triangulation), extensive primary research was conducted to gather information and verify and validate the critical numbers arrived at. The primary research was also conducted to identify the segmentation types; industry trends; the competitive landscape of blockchain gaming market players; and key market dynamics, such as drivers, restraints, opportunities, challenges, industry trends, and key strategies.

Report Objectives

  • To define, describe, and forecast the blockchain gaming market by game type, platform, and region
  • To provide detailed information about the major factors (drivers, opportunities, restraints, and challenges) influencing the growth of the market
  • To analyze the opportunities in the market for stakeholders by identifying the high-growth segments of the market
  • To forecast the size of the market segments with respect to five main regions: North America, Europe, Asia Pacific, and the Rest of the World
  • To analyze subsegments of the market with respect to individual growth trends, prospects, and contributions to the overall market
  • To profile the key players of the market and comprehensively analyze their market size and core competencies
  • To track and analyze the competitive developments, such as product enhancements and new product launches; acquisitions; and partnerships and collaborations, in the blockchain gaming market globally

Customization Options

With the given market data, MarketsandMarkets offers customizations based on company-specific needs. The following customization options are available for the report:

Geographic analysis

  • Further breakup of the Asia Pacific market into countries contributing 75% to the regional market size
  • Further breakup of the North American market into countries contributing 75% to the regional market size
  • Further breakup of the European market into countries contributing 75% to the regional market size
  • Further breakup of the rest of the world market into countries contributing 75% to the regional market size

Company information

  • Detailed analysis and profiling of additional market players (up to 5)
Custom Market Research Services

We will customize the research for you, in case the report listed above does not meet with your exact requirements. Our custom research will comprehensively cover the business information you require to help you arrive at strategic and profitable business decisions.

Request Customization

Instant Answers with GPT - Ask Now!

Ask real questions. Get complete answers !
Report Code
TC 8520
Published ON
Dec, 2022
Choose License Type
BUY NOW
  • SHARE
X
Request Customization
Speak to Analyst
Speak to Analyst
OR FACE-TO-FACE MEETING
PERSONALIZE THIS RESEARCH
  • Triangulate with your Own Data
  • Get Data as per your Format and Definition
  • Gain a Deeper Dive on a Specific Application, Geography, Customer or Competitor
  • Any level of Personalization
REQUEST A FREE CUSTOMIZATION
LET US HELP YOU!
  • What are the Known and Unknown Adjacencies Impacting the Blockchain Gaming Market
  • What will your New Revenue Sources be?
  • Who will be your Top Customer; what will make them switch?
  • Defend your Market Share or Win Competitors
  • Get a Scorecard for Target Partners
CUSTOMIZED WORKSHOP REQUEST
knowledgestore logo

Want to explore hidden markets that can drive new revenue in Blockchain Gaming Market?

Find Hidden Markets
  • Call Us
  • +1-888-600-6441 (Corporate office hours)
  • +1-888-600-6441 (US/Can toll free)
  • +44-800-368-9399 (UK office hours)
CONNECT WITH US
ABOUT TRUST ONLINE
©2024 MarketsandMarkets Research Private Ltd. All rights reserved
DMCA.com Protection Status
Website Feedback