Bioimpedance Analyzers Market by Type (Single, Multi & Dual Frequency), Modality (Wired, Wireless), Application (Segmental Body Measurement, Whole Body Measurement), End User (Fitness Clubs, Home Users, Hospitals), & Region- Global Forecast to 2028
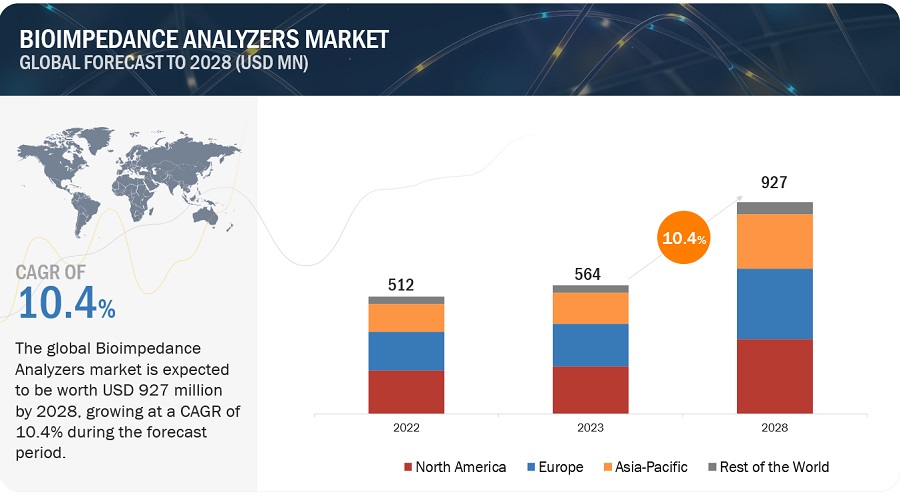
The global bioimpedance analyzers market, valued at US$512 million in 2022, stood at US$564 million in 2023 and is projected to advance at a resilient CAGR of 10.4% from 2023 to 2028, culminating in a forecasted valuation of US$927 million by the end of the period. The new research study consists of an industry trend analysis of the market. The new research study consists of industry trends, pricing analysis, patent analysis, conference and webinar materials, key stakeholders, and buying behaviour in the market. The growth in this market is attributed to the growing prevalence of diabetes, the global increase in the number of hospitals and fitness clubs, and the high rate of obese population. However, alternative methods or techniques restrain the growth of this market.
Attractive Opportunities in the Bioimpedance Analyzers Market
To know about the assumptions considered for the study, Request for Free Sample Report
Bioimpedance Analyzers Market Dynamics
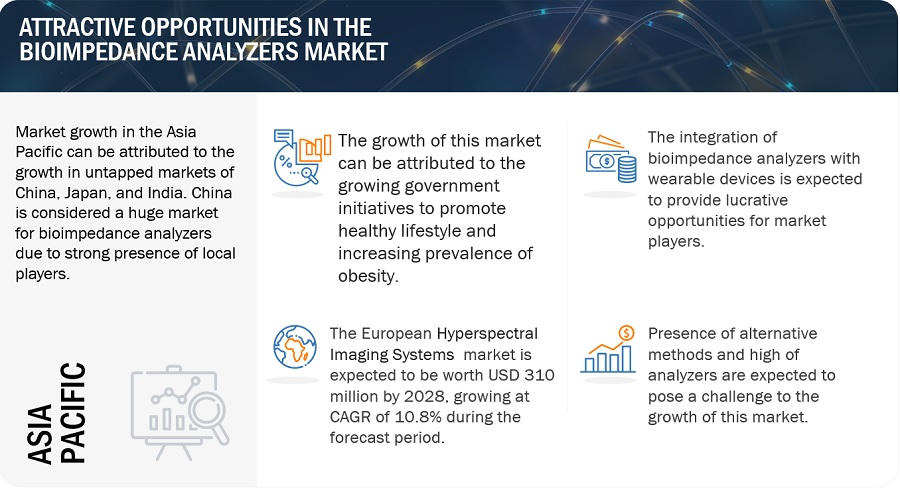
DRIVER: Increasing prevalence of lifestyle diseases
The rising prevalence of various lifestyle diseases, such as obesity, high blood pressure, and diabetes, is probably due to unhealthy lifestyles, such as sedentary work environments, eating more junk food, and increased mobility automation.
According to the World Obesity Atlas 2023, over 4 billion people may be affected by 2035, compared with over 2.6 billion in 2020. Thus, there is an increase from 38% of the world’s population in 2020 to over 50% by 2035. The prevalence of obesity (BMI ≥30kg/m²) alone is anticipated to rise from 14% to 24% of the population over the same period, affecting nearly 2 billion adults, children, and adolescents by 2035.
RESTRAINT: High cost of analyzers
The smaller healthcare facilities, clinics, and resource-constrained regions will get limited by the high cost of analyzers. Depending on the features, capabilities, and frequency, bioimpedance analyzers can range in pricing. For some healthcare facilities, fitness centers, and research institutions, especially smaller or resource-constrained organizations, the cost of acquiring and maintaining these devices can be a significant barrier. The price of bioimpedance analyzers can range from USD 2,000- USD 30,000.
OPPORTUNITY: Integration with wearable devices
Wearable devices, such as fitness trackers or smartwatches, to monitor body composition and hydration status could be integrated with bioimpedance analyzers. This integration will allow for real-time data collection and analysis, which will enable individuals to track their health parameters throughout the day and make informed decisions about their lifestyle and behavior.
Although bioimpedance monitoring is not a new concept, wearable bioimpedance monitoring for chronic conditions is a relatively new field [Source: Journal of Medical Internet Research (JMIR)].
CHALLENGE: Inconsistency in the accuracy of different bioimpedance analyzers
Although valuable information about body composition and hydration status can be obtained with bioimpedance analyzers, their accuracy may vary depending on age, gender, body type, and hydration level. They may not be as accurate as gold standard methods like DEXA or hydrostatic weighing in some cases. The number represents an estimate of the total body fat percentage, even though one gets an accurate reading on a bioimpedance scale. Most of the scales also cannot tell where fat is located in the body. Even though many factors can affect reading accuracy, a regular BIA scale can show changes in body fat over time. However, the obtained number may not be accurate but can still track changes to the body composition. This limitation can deter healthcare professionals and researchers who require exact measurements.
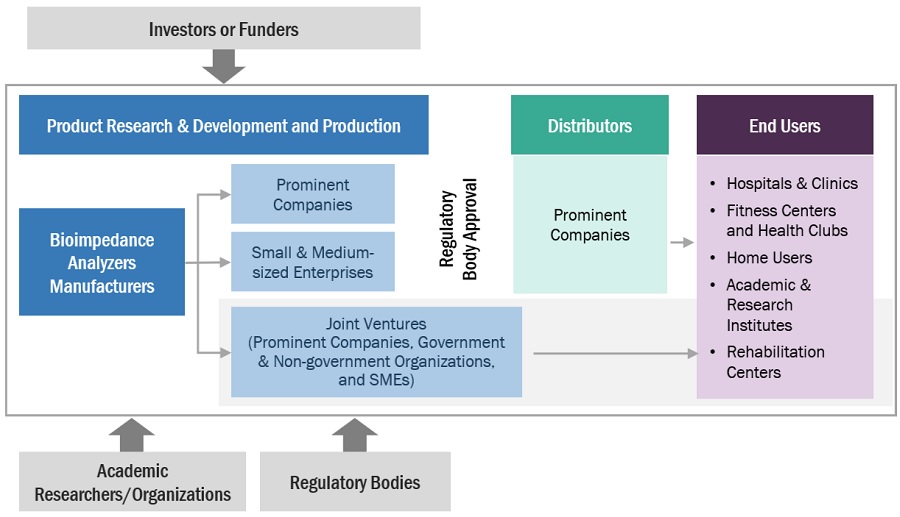
BIOIMPEDANCE ANALYZERS ECOSYSTEM
Prominent companies in this market include well-established, financially stable manufacturers of bioimpedance analyzers. These companies have been operating in the market for several years and possess diversified state-of-the-art technologies, product portfolios, and strong global sales and marketing networks. Prominent companies in this market include OMRON Corporation (Japan), Tanita Corporation (Japan), InBody (South Korea), RJL Systems (US), and Seca GmbH & Co. KG (Germany).
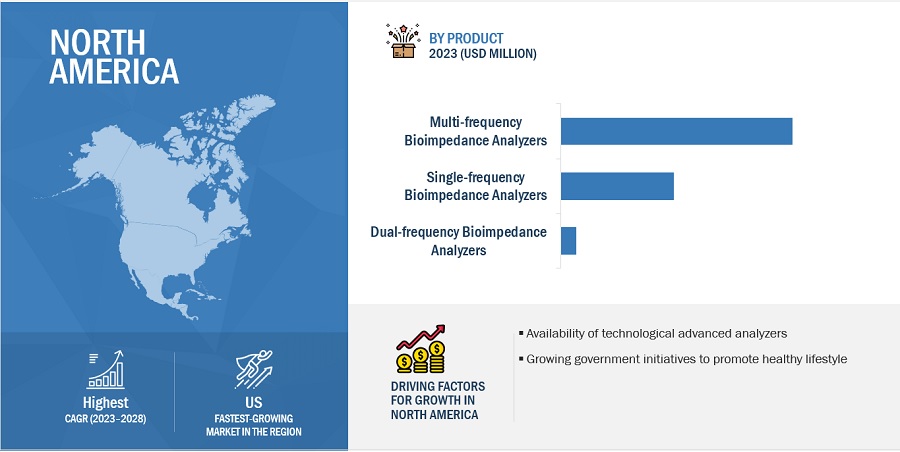
In 2022, multi-frequency bioimpedance analyzers segment to observe the highest growth rate of the bioimpedance analyzers industry, by product.
Based on product, the bioimpedance analyzers market is classified into multi-frequency, single-frequency, and dual-frequency bioimpedance analyzers. In 2022, the multi-frequency bioimpedance analyzers segment dominated the products market. This segment is also estimated to grow at the highest CAGR during the forecast period. The large share can be attributed to features like advanced tissue differentiation and integration with other technologies.
“In 2022, segmental body measurement segment to dominate the bioimpedance analyzers industry, by application.
Based on application, the bioimpedance analyzers market is segmented into segmental body measurement and whole-body measurement. The segmental body measurement segment accounted for the largest share of the market in 2022. Also, this segment is estimated to witness the highest growth during the forecast period. The large share is due to tracking changes in specific body segments by athletes and monitoring the effectiveness of the training programs.
In 2022, North America to dominate in bioimpedance analyzers industry.
The global bioimpedance analyzers market is segmented into North America, Europe, Asia Pacific, and Rest of the World. North America is expected to dominate during the forecast period, primarily due to the high promotion of healthy lifestyles, sedentary work life, and large population consuming junk food.
To know about the assumptions considered for the study, download the pdf brochure
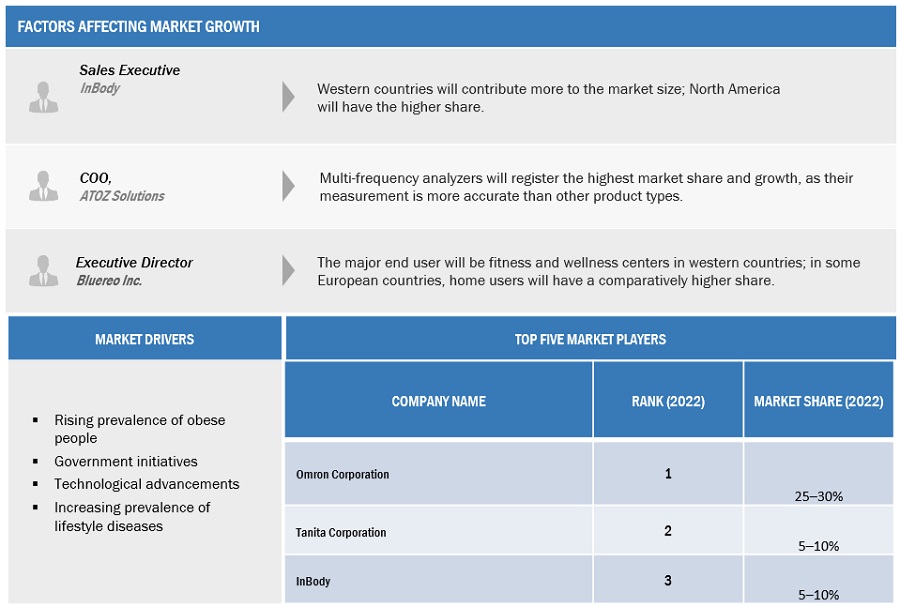
The bioimpedance analyzers market is dominated by players such as OMRON Corporation (Japan), Tanita Corporation (Japan), InBody (South Korea), RJL Systems (US), and Seca GmbH (Germany)
Scope of the Bioimpedance Analyzers Industry
|
Report Metric |
Details |
|
Market Revenue in 2023 |
$564 million |
|
Projected Revenue by 2028 |
$927 million |
|
Revenue Rate |
Poised to Grow at a CAGR of 10.4% |
|
Market Driver |
Increasing prevalence of lifestyle diseases |
|
Market Opportunity |
Integration with wearable devices |
This research report categorizes the bioimpedance analyzers market to forecast revenue and analyze trends in each of the following submarkets:
| By Region |
|
|
By Product |
|
|
By Modality |
|
|
By Usage Type |
|
|
By Application |
|
|
By End User |
|
Recent Developments of Bioimpedance Analyzers Industry
- In 2023, Bodystat Ltd. (UK) launched the Multiscan 5000, which incorporates the latest state-of-the-art bioelectrical impedance spectroscopy (BIS) technology based on direct digital synthesis, digital signal processing, and active shielding technology.
- In 2023, InBody Co., Ltd. (South Korea) announced it would supply the US Marine Corps with body composition analysis devices. The US Marine Corps announced refinements in its body composition assessment methods using the InBody 770 analyzer.
- In 2022, InBody Co., Ltd. (South Korea) partnered with iLoveKickboxing (US). The partnership offered iLoveKickboxing members access to high-quality data about their body fat percentage, muscle mass, and other biometrics. It enabled them to monitor changes over time via the InBody App.
Frequently Asked Questions (FAQ):
What is the projected market revenue value of the global bioimpedance analyzers market?
The global bioimpedance analyzers market boasts a total revenue value of $927 million by 2028.
What is the estimated growth rate (CAGR) of the global bioimpedance analyzers market?
The global bioimpedance analyzers market has an estimated compound annual growth rate (CAGR) of 10.4% and a revenue size in the region of $564 million in 2023.
To speak to our analyst for a discussion on the above findings, click Speak to Analyst


- 5.1 INTRODUCTION
-
5.2 MARKET DYNAMICSDRIVERS- Increasing prevalence of lifestyle diseases- Initiatives by governments and private organizations to promote healthy lifestyles- Growing number of fitness clubs, weight loss clinics, and sports rehabilitation centersRESTRAINTS- Presence of alternative methods- High cost of analyzersOPPORTUNITIES- Emerging markets across Asia Pacific and Latin America- Integration with wearable devicesCHALLENGES- Inconsistency in accuracy of different bioimpedance analyzers
- 5.3 SUPPLY CHAIN ANALYSIS
- 5.4 VALUE CHAIN ANALYSIS
-
5.5 ECOSYSTEM ANALYSISROLE IN ECOSYSTEM
-
5.6 REGULATORY LANDSCAPENORTH AMERICA- US- CanadaEUROPEASIA PACIFIC- Japan- China- India
-
5.7 PORTER’S FIVE FORCES ANALYSISTHREAT OF NEW ENTRANTSBARGAINING POWER OF SUPPLIERSBARGAINING POWER OF BUYERSINTENSITY OF COMPETITIVE RIVALRYTHREAT OF SUBSTITUTES
-
5.8 PATENT ANALYSIS
- 5.9 TRADE ANALYSIS
- 5.10 TECHNOLOGY ANALYSIS
- 5.11 PRICING ANALYSIS
-
5.12 TRENDS/DISRUPTIONS IMPACTING CUSTOMERS’ BUSINESSESREVENUE SHIFT & REVENUE POCKETS FOR BIOIMPEDANCE ANALYZER MANUFACTURERS
- 6.1 INTRODUCTION
-
6.2 MULTI-FREQUENCY BIOIMPEDANCE ANALYZERSACCURACY AND PRECISION TO DRIVE MARKET
-
6.3 SINGLE-FREQUENCY BIOIMPEDANCE ANALYZERSLOWER COST AND ACCESSIBILITY TO DRIVE MARKET
-
6.4 DUAL-FREQUENCY BIOIMPEDANCE ANALYZERSSUITABILITY FOR ADVANCED CLINICAL AND RESEARCH APPLICATIONS TO FAVOR GROWTH
- 7.1 INTRODUCTION
-
7.2 WIRELESS BIOIMPEDANCE ANALYZERSWIRELESS BIOIMPEDANCE ANALYZERS TO HOLD LARGEST MARKET SHARE
-
7.3 WIRED BIOIMPEDANCE ANALYZERSBENEFITS OF WIRED DEVICES TO DRIVE DEMAND
- 8.1 INTRODUCTION
-
8.2 PROFESSIONAL-GRADE BIOIMPEDANCE ANALYZERSGROWING NUMBER OF FITNESS & WELLNESS CENTERS TO DRIVE MARKET
-
8.3 CONSUMER-GRADE BIOIMPEDANCE ANALYZERSGROWING AWARENESS OF FITNESS AND TECHNOLOGICAL ADVANCEMENTS IN ANALYZERS TO DRIVE MARKET
- 9.1 INTRODUCTION
-
9.2 SEGMENTAL BODY MEASUREMENTRISING EMPHASIS ON MONITORING TRAINING EFFECTIVENESS TO BOOST ADOPTION
-
9.3 WHOLE-BODY MEASUREMENTGROWING USE OF WHOLE-BODY ANALYZERS TO DRIVE MARKET
- 10.1 INTRODUCTION
-
10.2 FITNESS CLUBS & WELLNESS CENTERSFITNESS CLUBS & WELLNESS CENTERS TO DOMINATE END-USER MARKET
-
10.3 HOME USERSAFFORDABILITY AND CONVENIENCE TO DRIVE ANALYZER ADOPTION
-
10.4 HOSPITALS & CLINICSNEED TO MONITOR NUTRITIONAL, HYDRATION STATES AND OTHER PARAMETERS TO BOOST ADOPTION
- 10.5 OTHER END USERS
- 11.1 INTRODUCTION
-
11.2 NORTH AMERICARECESSION IMPACTUS- Rising obesity rate and interest in health clubs & fitness centers to drive marketCANADA- High prevalence of obesity in Canada to support market growth
-
11.3 EUROPERECESSION IMPACTGERMANY- Germany to hold largest market share in EuropeUK- Rising incidence of kidney disorders to drive marketFRANCE- Increasing obese population and rising prevalence of metabolic disorders to drive marketREST OF EUROPE
-
11.4 ASIA PACIFICRECESSION IMPACTJAPAN- Government initiatives to drive marketCHINA- China to register highest CAGR in APAC marketAUSTRALIA- High prevalence of obesity to drive marketPHILIPPINES- Favorable government initiatives to support market growthTAIWAN- Increasing incidence of lifestyle diseases to drive marketREST OF ASIA PACIFIC
-
11.5 REST OF THE WORLDRECESSION IMPACT

- 12.1 OVERVIEW
- 12.2 KEY PLAYER STRATEGIES/RIGHT TO WIN
- 12.3 MARKET SHARE ANALYSIS
-
12.4 COMPANY EVALUATION MATRIX (2022)STARSEMERGING LEADERSPERVASIVE PLAYERSPARTICIPANTS
-
12.5 COMPANY EVALUATION MATRIX FOR START-UPS/SMES (2022)PROGRESSIVE COMPANIESSTARTING BLOCKSRESPONSIVE COMPANIESDYNAMIC COMPANIES
- 12.6 COMPETITIVE BENCHMARKING
-
12.7 COMPETITIVE SCENARIOPRODUCT LAUNCHESDEALSOTHER DEVELOPMENTS
-
13.1 KEY PLAYERSOMRON CORPORATION- Business overview- Products offered- MnM viewTANITA CORPORATION- Business overview- Products offered- MnM viewINBODY CO., LTD.- Business overview- Products offered- Recent developments- MnM viewRJL SYSTEMS, INC.- Business overview- Products offered- MnM viewSECA GMBH & CO. KG- Business overview- Products offered- MnM viewEVOLT 360- Business overview- Products offeredSELVAS HEALTHCARE (FORMERLY JAWON MEDICAL)- Business overview- Products offeredFOOK TIN TECHNOLOGIES LTD.- Business overview- Products offeredBODYSTAT LTD.- Business overview- Products offered- Recent developmentsCHARDER ELECTRONIC CO., LTD.- Business overview- Products offeredMALTRON INTERNATIONAL- Business overview- Products offered
-
13.2 OTHER PLAYERSBIOTEKNABIODYNAMICS CORPORATIONAKERNWITHINGSXIAOMISINO-HERO (SHENZHEN) BIO-MEDICAL ELECTRONICS CO., LTD.LUMSAIL INDUSTRIAL INC.GUANGZHOU BEAUTYLIFE ELECTRONIC TECHNOLOGY CO., LTD.BIOPARHOMMICROLIFESONKA MEDICAL TECHNOLOGY CO., LIMITEDNUMED S.A.R.L.WUNDER SA.BI. SRL.SHENZHEN YOLANDA TECHNOLOGY CO., LTDBODIVIS (TONGFANG HEALTH TECHNOLOGY CO., LTD.)
- 14.1 DISCUSSION GUIDE
- 14.2 KNOWLEDGESTORE: MARKETSANDMARKETS’ SUBSCRIPTION PORTAL
- 14.3 CUSTOMIZATION OPTIONS
- 14.4 RELATED REPORTS
- 14.5 AUTHOR DETAILS
- TABLE 1 INCLUSIONS AND EXCLUSIONS
- TABLE 2 KEY DATA FROM PRIMARY SOURCES
- TABLE 3 BIOIMPEDANCE ANALYZERS: AVERAGE PRICE RANGE, BY COMPANY
- TABLE 4 US FDA: MEDICAL DEVICE CLASSIFICATION
- TABLE 5 CANADA: LEVEL OF RISK, TIME, COST, AND COMPLEXITY OF REGISTRATION PROCESS
- TABLE 6 JAPAN: MEDICAL DEVICE CLASSIFICATION UNDER PMDA
- TABLE 7 CHINA: CLASSIFICATION OF MEDICAL DEVICES
- TABLE 8 REGULATORY AUTHORITIES
- TABLE 9 IMPORT DATA FOR INSTRUMENTS AND APPLIANCES USED IN MEDICAL, SURGICAL, OR VETERINARY SCIENCES (NES), BY COUNTRY, 2018–2022 (USD MILLION)
- TABLE 10 EXPORT DATA FOR INSTRUMENTS AND APPLIANCES USED IN MEDICAL, SURGICAL, OR VETERINARY SCIENCES (NES), BY COUNTRY, 2018–2022 (USD MILLION)
- TABLE 11 AVERAGE SELLING PRICE OF KEY PLAYERS, BY PRODUCT
- TABLE 12 BIOIMPEDANCE ANALYZERS MARKET, BY PRODUCT, 2021–2028 (USD MILLION)
- TABLE 13 MULTI-FREQUENCY BIOIMPEDANCE ANALYZERS OFFERED, BY COMPANY
- TABLE 14 MULTI-FREQUENCY BIOIMPEDANCE ANALYZERS MARKET, BY REGION, 2021–2028 (USD MILLION)
- TABLE 15 SINGLE-FREQUENCY BIOIMPEDANCE ANALYZERS OFFERED, BY COMPANY
- TABLE 16 SINGLE-FREQUENCY BIOIMPEDANCE ANALYZERS MARKET, BY REGION, 2021–2028 (USD MILLION)
- TABLE 17 DUAL-FREQUENCY BIOIMPEDANCE ANALYZERS OFFERED, BY COMPANY
- TABLE 18 DUAL-FREQUENCY BIOIMPEDANCE ANALYZERS MARKET, BY REGION, 2021–2028 (USD MILLION)
- TABLE 19 BIOIMPEDANCE ANALYZERS MARKET, BY MODALITY, 2021–2028 (USD MILLION)
- TABLE 20 WIRELESS BIOIMPEDANCE ANALYZERS MARKET, BY REGION, 2021–2028 (USD MILLION)
- TABLE 21 WIRED BIOIMPEDANCE ANALYZERS MARKET, BY REGION, 2021–2028 (USD MILLION)
- TABLE 22 BIOIMPEDANCE ANALYZERS MARKET, BY USAGE TYPE, 2021–2028 (USD MILLION)
- TABLE 23 PROFESSIONAL-GRADE BIOIMPEDANCE ANALYZERS MARKET, BY REGION, 2021–2028 (USD MILLION)
- TABLE 24 CONSUMER-GRADE BIOIMPEDANCE ANALYZERS MARKET, BY REGION, 2021–2028 (USD MILLION)
- TABLE 25 BIOIMPEDANCE ANALYZERS MARKET, BY APPLICATION, 2021–2028 (USD MILLION)
- TABLE 26 BIOIMPEDANCE ANALYZERS MARKET FOR SEGMENTAL BODY MEASUREMENT, BY REGION, 2021–2028 (USD MILLION)
- TABLE 27 BIOIMPEDANCE ANALYZERS MARKET FOR WHOLE-BODY MEASUREMENT, BY REGION, 2021–2028 (USD MILLION)
- TABLE 28 BIOIMPEDANCE ANALYZERS MARKET, BY END USER, 2021–2028 (USD MILLION)
- TABLE 29 BIOIMPEDANCE ANALYZERS MARKET FOR FITNESS CLUBS & WELLNESS CENTERS, 2021–2028 (USD MILLION)
- TABLE 30 BIOIMPEDANCE ANALYZERS MARKET FOR HOME USERS, BY REGION, 2021–2028 (USD MILLION)
- TABLE 31 BIOIMPEDANCE ANALYZERS MARKET FOR HOSPITALS & CLINICS, BY REGION, 2021–2028 (USD MILLION)
- TABLE 32 BIOIMPEDANCE ANALYZERS MARKET FOR OTHER END USERS, BY REGION, 2021–2028 (USD MILLION)
- TABLE 33 BIOIMPEDANCE ANALYZERS MARKET, BY REGION, 2021–2028 (USD MILLION)
- TABLE 34 NORTH AMERICA: BIOIMPEDANCE ANALYZERS MARKET, BY COUNTRY, 2021–2028 (USD MILLION)
- TABLE 35 NORTH AMERICA: BIOIMPEDANCE ANALYZERS MARKET, BY PRODUCT, 2021–2028 (USD MILLION)
- TABLE 36 NORTH AMERICA: BIOIMPEDANCE ANALYZERS MARKET, BY MODALITY, 2021–2028 (USD MILLION)
- TABLE 37 NORTH AMERICA: BIOIMPEDANCE ANALYZERS MARKET, BY USAGE TYPE, 2021–2028 (USD MILLION)
- TABLE 38 NORTH AMERICA: BIOIMPEDANCE ANALYZERS MARKET, BY APPLICATION, 2021–2028 (USD MILLION)
- TABLE 39 NORTH AMERICA: BIOIMPEDANCE ANALYZERS MARKET, BY END USER, 2021–2028 (USD MILLION)
- TABLE 40 US: BIOIMPEDANCE ANALYZERS MARKET, BY PRODUCT, 2021–2028 (USD MILLION)
- TABLE 41 US: BIOIMPEDANCE ANALYZERS MARKET, BY MODALITY, 2021–2028 (USD MILLION)
- TABLE 42 US: BIOIMPEDANCE ANALYZERS MARKET, BY APPLICATION, 2021–2028 (USD MILLION)
- TABLE 43 US: BIOIMPEDANCE ANALYZERS MARKET, BY END USER, 2021–2028 (USD MILLION)
- TABLE 44 CANADA: BIOIMPEDANCE ANALYZERS MARKET, BY PRODUCT, 2021–2028 (USD MILLION)
- TABLE 45 CANADA: BIOIMPEDANCE ANALYZERS MARKET, BY MODALITY, 2021–2028 (USD MILLION)
- TABLE 46 CANADA: BIOIMPEDANCE ANALYZERS MARKET, BY APPLICATION, 2021–2028 (USD MILLION)
- TABLE 47 CANADA: BIOIMPEDANCE ANALYZERS MARKET, BY END USER, 2021–2028 (USD MILLION)
- TABLE 48 EUROPE: BIOIMPEDANCE ANALYZERS MARKET, BY COUNTRY, 2021–2028 (USD MILLION)
- TABLE 49 EUROPE: BIOIMPEDANCE ANALYZERS MARKET, BY PRODUCT, 2021–2028 (USD MILLION)
- TABLE 50 EUROPE: BIOIMPEDANCE ANALYZERS MARKET, BY MODALITY, 2021–2028 (USD MILLION)
- TABLE 51 EUROPE: BIOIMPEDANCE ANALYZERS MARKET, BY USAGE TYPE, 2021–2028 (USD MILLION)
- TABLE 52 EUROPE: BIOIMPEDANCE ANALYZERS MARKET, BY APPLICATION, 2021–2028 (USD MILLION)
- TABLE 53 EUROPE: BIOIMPEDANCE ANALYZERS MARKET, BY END USER, 2021–2028 (USD MILLION)
- TABLE 54 GERMANY: BIOIMPEDANCE ANALYZERS MARKET, BY PRODUCT, 2021–2028 (USD MILLION)
- TABLE 55 GERMANY: BIOIMPEDANCE ANALYZERS MARKET, BY MODALITY, 2021–2028 (USD MILLION)
- TABLE 56 GERMANY: BIOIMPEDANCE ANALYZERS MARKET, BY APPLICATION, 2021–2028 (USD MILLION)
- TABLE 57 GERMANY: BIOIMPEDANCE ANALYZERS MARKET, BY END USER, 2021–2028 (USD MILLION)
- TABLE 58 UK: BIOIMPEDANCE ANALYZERS MARKET, BY PRODUCT, 2021–2028 (USD MILLION)
- TABLE 59 UK: BIOIMPEDANCE ANALYZERS MARKET, BY MODALITY, 2021–2028 (USD MILLION)
- TABLE 60 UK: BIOIMPEDANCE ANALYZERS MARKET, BY APPLICATION, 2021–2028 (USD MILLION)
- TABLE 61 UK: BIOIMPEDANCE ANALYZERS MARKET, BY END USER, 2021–2028 (USD MILLION)
- TABLE 62 FRANCE: BIOIMPEDANCE ANALYZERS MARKET, BY PRODUCT, 2021–2028 (USD MILLION)
- TABLE 63 FRANCE: BIOIMPEDANCE ANALYZERS MARKET, BY MODALITY, 2021–2028 (USD MILLION)
- TABLE 64 FRANCE: BIOIMPEDANCE ANALYZERS MARKET, BY APPLICATION, 2021–2028 (USD MILLION)
- TABLE 65 FRANCE: BIOIMPEDANCE ANALYZERS MARKET, BY END USER, 2021–2028 (USD MILLION)
- TABLE 66 REST OF EUROPE: BIOIMPEDANCE ANALYZERS MARKET, BY PRODUCT, 2021–2028 (USD MILLION)
- TABLE 67 REST OF EUROPE: BIOIMPEDANCE ANALYZERS MARKET, BY MODALITY, 2021–2028 (USD MILLION)
- TABLE 68 REST OF EUROPE: BIOIMPEDANCE ANALYZERS MARKET, BY APPLICATION, 2021–2028 (USD MILLION)
- TABLE 69 REST OF EUROPE: BIOIMPEDANCE ANALYZERS MARKET, BY END USER, 2021–2028 (USD MILLION)
- TABLE 70 ASIA PACIFIC: BIOIMPEDANCE ANALYZERS MARKET, BY COUNTRY, 2021–2028 (USD MILLION)
- TABLE 71 ASIA PACIFIC: BIOIMPEDANCE ANALYZERS MARKET, BY PRODUCT, 2021–2028 (USD MILLION)
- TABLE 72 ASIA PACIFIC: BIOIMPEDANCE ANALYZERS MARKET, BY MODALITY, 2021–2028 (USD MILLION)
- TABLE 73 ASIA PACIFIC: BIOIMPEDANCE ANALYZERS MARKET, BY USAGE TYPE, 2021–2028 (USD MILLION)
- TABLE 74 ASIA PACIFIC: BIOIMPEDANCE ANALYZERS MARKET, BY APPLICATION, 2021–2028 (USD MILLION)
- TABLE 75 ASIA PACIFIC: BIOIMPEDANCE ANALYZERS MARKET, BY END USER, 2021–2028 (USD MILLION)
- TABLE 76 JAPAN: BIOIMPEDANCE ANALYZERS MARKET, BY PRODUCT, 2021–2028 (USD MILLION)
- TABLE 77 JAPAN: BIOIMPEDANCE ANALYZERS MARKET, BY MODALITY, 2021–2028 (USD MILLION)
- TABLE 78 JAPAN: BIOIMPEDANCE ANALYZERS MARKET, BY APPLICATION, 2021–2028 (USD MILLION)
- TABLE 79 JAPAN: BIOIMPEDANCE ANALYZERS MARKET, BY END USER, 2021–2028 (USD MILLION)
- TABLE 80 CHINA: BIOIMPEDANCE ANALYZERS MARKET, BY PRODUCT, 2021–2028 (USD MILLION)
- TABLE 81 CHINA: BIOIMPEDANCE ANALYZERS MARKET, BY MODALITY, 2021–2028 (USD MILLION)
- TABLE 82 CHINA: BIOIMPEDANCE ANALYZERS MARKET, BY APPLICATION, 2021–2028 (USD MILLION)
- TABLE 83 CHINA: BIOIMPEDANCE ANALYZERS MARKET, BY END USER, 2021–2028 (USD MILLION)
- TABLE 84 AUSTRALIA: BIOIMPEDANCE ANALYZERS MARKET, BY PRODUCT, 2021–2028 (USD MILLION)
- TABLE 85 AUSTRALIA: BIOIMPEDANCE ANALYZERS MARKET, BY MODALITY, 2021–2028 (USD MILLION)
- TABLE 86 AUSTRALIA: BIOIMPEDANCE ANALYZERS MARKET, BY APPLICATION, 2021–2028 (USD MILLION)
- TABLE 87 AUSTRALIA: BIOIMPEDANCE ANALYZERS MARKET, BY END USER, 2021–2028 (USD MILLION)
- TABLE 88 PHILIPPINES: BIOIMPEDANCE ANALYZERS MARKET, BY PRODUCT, 2021–2028 (USD MILLION)
- TABLE 89 PHILIPPINES: BIOIMPEDANCE ANALYZERS MARKET, BY MODALITY, 2021–2028 (USD MILLION)
- TABLE 90 PHILIPPINES: BIOIMPEDANCE ANALYZERS MARKET, BY APPLICATION, 2021–2028 (USD MILLION)
- TABLE 91 PHILIPPINES: BIOIMPEDANCE ANALYZERS MARKET, BY END USER, 2021–2028 (USD MILLION)
- TABLE 92 TAIWAN: BIOIMPEDANCE ANALYZERS MARKET, BY PRODUCT, 2021–2028 (USD MILLION)
- TABLE 93 TAIWAN: BIOIMPEDANCE ANALYZERS MARKET, BY MODALITY, 2021–2028 (USD MILLION)
- TABLE 94 TAIWAN: BIOIMPEDANCE ANALYZERS MARKET, BY APPLICATION, 2021–2028 (USD MILLION)
- TABLE 95 TAIWAN: BIOIMPEDANCE ANALYZERS MARKET, BY END USER, 2021–2028 (USD MILLION)
- TABLE 96 REST OF ASIA PACIFIC: BIOIMPEDANCE ANALYZERS MARKET, BY PRODUCT, 2021–2028 (USD MILLION)
- TABLE 97 REST OF ASIA PACIFIC: BIOIMPEDANCE ANALYZERS MARKET, BY MODALITY, 2021–2028 (USD MILLION)
- TABLE 98 REST OF ASIA PACIFIC: BIOIMPEDANCE ANALYZERS MARKET, BY APPLICATION, 2021–2028 (USD MILLION)
- TABLE 99 REST OF ASIA PACIFIC: BIOIMPEDANCE ANALYZERS MARKET, BY END USER, 2021–2028 (USD MILLION)
- TABLE 100 REST OF THE WORLD: BIOIMPEDANCE ANALYZERS MARKET, BY PRODUCT, 2021–2028 (USD MILLION)
- TABLE 101 REST OF THE WORLD: BIOIMPEDANCE ANALYZERS MARKET, BY MODALITY, 2021–2028 (USD MILLION)
- TABLE 102 REST OF THE WORLD: BIOIMPEDANCE ANALYZERS MARKET, BY APPLICATION, 2021–2028 (USD MILLION)
- TABLE 103 REST OF THE WORLD: BIOIMPEDANCE ANALYZERS MARKET, BY END USER, 2021–2028 (USD MILLION)
- TABLE 104 OVERVIEW OF STRATEGIES DEPLOYED BY KEY COMPANIES
- TABLE 105 BIOIMPEDANCE ANALYZERS MARKET: DEGREE OF COMPETITION
- TABLE 106 BIOIMPEDANCE ANALYZERS MARKET: COMPETITIVE BENCHMARKING OF KEY PLAYERS
- TABLE 107 PRODUCT FOOTPRINT ANALYSIS
- TABLE 108 REGIONAL FOOTPRINT ANALYSIS
- TABLE 109 BIOIMPEDANCE ANALYZERS MARKET: DETAILED LIST OF KEY START-UPS/SMES
- TABLE 110 PRODUCT LAUNCHES, 2020–2023
- TABLE 111 DEALS, 2020–2023
- TABLE 112 OTHER DEVELOPMENTS, 2020–2023
- TABLE 113 OMRON CORPORATION: BUSINESS OVERVIEW
- TABLE 114 TANITA CORPORATION: BUSINESS OVERVIEW
- TABLE 115 INBODY CO., LTD.: BUSINESS OVERVIEW
- TABLE 116 INBODY CO., LTD.: DEALS
- TABLE 117 INBODY CO., LTD.: OTHER DEVELOPMENTS
- TABLE 118 RJL SYSTEMS, INC.: BUSINESS OVERVIEW
- TABLE 119 SECA GMBH & CO. KG: BUSINESS OVERVIEW
- TABLE 120 EVOLT 360: BUSINESS OVERVIEW
- TABLE 121 SELVAS HEALTHCARE: BUSINESS OVERVIEW
- TABLE 122 FOOK TIN GROUP HOLDINGS LTD.: BUSINESS OVERVIEW
- TABLE 123 BODYSTAT LTD.: BUSINESS OVERVIEW
- TABLE 124 BODYSTAT LTD.: PRODUCT LAUNCHES
- TABLE 125 CHARDER ELECTRONIC CO., LTD.: BUSINESS OVERVIEW
- TABLE 126 MALTRON INTERNATIONAL: BUSINESS OVERVIEW
- FIGURE 1 BIOIMPEDANCE ANALYZERS MARKET: RESEARCH DESIGN METHODOLOGY
- FIGURE 2 PRIMARY SOURCES
- FIGURE 3 BREAKDOWN OF PRIMARY INTERVIEWS: SUPPLY-SIDE AND DEMAND-SIDE PARTICIPANTS
- FIGURE 4 BREAKDOWN OF PRIMARY INTERVIEWS: BY COMPANY TYPE, DESIGNATION, AND REGION
- FIGURE 5 BOTTOM-UP APPROACH: COMPANY REVENUE ESTIMATION APPROACH
- FIGURE 6 CAGR PROJECTIONS: SUPPLY-SIDE ANALYSIS
- FIGURE 7 MARKET SIZE ESTIMATION: TOP-DOWN APPROACH
- FIGURE 8 DATA TRIANGULATION METHODOLOGY
- FIGURE 9 BIOIMPEDANCE ANALYZERS MARKET, BY PRODUCT, 2023 VS. 2028 (USD BILLION)
- FIGURE 10 BIOIMPEDANCE ANALYZERS MARKET, BY MODALITY, 2023 VS. 2028 (USD BILLION)
- FIGURE 11 BIOIMPEDANCE ANALYZERS MARKET, BY USAGE TYPE, 2023 VS. 2028 (USD BILLION)
- FIGURE 12 BIOIMPEDANCE ANALYZERS MARKET, BY APPLICATION, 2023 VS. 2028 (USD BILLION)
- FIGURE 13 BIOIMPEDANCE ANALYZERS MARKET, BY END USER, 2023 VS. 2028 (USD BILLION)
- FIGURE 14 BIOIMPEDANCE ANALYZERS MARKET: GEOGRAPHICAL SNAPSHOT
- FIGURE 15 INCREASED PREVALENCE OF OBESITY TO DRIVE BIOIMPEDANCE ANALYZERS MARKET
- FIGURE 16 MULTI-FREQUENCY BIOIMPEDANCE ANALYZERS ACCOUNTED FOR LARGEST SHARE IN 2022
- FIGURE 17 CHINA TO REGISTER HIGHEST GROWTH RATE DURING FORECAST PERIOD
- FIGURE 18 ASIA PACIFIC MARKET TO WITNESS FASTEST GROWTH DURING FORECAST PERIOD
- FIGURE 19 EMERGING ECONOMIES TO REGISTER HIGHER GROWTH DURING FORECAST PERIOD
- FIGURE 20 BIOIMPEDANCE ANALYZERS MARKET DYNAMICS
- FIGURE 21 DIRECT DISTRIBUTION—PREFERRED STRATEGY OF PROMINENT COMPANIES
- FIGURE 22 BIOIMPEDANCE ANALYZERS MARKET: VALUE CHAIN ANALYSIS
- FIGURE 23 BIOIMPEDANCE ANALYZERS MARKET: ECOSYSTEM ANALYSIS
- FIGURE 24 BIOIMPEDANCE ANALYZERS MARKET ECOSYSTEM: KEY PLAYERS
- FIGURE 25 PATENT ANALYSIS FOR BIOIMPEDANCE ANALYZERS (JANUARY 2013–NOVEMBER 2022)
- FIGURE 26 REVENUE SHIFT FOR BIOIMPEDANCE ANALYZERS
- FIGURE 27 US: NUMBER OF HEALTH CLUBS, 2012–2022
- FIGURE 28 NORTH AMERICA: BIOIMPEDANCE ANALYZERS MARKET SNAPSHOT
- FIGURE 29 ASIA PACIFIC: BIOIMPEDANCE ANALYZERS MARKET SNAPSHOT
- FIGURE 30 BIOIMPEDANCE ANALYZERS MARKET: COMPANY EVALUATION MATRIX, 2022
- FIGURE 31 BIOIMPEDANCE ANALYZERS MARKET: COMPANY EVALUATION MATRIX FOR START-UPS/SMES, 2022
- FIGURE 32 OMRON CORPORATION: COMPANY SNAPSHOT (2022)
The objective of the study is to analyze the key market dynamics, such as drivers, opportunities, challenges, restraints, and key player strategies. To track company developments such as acquisitions, product launches, expansions, collaborations, agreements, and partnerships of the leading players, the competitive landscape of the bioimpedance analyzers market to analyze market players on various parameters within the broad categories of business and product strategy. Top-down and bottom-up approaches were used to estimate the market size. To estimate the market size of segments and subsegments, the market breakdown and data triangulation were used.
The four steps involved in estimating the market size are
Collecting Secondary Data
The secondary research data collection process involves the usage of secondary sources, directories, databases (such as Bloomberg Businessweek, Factiva, and D&B), annual reports, investor presentations, and SEC filings of companies. Secondary research was used to identify and collect information useful for the extensive, technical, market-oriented, and commercial study of the bioimpedance analyzers market. A database of the key industry leaders was also prepared using secondary research.
Collecting Primary Data
The primary research data was conducted after acquiring knowledge about the bioimpedance analyzers market scenario through secondary research. A significant number of primary interviews were conducted with stakeholders from both the demand side (such as hospitals, clinics, fitness centers, home users, and academic & research institutes) and supply side (such as included various industry experts, such as Directors, Chief X Officers (CXOs), Vice Presidents (VPs) from business development, marketing, and product development teams, product manufacturers, wholesalers, channel partners, and distributors) across major countries of North America, Europe, Asia Pacific, the Middle East & Africa, and Latin America. Approximately 40% of the primary interviews were conducted with stakeholders from the demand side, while those from the supply side accounted for the remaining 60%. Primary data for this report was collected through questionnaires, emails, and telephonic interviews.
A breakdown of the primary respondents is provided below:
Breakdown of Primary Participants
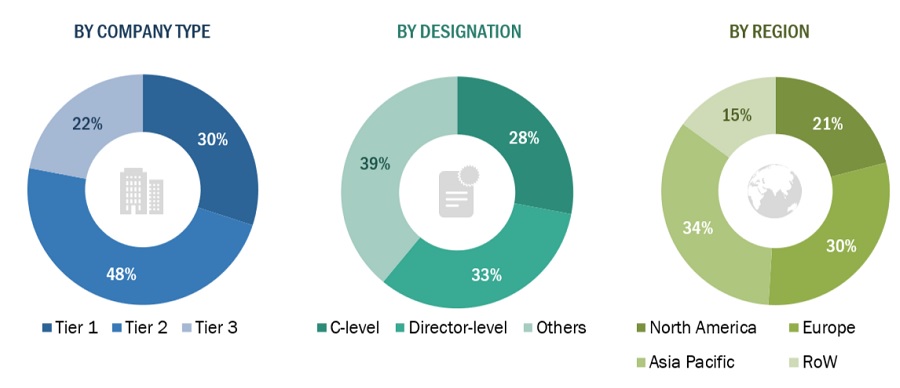
Note 1: *Others include sales managers, marketing managers, and product managers.
Note 2: Tiers are defined based on a company’s total revenue as of 2022: Tier 1=> USD 1 billion, Tier 2 = USD 500 million to USD 1 billion, and Tier 3=< USD 500 million.
To know about the assumptions considered for the study, download the pdf brochure
Market Size Estimation
All major product manufacturers offering various bioimpedance analyzers were identified at the global/regional level. Revenue mapping was done for the major players and was extrapolated to arrive at the global market value of each type of segment. The market value bioimpedance analyzers market was also split into various segments and subsegments at the region and country level based on:
- Product mapping of various manufacturers for each type of bioimpedance analyzers market at the regional and country-level
- Relative adoption pattern of each bioimpedance analyzers market among key application segments at the regional and/or country-level
- Detailed primary research to gather qualitative and quantitative information related to segments and subsegments at the regional and/or country level.
- Detailed secondary research to gauge the prevailing market trends at the regional and/or country-level
Global Bioimpedance analyzers Market Size: Top Down Approach

To know about the assumptions considered for the study, Request for Free Sample Report
Global Bioimpedance analyzers Market Size: Bottom-Up Approach
Data Triangulation
After arriving at the overall market size—using the market size estimation processes—the market was split into several segments and subsegments. To complete the overall market engineering process and arrive at the exact statistics of each market segment and subsegment, data triangulation and market breakdown procedures were employed, wherever applicable. The data was triangulated by studying various factors and trends from both the demand and supply sides in the Bioimpedance analyzers industry.
Market Definition
Bioimpedance analysis (also known as bioelectric impedance analysis) is a method of assessing body composition, which measures body fat in relation to lean body mass. It determines the resistance to the flow of electric current as it passes through the body. Bioimpedance analyzers are medical devices that are used to measure the impedance of biological tissues. The opposition that tissue or substance presents to the flow of an alternating electrical current is known as impedance.
Key Stakeholders
- Senior Management
- Finance/Procurement Department
- Nutritionist/Dietitian/Physiotherapist/Fitness Trainer
Report Objectives
- To provide detailed information about the factors influencing the market growth (such as drivers, restraints, opportunities, and challenges)
- To define, describe, segment, and forecast the bioimpedance analyzers market by product, modality, usage type, application, end-user, and region
- To analyze market opportunities for stakeholders and provide details of the competitive landscape for key players
- To analyze micro markets with respect to individual growth trends, prospects, and contributions to the overall bioimpedance analyzers market
- To forecast the size of the bioimpedance analyzers market in five main regions along with their respective key countries, namely, North America, Europe, the Asia Pacific, Rest of the world.
- To profile key players in the bioimpedance analyzers market and comprehensively analyze their core competencies and market shares
- To track and analyze competitive developments, such as acquisitions; product launches; expansions; collaborations, agreements, & partnerships; and R&D activities of the leading players in the bioimpedance analyzers market.
- To benchmark players within the bioimpedance analyzers market using the Competitive Leadership Mapping framework, which analyzes market players on various parameters within the broad categories of business and product strategy
Available Customizations
MarketsandMarkets offers the following customizations for this market report:
- Additional country-level analysis of the Bioimpedance analyzers market
- Profiling of additional market players (up to 5)
Product Analysis
- Product matrix, which provides a detailed comparison of the product portfolio of each company in the Bioimpedance Analyzers Market


 Generating Response ...


Growth opportunities and latent adjacency in Bioimpedance Analyzers Market