Benzoates Market

Benzoates Market by Type (Potassium Benzoate, Sodium Benzoate, Ammonium Benzoate), End-Use (Food & Beverage, Pharmaceutical, Personal Care), and Region (North America, Europe, Asia Pacific, Rest of the World) - Global Forecast to 2027

Report Code: CH 8493 Dec, 2022, by marketsandmarkets.com

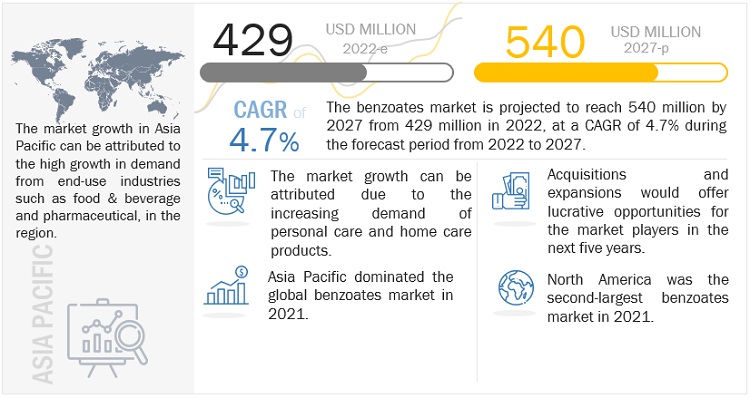
The benzoates market is projected to reach USD 540 million by 2027, at a CAGR of 4.7%. Factors such as the increasing demand for personal care and home care products are driving the benzoates market. Also, the demand of non-alcoholic, sugar-free products will fuel the benzoates market growth.

Global Benzoates Market Trends
Benzoates Market

To know about the assumptions considered for the study, Request for Free Sample Report

Benzoates Market Dynamics

Driver: Growth in demand of personal care and home care products 

A wide range of cosmetics and personal care items, such as baby products, soaps and detergents, bath products, cleansing products, eye makeup, as well as nail, hair, and skin care items, use benzoate as an ingredient. Preservatives are required in cosmetics and hair care products to prevent the growth of microorganisms. Along with the US, Europe has one of the largest markets for cosmetic products globally, with market size of around USD 94.6 billion in 2021. Apart from preservatives, benzoates are used as aversive additives. In order to discourage oral consumption, home care products, including window cleaners, antiseptics, and laundry detergent, contain a small amount of benzoate. Thus, the growing demand of personal care and home care products is driving the benzoates market.

Restraints: Regulations to limit use of benzoates in packaged food items & beverages

There are numerous concerns regarding the harmful effects on human health caused by the excess consumption of benzoates. Formulation and implementation of various regulations limiting the quantity of benzoates in foods items & beverages have led to uncertainties among manufacturers of benzoates, who need guidance regarding the regulations related to the use of benzoates in food items & beverages. The legal limits and regulations for benzoates as a food preservative vary from country to country, depending upon the weather and environmental conditions. Hence, such limitations and regulations restrain the market growth for benzoates.

Opportunity: Use of benzoates in animal nutrition

Due to the harmful impact of conventional feed additives on animal growth and health, there has been a demand for safe and effective feed additives, which not only result into faster animal growth but also ensures the good health of animals. Benzoate has been discovered to be effective in animal feed and has an anti-diarrhea effect in animal breeding. Additionally, when treating diseased animals, adding benzoate to their diets can considerably increase appetite and boost productivity. Hence, the use of benzoates in animal nutrition provides growth opportunity for the market.

Challenge: Expected increase in usage of natural preservative in food & beverage market may impact the benzoates market

Benzoates are widely used as a preservative. However, the growing awareness on the use of synthetic food additives and their side effects is posing a challenge to the benzoates market. The demand of foods with natural ingredients are increasing, globally. The food industry is considering plant-based alternatives to prevent the growth of germs and rotting. Thus, the shift of consumer preference towards natural additives in food items is favoring the growth of natural food additives market, which can disrupt the benzoate market.

Based on type, sodium benzoate segment is the largest market during the forecast period

The sodium benzoate segment accounted for the largest share in 2021 in terms of value. Food spoilage is prevented by sodium benzoate, which prevents the growth of bacteria, mold, and other germs. It works well with acidic foods and hence is generally used in pickles, soda, jelly, soy sauce, bottled lemon juice, salad dressing. Thus, the growing usage of sodium benzoate in food & beverage along with a wide range of other application is expected to enhance the demand for the segment.

Based on end-use, food & beverage segment is the largest market during the forecast period

The food & beverage segment accounted for the largest share, by end-use during the forecast period, in terms of value. Due to the growing population, there is a significant increase in the demand for food & beverage. Global market of food & beverage is expected to increase significantly from 2021 to 2025. There is also increasing demand for ready to eat food in countries such as China and India due to changing lifestyle majorly in urban areas. Benzoates help to increase the shelf life of food products and beverages. Thus, growth in food industry will enhance the demand for food preservatives, creating the market for benzoates.

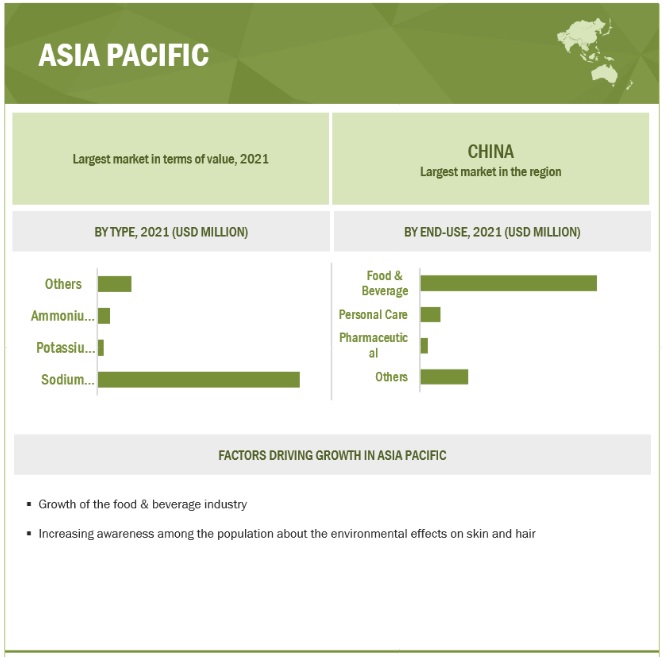
Asia Pacific is the largest benzoates market in terms of value

Asia Pacific is the largest benzoates market followed by North America, in terms of value, in 2021. The major economies of the Asia Pacific region contributing significantly to the growth of the benzoates market are China, Japan, India, and South Korea. The region has emerged as an important consumer of benzoates due to the increasing demand from food & beverage industry, aided by rise in the standard of living of the people and disposable income. This further increases the growth of benzoates market in Asia Pacific.
Benzoates Market by Region

Source: Secondary Research, Expert Interviews, and MarketsandMarkets Analysis

To know about the assumptions considered for the study, download the pdf brochure

Key Market Players

Major companies in the benzoates market include LANXESS (Germany), Wuhan Youji Industries Co., Ltd. (China), Tengzhou Tenglong Chemical Co., Ltd. (China), Eastman Chemical Company (US), A.M Food Chemical Co., Limited (China), FBC Industries (US), Ganesh Benzoplast Limited (India), among others. A total of 21 major players have been covered. These players have adopted partnerships, acquisitions, and expansions as the major strategies to consolidate their position in the market.

Want to explore hidden markets that can drive new revenue in Benzoates Market?

Scope of the Report

Report Metric

Details

Market Size Available for Years

2018-2027

Base Year Considered

2021

Forecast Period

2022-2027

Forecast Units

Value (USD Million)

Segments Covered

Type, End-use, and Region

Geographies Covered

Asia Pacific, Europe, North America, Rest of the World

Companies Covered

The major market players include LANXESS (Germany), Wuhan Youji Industries Co., Ltd. (China), Tengzhou Tenglong Chemical Co., Ltd. (China), Eastman Chemical Company (US), Vertellus (US), Spectrum Chemical Mfg. Corp. (US), Merck KGaA (Germany), Tokyo Chemical Industry Co., Ltd. (Japan), Ganesh Benzoplast Limited (India), among others.
(Total of 21 companies)

This research report categorizes the Benzoates market based on Type, End-use, and Region.

Based on type, the benzoates market has been segmented as follows:
  • Potassium Benzoate
  • Sodium Benzoate
  • Ammonium Benzoate
  • Others
Based on end-use, the benzoates market has been segmented as follows:
  • Food & Beverage
  • Pharmaceutical
  • Personal Care
  • Others
Based on Region, the benzoates market has been segmented as follows:
  • Asia Pacific
  • Europe
  • North America
  • Rest of the World

Recent Developments

  • In January 2022, Wuhan Youji Industries Co., Ltd. announced the completion of its Wuhan production plant expansion and commencement of production in January. The plant is mainly designed to produce feed-grade benzoic acid products.
  • In August 2021, LANXESS completed the acquisition of Emerald Kalama Chemical. The acquisition enabled LANXESS to significantly expand its portfolio of preservatives. Key products for the food industry include sodium and potassium benzoate under the Kalama, Purox and Kalaguard brands.
  • In April 2021, Eastman Chemical Company acquired 3F Feed & Food, a European pioneer in the technological and commercial advancement of additives for animal feed and human food.

Frequently Asked Questions (FAQ):

To speak to our analyst for a discussion on the above findings, click Speak to Analyst

Exclusive indicates content/data unique to MarketsandMarkets and not available with any competitors.

TABLE OF CONTENTS
 
1 INTRODUCTION (Page No. - 20)
    1.1 STUDY OBJECTIVES 
    1.2 MARKET DEFINITION 
           1.2.1 INCLUSIONS & EXCLUSIONS
                    TABLE 1 BENZOATES MARKET: INCLUSIONS & EXCLUSIONS
    1.3 MARKET SCOPE 
          FIGURE 1 BENZOATES MARKET SEGMENTATION
           1.3.1 REGIONS COVERED
           1.3.2 YEARS CONSIDERED
    1.4 CURRENCY CONSIDERED 
    1.5 UNITS CONSIDERED 
    1.6 RESEARCH LIMITATIONS 
    1.7 STAKEHOLDERS 
 
2 RESEARCH METHODOLOGY (Page No. - 24)
    2.1 RESEARCH DATA 
          FIGURE 2 BENZOATES MARKET: RESEARCH DESIGN
           2.1.1 SECONDARY DATA
                    2.1.1.1 Key data from secondary sources
           2.1.2 PRIMARY DATA
                    2.1.2.1 Key data from primary sources
                    2.1.2.2 Participating companies in primary research
                    2.1.2.3 Breakdown of primary interviews
    2.2 MATRIX CONSIDERED FOR DEMAND SIDE ESTIMATION 
          FIGURE 3 MATRIX CONSIDERED FOR ESTIMATING DEMAND FOR BENZOATES
    2.3 MARKET SIZE ESTIMATION 
           2.3.1 BOTTOM-UP APPROACH
                    FIGURE 4 MARKET SIZE ESTIMATION: BOTTOM-UP APPROACH
           2.3.2 TOP-DOWN APPROACH
                    FIGURE 5 MARKET SIZE ESTIMATION: TOP-DOWN APPROACH
    2.4 METHODOLOGY FOR SUPPLY-SIDE SIZING OF BENZOATES MARKET (1/2) 
    2.5 METHODOLOGY FOR SUPPLY-SIDE SIZING OF BENZOATES MARKET (2/2) 
           2.5.1 SUPPLY-SIDE ANALYSIS
           2.5.2 GROWTH RATE ASSUMPTIONS/GROWTH FORECAST
    2.6 DATA TRIANGULATION 
          FIGURE 6 BENZOATES MARKET: DATA TRIANGULATION
    2.7 KEY ASSUMPTIONS FOR CALCULATION OF DEMAND-SIDE MARKET SIZE 
    2.8 LIMITATIONS 
    2.9 RISK ANALYSIS 
 
3 EXECUTIVE SUMMARY (Page No. - 32)
    TABLE 2 BENZOATES MARKET SNAPSHOT: 2022 VS. 2027
    FIGURE 7 SODIUM BENZOATE SEGMENT TO DOMINATE MARKET BETWEEN 2022 AND 2027
    FIGURE 8 FOOD & BEVERAGE SEGMENT TO LEAD OVERALL MARKET BETWEEN 2022 AND 2027
    FIGURE 9 ASIA PACIFIC TO DOMINATE MARKET DURING FORECAST PERIOD
 
4 PREMIUM INSIGHTS (Page No. - 36)
    4.1 SIGNIFICANT OPPORTUNITIES FOR PLAYERS IN BENZOATES MARKET 
          FIGURE 10 BENZOATES MARKET TO WITNESS MODERATE GROWTH BETWEEN 2022 AND 2027
    4.2 BENZOATES MARKET, BY TYPE 
          FIGURE 11 SODIUM BENZOATE SEGMENT TO ACCOUNT FOR LARGEST SHARE IN 2021
    4.3 BENZOATES MARKET, BY MAJOR COUNTRIES 
          FIGURE 12 SOUTH KOREA TO GROW AT HIGHEST RATE DURING FORECAST PERIOD
 
5 MARKET OVERVIEW (Page No. - 38)
    5.1 INTRODUCTION 
    5.2 MARKET DYNAMICS 
          FIGURE 13 DRIVERS, RESTRAINTS, OPPORTUNITIES, AND CHALLENGES IN BENZOATES MARKET
           5.2.1 DRIVERS
                    5.2.1.1 Growth in demand for personal care and home care products
                    5.2.1.2 High demand from non-alcoholic, sugar-free products
           5.2.2 RESTRAINTS
                    5.2.2.1 Regulations to limit use of benzoates in packaged food items & beverages
           5.2.3 OPPORTUNITIES
                    5.2.3.1 Use of benzoates in animal nutrition
                    5.2.3.2 Use of benzoates in industrial applications
           5.2.4 CHALLENGES
                    5.2.4.1 Increase in use of natural preservatives in food & beverages
    5.3 VALUE CHAIN ANALYSIS 
          FIGURE 14 BENZOATES MARKET: VALUE CHAIN ANALYSIS
    5.4 ECOSYSTEM 
          FIGURE 15 ECOSYSTEM MAP OF BENZOATES MARKET
          TABLE 3 BENZOATES MARKET: ECOSYSTEM
    5.5 PORTER'S FIVE FORCES ANALYSIS 
          FIGURE 16 PORTER'S FIVE FORCES ANALYSIS: BENZOATES MARKET
          TABLE 4 BENZOATES MARKET: PORTER'S FIVE FORCES ANALYSIS
           5.5.1 BARGAINING POWER OF SUPPLIERS
           5.5.2 BARGAINING POWER OF BUYERS
           5.5.3 THREAT OF SUBSTITUTES
           5.5.4 THREAT OF NEW ENTRANTS
           5.5.5 INTENSITY OF COMPETITIVE RIVALRY
    5.6 PATENT ANALYSIS 
           5.6.1 INTRODUCTION
           5.6.2 METHODOLOGY
           5.6.3 DOCUMENT TYPE
                    FIGURE 17 NUMBER OF GRANTED PATENTS, PATENT APPLICATIONS, AND LIMITED PATENTS
                    FIGURE 18 PUBLICATION TRENDS (2012–2021)
           5.6.4 INSIGHTS
                    FIGURE 19 LEGAL STATUS OF PATENTS
           5.6.5 JURISDICTION ANALYSIS
                    FIGURE 20 TOP JURISDICTION, BY DOCUMENT
           5.6.6 TOP COMPANIES/APPLICANTS
                    FIGURE 21 TOP 10 COMPANIES/APPLICANTS WITH HIGHEST NUMBER OF PATENTS
                    TABLE 5 LIST OF PATENTS BY KEMPHARM, INC.
                    TABLE 6 LIST OF PATENTS BY BEIERSDORF AG
                    TABLE 7 TOP 10 PATENT OWNERS, 2012–2021
    5.7 POLICIES AND REGULATIONS 
           5.7.1 FDA REGULATIONS
           5.7.2 REGULATIONS BY FDA IN US
           5.7.3 EUROPEAN COMMISSION'S SCIENTIFIC COMMITTEE
                    FIGURE 22 COMMISSION IMPLEMENTING REGULATION (EU) 2016/2023, CONCERNING THE AUTHORISATION OF SODIUM BENZOATE, POTASSIUM SORBATE, FORMIC ACID AND SODIUM FORMATE AS FEED ADDITIVES FOR ALL ANIMAL SPECIES
           5.7.4 EUROPEAN FOOD SAFETY AUTHORITY (EFSA)
           5.7.5 CHINA
           5.7.6 INDIA
                    TABLE 8 FOOD SAFETY AND STANDARDS (HEALTH SUPPLEMENTS, NUTRACEUTICALS, FOOD FOR SPECIAL DIETARY USE, FOOD FOR SPECIAL MEDICAL PURPOSE, FUNCTIONAL FOOD AND NOVEL FOOD) REGULATIONS
    5.8 CASE STUDY ANALYSIS 
           5.8.1 SODIUM BENZOATE-INFUSED DENDRIMER ANTISCALANT
    5.9 TRADE DATA 
          TABLE 9 EXPORT DATA OF BENZOATES (2021)
          TABLE 10 IMPORT DATA OF BENZOATES (2021)
    5.10 PRICING ANALYSIS 
           FIGURE 23 BENZOATES MARKET: AVERAGE PRICE TREND OF BENZOATES
 
6 MANUFACTURING PROCESS (Page No. - 56)
    6.1 INTRODUCTION 
    6.2 SODIUM BENZOATE 
    6.3 POTASSIUM BENZOATE 
    6.4 AMMONIUM BENZOATE 
 
7 BENZOATES MARKET, BY TYPE (Page No. - 57)
    7.1 INTRODUCTION 
          FIGURE 24 SODIUM BENZOATE SEGMENT TO ACCOUNT FOR LARGEST MARKET SHARE DURING FORECAST PERIOD
          TABLE 11 BENZOATES MARKET SIZE, BY TYPE, 2018–2021 (USD MILLION)
          TABLE 12 BENZOATES MARKET SIZE, BY TYPE, 2022–2027 (USD MILLION)
          TABLE 13 BENZOATES MARKET SIZE, BY TYPE, 2018–2021 (TON)
          TABLE 14 BENZOATES MARKET SIZE, BY TYPE, 2022–2027 (TON)
    7.2 POTASSIUM BENZOATE 
           7.2.1 HIGH DEMAND FROM FOOD & BEVERAGES SECTOR TO DRIVE DEMAND
    7.3 SODIUM BENZOATE 
           7.3.1 SODIUM BENZOATE MOSTLY USED AS ANTIMICROBIAL PRESERVATIVE IN FOOD & BEVERAGES
    7.4 AMMONIUM BENZOATE 
           7.4.1 AMMONIUM BENZOATE COMMONLY USED FOR ITS CORROSION INHIBITOR PROPERTY
    7.5 OTHERS 
 
8 BENZOATES MARKET, BY END-USE (Page No. - 61)
    8.1 INTRODUCTION 
          FIGURE 25 FOOD & BEVERAGE TO BE LARGEST END USER DURING FORECAST PERIOD
          TABLE 15 BENZOATES MARKET SIZE, BY END-USE, 2018–2021 (USD MILLION)
          TABLE 16 BENZOATES MARKET SIZE, BY END-USE, 2022–2027 (USD MILLION)
    8.2 FOOD & BEVERAGE 
           8.2.1 ANTIMICROBIAL PROPERTY OF BENZOATES TO FUEL DEMAND
    8.3 PHARMACEUTICAL 
           8.3.1 BENZOATES USED AS PRESERVATIVES IN PHARMACEUTICAL PRODUCTS
    8.4 PERSONAL CARE 
           8.4.1 SODIUM BENZOATE USED AS FRAGRANCE INGREDIENT IN COSMETICS
    8.5 OTHERS 
 
9 BENZOATES MARKET, BY REGION (Page No. - 64)
    9.1 INTRODUCTION 
          FIGURE 26 ASIA PACIFIC TO BE LARGEST MARKET DURING FORECAST PERIOD
          TABLE 17 BENZOATES MARKET SIZE, BY REGION, 2018–2021 (USD MILLION)
          TABLE 18 BENZOATES MARKET SIZE, BY REGION, 2022–2027 (USD MILLION)
    9.2 ASIA PACIFIC 
          FIGURE 27 ASIA PACIFIC: BENZOATES MARKET SNAPSHOT
          TABLE 19 ASIA PACIFIC: BENZOATES MARKET SIZE, BY TYPE, 2018–2021 (USD MILLION)
          TABLE 20 ASIA PACIFIC: BENZOATES MARKET SIZE, BY TYPE, 2022–2027 (USD MILLION)
          TABLE 21 ASIA PACIFIC: BENZOATES MARKET SIZE, BY END-USE, 2018–2021 (USD MILLION)
          TABLE 22 ASIA PACIFIC: BENZOATES MARKET SIZE, BY END-USE, 2022–2027 (USD MILLION)
          TABLE 23 ASIA PACIFIC: BENZOATES MARKET SIZE, BY COUNTRY, 2018–2021 (USD MILLION)
          TABLE 24 ASIA PACIFIC: BENZOATES MARKET SIZE, BY COUNTRY, 2022–2027 (USD MILLION)
           9.2.1 CHINA
                    9.2.1.1 Rise in demand for packaged food & beverages to drive market
                                TABLE 25 CHINA: BENZOATES MARKET SIZE, BY END-USE, 2018–2021 (USD MILLION)
                                TABLE 26 CHINA: BENZOATES MARKET SIZE, BY END-USE, 2022–2027 (USD MILLION)
           9.2.2 INDIA
                    9.2.2.1 Growth of paint industry to fuel demand for benzoates
                                TABLE 27 INDIA: BENZOATES MARKET SIZE, BY END-USE, 2018–2021 (USD MILLION)
                                TABLE 28 INDIA: BENZOATES MARKET SIZE, BY END-USE, 2022–2027 (USD MILLION)
           9.2.3 JAPAN
                    9.2.3.1 Growth in consumption of packaged food to drive market
                                TABLE 29 JAPAN: BENZOATES MARKET SIZE, BY END-USE, 2018–2021 (USD MILLION)
                                TABLE 30 JAPAN: BENZOATES MARKET SIZE, BY END-USE, 2022–2027 (USD MILLION)
           9.2.4 SOUTH KOREA
                    9.2.4.1 Growing pharma sector fueling market growth
                                TABLE 31 SOUTH KOREA: BENZOATES MARKET SIZE, BY END-USE, 2018–2021 (USD MILLION)
                                TABLE 32 SOUTH KOREA: BENZOATES MARKET SIZE, BY END-USE, 2022–2027 (USD MILLION)
           9.2.5 REST OF ASIA PACIFIC
                    TABLE 33 REST OF ASIA PACIFIC: BENZOATES MARKET SIZE, BY END-USE, 2018–2021 (USD MILLION)
                    TABLE 34 REST OF ASIA PACIFIC: BENZOATES MARKET SIZE, BY END-USE, 2022–2027 (USD MILLION)
    9.3 EUROPE 
          FIGURE 28 EUROPE: BENZOATES MARKET SNAPSHOT
          TABLE 35 EUROPE: BENZOATES MARKET SIZE, BY TYPE, 2018–2021 (USD MILLION)
          TABLE 36 EUROPE: BENZOATES MARKET SIZE, BY TYPE, 2022–2027 (USD MILLION)
          TABLE 37 EUROPE: BENZOATES MARKET SIZE, BY END-USE, 2018–2021 (USD MILLION)
          TABLE 38 EUROPE: BENZOATES MARKET SIZE, BY END-USE, 2022–2027 (USD MILLION)
          TABLE 39 EUROPE: BENZOATES MARKET SIZE, BY COUNTRY, 2018–2021 (USD MILLION)
          TABLE 40 EUROPE: BENZOATES MARKET SIZE, BY COUNTRY, 2022–2027 (USD MILLION)
           9.3.1 GERMANY
                    9.3.1.1 Growth of processed food and pharmaceutical sectors
                                TABLE 41 GERMANY: BENZOATES MARKET SIZE, BY END-USE, 2018–2021 (USD MILLION)
                                TABLE 42 GERMANY: BENZOATES MARKET SIZE, BY END-USE, 2022–2027 (USD MILLION)
           9.3.2 FRANCE
                    9.3.2.1 Growing demand for feed preservatives to increase consumption of benzoates
                                TABLE 43 FRANCE: BENZOATES MARKET SIZE, BY END-USE, 2018–2021 (USD MILLION)
                                TABLE 44 FRANCE: BENZOATES MARKET SIZE, BY END-USE, 2022–2027 (USD MILLION)
           9.3.3 UK
                    9.3.3.1 Significant growth in food & beverages sector to fuel market
                                TABLE 45 UK: BENZOATES MARKET SIZE, BY END-USE, 2018–2021 (USD MILLION)
                                TABLE 46 UK: BENZOATES MARKET SIZE, BY END-USE, 2022–2027 (USD MILLION)
           9.3.4 REST OF EUROPE
                    TABLE 47 REST OF EUROPE: BENZOATES MARKET SIZE, BY END-USE, 2018–2021 (USD MILLION)
                    TABLE 48 REST OF EUROPE: BENZOATES MARKET SIZE, BY END-USE, 2022–2027 (USD MILLION)
    9.4 NORTH AMERICA 
          FIGURE 29 NORTH AMERICA: BENZOATES MARKET SNAPSHOT
          TABLE 49 NORTH AMERICA: BENZOATES MARKET SIZE, BY TYPE, 2018–2021 (USD MILLION)
          TABLE 50 NORTH AMERICA: BENZOATES MARKET SIZE, BY TYPE, 2022–2027 (USD MILLION)
          TABLE 51 NORTH AMERICA: BENZOATES MARKET SIZE, BY END-USE, 2018–2021 (USD MILLION)
          TABLE 52 NORTH AMERICA: BENZOATES MARKET SIZE, BY END-USE, 2022–2027 (USD MILLION)
          TABLE 53 NORTH AMERICA: BENZOATES MARKET SIZE, BY COUNTRY, 2018–2021 (USD MILLION)
          TABLE 54 NORTH AMERICA: BENZOATES MARKET SIZE, BY COUNTRY, 2022–2027 (USD MILLION)
           9.4.1 US
                    9.4.1.1 Growth in demand for beauty products to drive market
                                TABLE 55 US: BENZOATES MARKET SIZE, BY END-USE, 2018–2021 (USD MILLION)
                                TABLE 56 US: BENZOATES MARKET SIZE, BY END-USE, 2022–2027 (USD MILLION)
           9.4.2 CANADA
                    9.4.2.1 Increasing R&D activities in pharmaceutical sector to support market
                                TABLE 57 CANADA: BENZOATES MARKET SIZE, BY END-USE, 2018–2021 (USD MILLION)
                                TABLE 58 CANADA: BENZOATES MARKET SIZE, BY END-USE, 2022–2027 (USD MILLION)
           9.4.3 MEXICO
                    9.4.3.1 Food & beverage to be largest end user of benzoates
                                TABLE 59 MEXICO: BENZOATES MARKET SIZE, BY END-USE, 2018–2021 (USD MILLION)
                                TABLE 60 MEXICO: BENZOATES MARKET SIZE, BY END-USE, 2022–2027 (USD MILLION)
    9.5 REST OF WORLD 
          TABLE 61 REST OF WORLD: BENZOATES MARKET SIZE, BY TYPE, 2018–2021 (USD MILLION)
          TABLE 62 REST OF WORLD: BENZOATES MARKET SIZE, BY TYPE, 2022–2027 (USD MILLION)
          TABLE 63 REST OF WORLD: BENZOATES MARKET SIZE, BY END-USE, 2018–2021 (USD MILLION)
          TABLE 64 REST OF WORLD: BENZOATES MARKET SIZE, BY END-USE, 2022–2027 (USD MILLION)
          TABLE 65 REST OF WORLD: BENZOATES MARKET SIZE, BY COUNTRY, 2018–2021 (USD MILLION)
          TABLE 66 REST OF WORLD: BENZOATES MARKET SIZE, BY COUNTRY, 2022–2027 (USD MILLION)
           9.5.1 MIDDLE EAST & AFRICA
                    TABLE 67 MIDDLE EAST & AFRICA: BENZOATES MARKET SIZE, BY END-USE, 2018–2021 (USD MILLION)
                    TABLE 68 MIDDLE EAST & AFRICA: BENZOATES MARKET SIZE, BY END-USE, 2022–2027 (USD MILLION)
           9.5.2 SOUTH AMERICA
                    TABLE 69 SOUTH AMERICA: BENZOATES MARKET SIZE, BY END-USE, 2018–2021 (USD MILLION)
                    TABLE 70 SOUTH AMERICA: BENZOATES MARKET SIZE, BY END-USE, 2022–2027 (USD MILLION)
 
10 COMPETITIVE LANDSCAPE (Page No. - 88)
     10.1 STRATEGIES OF KEY PLAYERS 
             TABLE 71 OVERVIEW OF KEY STRATEGIES ADOPTED BY TOP PLAYERS
     10.2 REVENUE ANALYSIS 
             FIGURE 30 REVENUE ANALYSIS FOR KEY COMPANIES (2017–2021)
     10.3 MARKET SHARE ANALYSIS, 2021 
             FIGURE 31 BENZOATES MARKET SHARE ANALYSIS
             TABLE 72 BENZOATES MARKET: DEGREE OF COMPETITION
             10.3.1 LANXESS
             10.3.2 WUHAN YOUJI INDUSTRIES CO., LTD.
             10.3.3 TIANJIN DONGDA CHEMICAL GROUP CO., LTD.
             10.3.4 EASTMAN CHEMICAL COMPANY
             10.3.5 COMPETITIVE BENCHMARKING
                        TABLE 73 BENZOATES MARKET: PRODUCT TYPE FOOTPRINT
                        TABLE 74 BENZOATES MARKET: END-USE FOOTPRINT
                        TABLE 75 BENZOATES MARKET: REGION FOOTPRINT
     10.4 COMPANY EVALUATION MATRIX 
             10.4.1 STARS
             10.4.2 EMERGING LEADERS
             10.4.3 PERVASIVE COMPANIES
             10.4.4 PARTICIPANTS
                        FIGURE 32 BENZOATES: COMPANY EVALUATION MATRIX, 2021
     10.5 COMPETITIVE SCENARIO 
             TABLE 76 BENZOATES MARKET: DEALS, 2019–2022
             TABLE 77 BENZOATES MARKET: OTHER DEVELOPMENTS, 2019–2022
 
11 COMPANY PROFILES (Page No. - 98)
*Details on Business Overview, Products Offered, Recent Developments, and MnM View (Key strengths/Right to Win, Strategic Choices Made, and Weaknesses and Competitive Threats) might not be captured in case of unlisted companies.
     11.1 LANXESS 
             TABLE 78 LANXESS: COMPANY OVERVIEW
             FIGURE 33 LANXESS: COMPANY SNAPSHOT
             TABLE 79 LANXESS: PRODUCTS OFFERED
             TABLE 80 LANXESS: DEALS
     11.2 WUHAN YOUJI INDUSTRIES CO., LTD. 
             TABLE 81 WUHAN YOUJI INDUSTRIES CO., LTD.: COMPANY OVERVIEW
             TABLE 82 WUHAN YOUJI INDUSTRIES CO., LTD.: PRODUCTS OFFERED
             TABLE 83 WUHAN YOUJI INDUSTRIES CO., LTD.: OTHERS
     11.3 TIANJIN DONGDA CHEMICAL GROUP CO., LTD. 
             TABLE 84 TIANJIN DONGDA CHEMICAL GROUP CO., LTD.: COMPANY OVERVIEW
             TABLE 85 TIANJIN DONGDA CHEMICAL GROUP CO., LTD.: PRODUCT OFFERED
     11.4 TENGZHOU TENGLONG CHEMICAL CO., LTD. 
             TABLE 86 TENGZHOU TENGLONG CHEMICAL CO., LTD.: COMPANY OVERVIEW
             TABLE 87 TENGZHOU TENGLONG CHEMICAL CO., LTD.: PRODUCTS OFFERED
     11.5 EASTMAN CHEMICAL COMPANY 
             TABLE 88 EASTMAN CHEMICAL COMPANY: COMPANY OVERVIEW
             FIGURE 34 EASTMAN CHEMICAL COMPANY: COMPANY SNAPSHOT
             TABLE 89 EASTMAN CHEMICAL COMPANY: PRODUCTS OFFERED
             TABLE 90 EASTMAN CHEMICAL COMPANY: DEALS
     11.6 A.M FOOD CHEMICAL CO., LIMITED 
             TABLE 91 A.M FOOD CHEMICAL CO., LIMITED: COMPANY OVERVIEW
             TABLE 92 A.M FOOD CHEMICAL CO., LIMITED: PRODUCTS OFFERED
     11.7 VERTELLUS 
             TABLE 93 VERTELLUS: COMPANY OVERVIEW
             TABLE 94 VERTELLUS: PRODUCTS OFFERED
             TABLE 95 VERTELLUS: DEALS
     11.8 SPECTRUM CHEMICAL 
             TABLE 96 SPECTRUM CHEMICAL: COMPANY OVERVIEW
             TABLE 97 SPECTRUM CHEMICAL: PRODUCTS OFFERED
             TABLE 98 SPECTRUM CHEMICAL: DEALS
     11.9 TENGZHOU AOLONG CHEMICAL CO., LTD. 
             TABLE 99 TENGZHOU AOLONG CHEMICAL CO., LTD.: COMPANY OVERVIEW
             TABLE 100 TENGZHOU AOLONG CHEMICAL CO., LTD.: PRODUCTS OFFERED
     11.1 MACCO ORGANIQUES INC. 
             TABLE 101 MACCO ORGANIQUES INC.: COMPANY OVERVIEW
             TABLE 102 MACCO ORGANIQUES INC.: PRODUCTS OFFERED
             TABLE 103 MACCO ORGANIQUES INC.: DEALS
     11.11 FBC INDUSTRIES 
             TABLE 104 FBC INDUSTRIES: COMPANY OVERVIEW
             TABLE 105 FBC INDUSTRIES: PRODUCTS OFFERED
     11.12 SHANDONG TONGTAIWEIRUN FOOD SCIENCE TECH CO., LTD. 
             TABLE 106 SHANDONG TONGTAIWEIRUN FOOD SCIENCE TECH CO., LTD.: COMPANY OVERVIEW
             TABLE 107 SHANDONG TONGTAIWEIRUN FOOD SCIENCE TECH CO., LTD.: PRODUCTS OFFERED
     11.13 SHANDONG RUIHENG BIOTECHNOLOGY CO., LTD. 
             TABLE 108 SHANDONG RUIHENG BIOTECHNOLOGY CO., LTD.: COMPANY OVERVIEW
             TABLE 109 SHANDONG RUIHENG BIOTECHNOLOGY CO., LTD.: PRODUCTS OFFERED
     11.14 RISHI CHEMICAL 
             TABLE 110 RISHI CHEMICAL: COMPANY OVERVIEW
             TABLE 111 RISHI CHEMICAL: PRODUCTS OFFERED
     11.15 TOKYO CHEMICAL INDUSTRY CO., LTD. 
             TABLE 112 TOKYO CHEMICAL INDUSTRY CO., LTD.: COMPANY OVERVIEW
             TABLE 113 TOKYO CHEMICAL INDUSTRY CO., LTD.: PRODUCTS OFFERED
     11.16 ING. PETR ŠVEC - PENTA S.R.O. 
             TABLE 114 ING. PETR ŠVEC - PENTA S.R.O.: COMPANY OVERVIEW
             TABLE 115 ING. PETR ŠVEC - PENTA S.R.O.: PRODUCTS OFFERED
     11.17 GANESH BENZOPLAST LIMITED 
             TABLE 116 GANESH BENZOPLAST LIMITED: COMPANY OVERVIEW
             FIGURE 35 GANESH BENZOPLAST LIMITED: COMPANY SNAPSHOT
             TABLE 117 GANESH BENZOPLAST LIMITED: PRODUCTS OFFERED
     11.18 FOODCHEM INTERNATIONAL CORPORATION 
             TABLE 118 FOODCHEM INTERNATIONAL CORPORATION: COMPANY OVERVIEW
             TABLE 119 FOODCHEM INTERNATIONAL CORPORATION: PRODUCTS OFFERED
             TABLE 120 FOODCHEM INTERNATIONAL CORPORATION: OTHERS
     11.19 AMERICAN ELEMENTS 
             TABLE 121 AMERICAN ELEMENTS: COMPANY OVERVIEW
             TABLE 122 AMERICAN ELEMENTS: PRODUCTS OFFERED
 
*Details on Business Overview, Products Offered, Recent Developments, and MnM View (Key strengths/Right to Win, Strategic Choices Made, and Weaknesses and Competitive Threats) might not be captured in case of unlisted companies.
 
12 APPENDIX (Page No. - 130)
     12.1 DISCUSSION GUIDE 
     12.2 KNOWLEDGESTORE: MARKETSANDMARKETS’ SUBSCRIPTION PORTAL 
     12.3 CUSTOMIZATION OPTIONS 
     12.4 RELATED REPORTS 
     12.5 AUTHOR DETAILS 

The study involved four major activities in estimating the current size of the benzoates market. Exhaustive secondary research was done to collect information on the market, peer markets, and parent market. The next step was to validate these findings, assumptions, and sizing with the industry experts across the benzoates value chain through primary research. Both top-down and bottom-up approaches were employed to estimate the complete market size. Thereafter, market breakdown and data triangulation were used to estimate the market size of segments and subsegments.

Secondary Research

Secondary sources for this research study include annual reports; press releases, and investor presentations of companies; white papers; certified publications; and articles by recognized authors, gold- and silver-standard websites, benzoates manufacturing companies, regulatory bodies, trade directories, and databases. The secondary research was mainly used to obtain key information about the industry’s supply chain, the total pool of key players, market classification, and segmentation according to industry trends to the bottom-most level and regional markets. It has also been used to obtain information about key developments from a market-oriented perspective.

Primary Research

The benzoates market comprises several stakeholders, such as raw material suppliers, processors, end-use industries, and regulatory organizations in the supply chain. The demand side of the market is characterized by the presence of benzoates manufacturers, importers/exporters, and manufacturers engaged in the production of various products. The supply side is characterized by key technology providers for benzoates, end-users, researchers, and service providers.

In the primary research process, various primary sources from the supply and demand sides of the market have been interviewed to obtain qualitative and quantitative information. The primary interviewees from the demand side included key opinion leaders, executives, vice presidents, and CEOs of manufacturing companies. The primary sources from the supply side included research institutions involved in R&D activities to introduce new technologies, key opinion leaders, distributors, and benzoates manufacturing companies.

Breakdown of the Primary Interviews
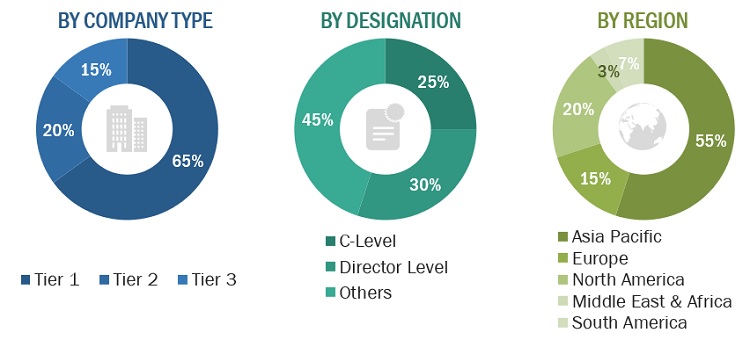
Benzoates Market Size, and Share

Notes: Other designations include sales managers, engineers, and regional managers.

Tier 1 company—revenue >USD 5 billion, tier 2 company—revenue between USD 1 billion and USD 5 billion, and tier 3 company—revenue

To know about the assumptions considered for the study, download the pdf brochure

Market Size Estimation

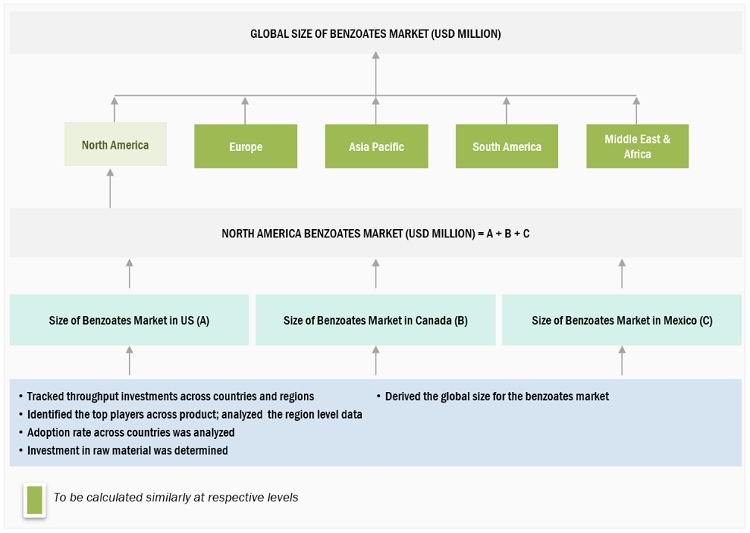
Both the top-down and bottom-up approaches have been used to estimate and validate the total size of the benzoates market. These approaches have also been used extensively to estimate the size of various dependent subsegments of the market. The research methodology used to estimate the market size included the following:

The following segments provide details about the overall market size estimation process employed in this study

  • The key players in the market were identified through secondary research.
  • The market shares in the respective regions were identified through primary and secondary research.
  • The value chain and market size of the benzoates market, in terms of value, were determined through primary and secondary research.
  • All percentage shares, splits, and breakdowns were determined using secondary sources and verified through primary sources.
  • All possible parameters that affect the market covered in this research study were accounted for, viewed in extensive detail, verified through primary research, and analyzed to obtain the final quantitative and qualitative data.
  • The research included the study of annual and financial reports of the top market players and interviews with industry experts, such as CEOs, VPs, directors, sales managers, and marketing executives, for key insights, both quantitative and qualitative.

Global Benzoates Market Size: Bottom-Up Approach
Benzoates Market Size, and Share

To know about the assumptions considered for the study, Request for Free Sample Report

Data Triangulation

After arriving at the overall market size from the estimation process explained below, the total market was split into several segments and subsegments. The data triangulation and market breakdown procedures were employed, wherever applicable, to complete the overall market engineering process and arrive at the exact statistics for all the segments and subsegments. The data was triangulated by studying various factors and trends from both the demand and supply sides. Along with this, the market was validated using both the top-down and bottom-up approaches.

Report Objectives

Market Intelligence

  • To analyze and forecast the size of the benzoates market in terms of value
  • To define, describe, and forecast the market size by type, end-use, and region
  • To forecast the market size with respect to four main regions, namely, Asia Pacific, Europe, North America, Rest of the World
  • To provide detailed information about the key factors influencing the growth of the market (drivers, restraints, opportunities, and challenges)
  • To strategically analyze the market segments with respect to individual growth trends, prospects, and their contribution to the market
  • To analyze the opportunities in the market for stakeholders and provide a competitive landscape for market leaders
  • To analyze competitive developments, such as acquisitions, partnerships, and expansions in the benzoates market

Competitive Intelligence

  • To identify and profile the key players in the benzoates market
  • To determine the top players offering various products in the benzoates market
  • To provide a comparative analysis of the market leaders based on the following:
  • Product offerings
  • Business strategies
  • Strengths and weaknesses
  • Key financials
  • To understand the competitive landscape of the market and identify the key growth strategies adopted by the leading players across key regions

Available Customizations

MarketsandMarkets offers the following customizations for this market report:

  • Product matrix, which gives a detailed comparison of the product portfolio of each company
Custom Market Research Services

We will customize the research for you, in case the report listed above does not meet with your exact requirements. Our custom research will comprehensively cover the business information you require to help you arrive at strategic and profitable business decisions.

Request Customization

Instant Answers with GPT - Ask Now!

Ask real questions. Get complete answers !
Report Code
CH 8493
Published ON
Dec, 2022
Choose License Type
BUY NOW
  • SHARE
X
Request Customization
Speak to Analyst
Speak to Analyst
OR FACE-TO-FACE MEETING
PERSONALIZE THIS RESEARCH
  • Triangulate with your Own Data
  • Get Data as per your Format and Definition
  • Gain a Deeper Dive on a Specific Application, Geography, Customer or Competitor
  • Any level of Personalization
REQUEST A FREE CUSTOMIZATION
LET US HELP YOU!
  • What are the Known and Unknown Adjacencies Impacting the Benzoates Market
  • What will your New Revenue Sources be?
  • Who will be your Top Customer; what will make them switch?
  • Defend your Market Share or Win Competitors
  • Get a Scorecard for Target Partners
CUSTOMIZED WORKSHOP REQUEST
knowledgestore logo

Want to explore hidden markets that can drive new revenue in Benzoates Market?

Find Hidden Markets
  • Call Us
  • +1-888-600-6441 (Corporate office hours)
  • +1-888-600-6441 (US/Can toll free)
  • +44-800-368-9399 (UK office hours)
CONNECT WITH US
ABOUT TRUST ONLINE
©2024 MarketsandMarkets Research Private Ltd. All rights reserved
DMCA.com Protection Status
Website Feedback