AR Indoor Navigation Market

AR Indoor Navigation Market - Global Forecast to 2030

Report Code: UC 6476 Aug, 2024, by marketsandmarkets.com

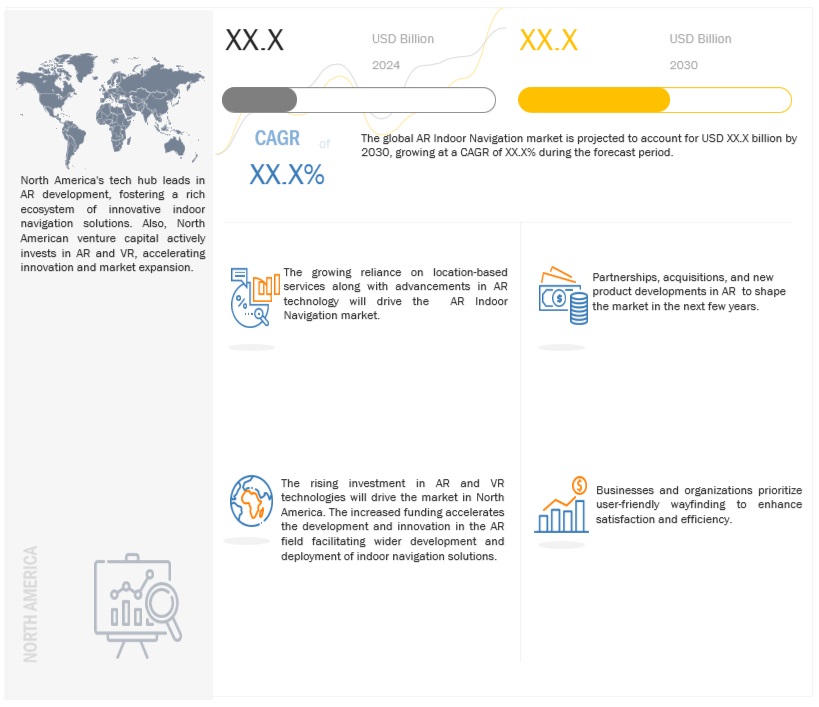
The AR indoor navigation market is currently witnessing remarkable growth, with projections indicating a substantial increase in market size. Estimates suggest a notable expansion from its value of USD 0.35 billion in 2024 to USD 2.64 billion by 2030, reflecting a robust CAGR of 40.0% over the forecast period. AR indoor navigation provides a more interactive and engaging user experience than traditional navigation methods. It allows users to visualize and interact with their surroundings in real time, improving navigation accuracy and efficiency. Various industries, such as retail, healthcare, manufacturing, and logistics, are adopting AR indoor navigation to improve operational efficiency, enhance customer experience, and streamline processes.
AR Indoor Navigation Market

To know about the assumptions considered for the study, Request for Free Sample Report

Market Dynamics

Driver: Advancements in AR Technology

AR (Augmented Reality) technology has been significant, driving the evolution of AR indoor navigation and its applications across various industries. These advancements reshape how AR is integrated into everyday experiences, making it more accessible, practical, and powerful. Where AR devices such as smart glasses, headsets, and mobile devices have seen improvements in display quality, processing power, and form factor, these advancements have made AR more immersive and comfortable for users, enabling them to interact with digital content seamlessly overlaid onto the physical environment.

Restraint: The adoption of AR indoor navigation is the inherent complexity of indoor environments.

Navigating accurately in complex indoor spaces using AR technology requires advanced mapping, tracking, and localization capabilities. The technology must map and recognize the indoor environment in real-time, understand the user's position and orientation, and provide accurate navigation instructions despite the complexities of the surroundings. The complexity of indoor environments can also pose challenges for maintaining the accuracy and reliability of AR indoor navigation systems. Changes in the environment, such as moving objects or temporary structures, can impact the effectiveness of navigation instructions if not accounted for in real time.

Opportunity: The integration of AR indoor navigation with IoT and smart building technologies

Integrating AR indoor navigation with IoT devices and sensors can provide users with enhanced navigation capabilities and interactive experiences. By leveraging data from IoT sensors, such as beacons or environmental sensors, AR navigation systems can offer real-time information about the surrounding environment, including factors like temperature, humidity, and occupancy, to enhance the user experience. Additionally, integrating AR indoor navigation with IoT devices can enable interactive features such as augmented reality overlays that display contextual information about points of interest within the indoor environment. For example, users could point their devices at a specific location in a museum, and AR overlays could provide detailed information about the exhibit or artwork they are viewing. In retail, AR overlays could display product information, pricing, or promotions when users point their devices at items on shelves.

Challenge: Data Integration and Management

Integrating data from various IoT sensors and devices into AR indoor navigation systems requires robust data integration and management processes. This involves collecting data from IoT devices, such as beacons or environmental sensors, and integrating it with the AR navigation system's data infrastructure. IoT devices often use different data formats and communication protocols, making standardizing and integrating data streams challenging. Data from diverse sources must be harmonized and processed to ensure compatibility and consistency within the AR navigation system.

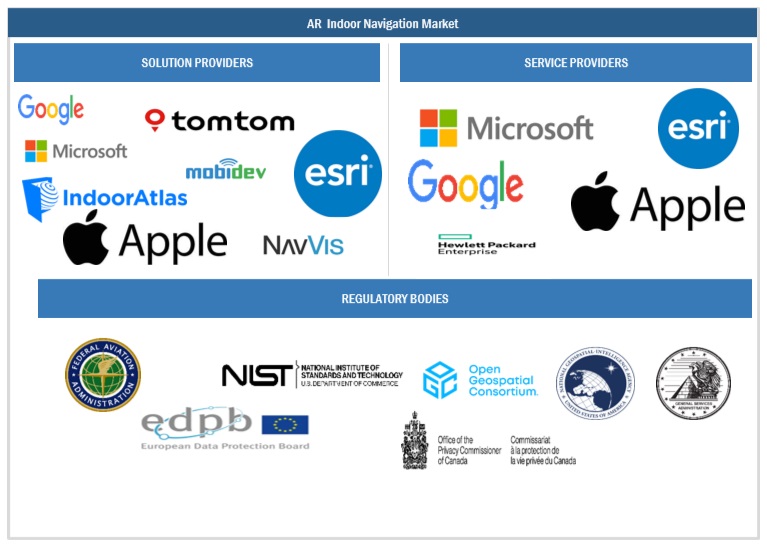
AR Indoor Navigation Market Ecosystem
Top Companies in AR Indoor Navigation Market

By offering, the AR indoor navigation hardware segment to account for a significant market size during forecast period.

AR indoor navigation hardware is expected to claim the largest market share in 2024. AR indoor navigation encompasses the physical devices and components required to enable augmented reality-based navigation and positioning within indoor environments. These devices serve as the primary interface for AR indoor navigation applications. They provide the display for AR overlays, processing power for running AR software, and connectivity for accessing location data and content.

By vertical, hospitals and healthcare facilities are slated to witness the highest growth rate during the forecast period.

The hospitals and healthcare facilities segment is experiencing notable growth in the AR indoor navigation market. Augmented reality (AR) transforms how we navigate indoor spaces, and hospitals and healthcare facilities are no exception. AR indoor navigation offers a variety of benefits for both patients and staff, making it a promising technology for the future of healthcare. AR can be beneficial for patients with disabilities or limited mobility. It can guide them to accessible entrances, elevators, and restrooms, making the hospital experience more inclusive. AR can overlay additional information on top of the real world, such as points of interest, wait times, and even educational content about their condition. This can make the hospital experience more engaging and informative for patients.

By region, Asia Pacific is set to experience a rapid growth rate during the forecast period.

Asia Pacific is swiftly establishing itself as the fastest-growing hub in the AR indoor navigation market, with several key factors driving its expansion. The Asia Pacific region is home to over half of the world's population, which is expected to grow in the coming years. This growing population creates a strong demand for efficient indoor navigation solutions in the healthcare, retail, and transportation sectors. Countries like China, Japan, and South Korea are investing heavily in technology, driving the development and usage of AR solutions. These countries are also home to some of the world's leading technology companies actively developing and deploying AR indoor navigation solutions.

Key Market Players

The AR indoor navigation solution and service providers have implemented various organic and inorganic growth strategies, such as new product launches, product upgrades, partnerships, agreements, business expansions, and mergers and acquisitions, to strengthen their offerings in the market. Some major players in the AR indoor navigation market include Apple (US), Google (US), IndoorAtlas (Finland), Pointr (UK), MazeMap (Norway), NavVis (Germany), Maze Engineers (US), Blippar (UK), TomTom (Netherlands), Esri (US), Situm (Spain), MobiDev (US).

Recent Developments:

  • In December 2023, TomTom, a leading location technology specialist and AI map it, announced a global partnership. This collaboration centers on delivering image repository and AI services to clients worldwide, marking an exciting venture for both organizations.
  • In October 2023, Google Maps enhanced the feature for immersive views for routes and other AI features. These Maps updates make it easier to plan and navigate with new search and exploration methods.
  • In January 2023, Apple Maps gained a new tool, Apple Business Connect; it will now allow business owners to update and manage their information on the platform, including key details like business hours and location, photos, logos, special offers, promotions, and more.
  • In July 2023, ExpoFP and indoor positioning platform IndoorAtlas announced a joint development: interactive floor plans with accurate indoor positioning and wayfinding.
  • In July 2022, Esri launched the indoor positioning system ArcGIS IPS, which improves operational efficiency and safety. ArcGIS IPS enables real-time indoor location services through Esri’s ArcGIS Indoors mobile application and in custom apps built with ArcGIS Runtime SDKs.
  • In October 2023, TomTom announced a new partnership with Flow Labs. This AI-powered transportation data platform offers high traffic data accuracy to enhance transport safety, equity, mobility, and environmental sustainability.

To speak to our analyst for a discussion on the above findings, click Speak to Analyst

TABLE OF CONTENTS
 
1 INTRODUCTION 
    1.1 OBJECTIVE OF THE STUDY 
    1.2 MARKET DEFINITION 
           1.2.1 INCLUSIONS AND EXCLUSIONS
    1.3 MARKET SCOPE 
           1.3.1 MARKET SEGMENTATION
           1.3.2 REGIONS COVERED
           1.3.3 YEARS CONSIDERED FOR THE STUDY
    1.4 CURRENCY CONSIDERED 
    1.5 STAKEHOLDERS 
 
2 RESEARCH METHODOLOGY 
    2.1 RESEARCH DATA 
           2.1.1 SECONDARY DATA
                    2.1.1.1 KEY DATA FROM SECONDARY SOURCES
           2.1.2 PRIMARY DATA
                    2.1.2.1 KEY DATA FROM PRIMARY SOURCES
                    2.1.2.2 KEY INDUSTRY INSIGHTS
                    2.1.2.3 BREAKDOWN OF PRIMARY INTERVIEWS
    2.2 MARKET BREAKUP AND DATA TRIANGULATION 
    2.3 MARKET SIZE ESTIMATION 
           2.2.1 BOTTOM-UP APPROACH
           2.2.2 TOP-DOWN APPROACH
    2.4 MARKET FORECAST 
    2.5 ASSUMPTIONS FOR THE STUDY 
    2.6 LIMITATIONS OF THE STUDY 
    2.7 IMPACT OF RECESSION ON GLOBAL AR INDOOR NAVIGATION MARKET 
 
3 EXECUTIVE SUMMARY 
 
4 PREMIUM INSIGHTS 
    4.1 ATTRACTIVE OPPORTUNITIES IN AR INDOOR NAVIGATION MARKET 
    4.2 MARKET: MARKET SHARE ACROSS APPLICATION 
    4.3 MARKET:  BY END USER 
    4.4 AMARKET:  BY OFFERING 
    4.5 AR INDOOR NAVIGATION MARKET:  BY TECHNOLOGY 
 
5 MARKET OVERVIEW AND INDUSTRY TRENDS 
    5.1 INTRODUCTION 
    5.2 MARKET DYNAMICS 
           5.2.1 DRIVERS
           5.2.2 RESTRAINTS
           5.2.3 OPPORTUNITIES
           5.2.4 CHALLENGES
    5.3 INDUSTRY TRENDS 
           5.3.1 ECOSYSTEM ANALYSIS
           5.3.2 BRIEF HISTORY OF AR INDOOR NAVIGATION TECHNOLOGY
           5.3.3 TECHNOLOGY IMPACT
                    5.3.3.1 ARTIFICIAL INTELLIGENCE
                    5.3.3.2 MACHINE LEARNING
                    5.3.3.3 CLOUD COMPUTING
                    5.3.3.5 INTERNET OF THINGS
                    5.3.3.6 BLOCKCHAIN
           5.3.4 CASE STUDY ANALYSIS
           5.3.5 REGULATORY LANDSCAPE
                    5.3.5.1 REGULATORY BODIES, GOVERNMENT AGENCIES, AND OTHER ORGANIZATIONS
           5.3.6 VALUE CHAIN ANALYSIS
           5.3.7 PORTER’S FIVE FORCES ANALYSIS
                    5.3.7.1 THREAT OF NEW ENTRANTS
                    5.3.7.2 THREAT OF SUBSTITUTES
                    5.3.7.3 BARGAINING POWER OF SUPPLIERS
                    5.3.7.4 BARGAINING POWER OF BUYERS
                    5.3.7.5 INTENSITY OF COMPETITIVE RIVALRY
           5.3.8 KEY CONFERENCES AND EVENTS IN 2023-2024
           5.3.9 KEY STAKEHOLDERS AND BUYING CRITERIA
                    5.3.9.1 KEY STAKEHOLDERS IN BUYING PROCESS
                    5.3.9.2 BUYING CRITERIA
           5.3.10 PRICING ANALYSIS
                    5.3.10.1 AVERAGE SELLING PRICE TREND
                    5.3.10.2 AVERAGE SELLING PRICE OF KEY PLAYERS BY APPLICATION
           5.3.11 PATENT ANALYSIS
                    5.3.11.1 LIST OF MAJOR PATENT
           5.3.12 TRENDS/DISRUPTIONS IMPACTING CUSTOMERS BUSINESS
                    5.3.12.1 REVENUE SHIFTS AND NEW REVENUE POCKETS FOR END USERS TECHNOLOGY
           5.3.13 TECHNOLOGY LANDSCAPE OF AR INDOOR NAVIGATION MARKET
                    5.3.13.1 SHORT-TERM (2023-2025)
                    5.3.13.2 MID-TERM (2025-2028)
                    5.3.13.3 LONG-TERM (2028-2030)
           5.3.14 COMPARISION OF MARKER-BASED AR AND MARKERLESS AR FOR MARKET
 
6 AR INDOOR NAVIGATION MARKET, BY OFFERING 
    6.1 INTRODUCTION 
           6.1.1 OFFERING: MARKET DRIVERS
    6.2 SOFTWARE 
           6.2.1 MAPPING AND LOCALIZATION SOFTWARE
           6.2.2 NAVIGATION AND WAYFINDING SOFTWARE
    6.3 HARDWARE 
    6.4 SERVICES 
           6.4.1 CONSULTING SERVICES
           6.4.2 SUPPORT AND MAINTENANCE
           6.4.3 DEPLOYMENT AND INTEGRATION
 
7 AR INDOOR NAVIGATION MARKET, BY TECHNOLOGY 
    7.1 INTRODUCTION 
           7.1.1 TECHNOLOGY: MARKET DRIVERS
    7.2 BEACON-BASED INDOOR NAVIGATION 
    7.3 BUILT-IN MOBILE SENSORS 
    7.4 AR CLOUD 
    7.5 AR MARKERS 
 
8 AR INDOOR NAVIGATION MARKET, BY APPLICATION 
    8.1 INTRODUCTION 
           8.1.1 APPLICATION: MARKET DRIVERS
    8.2 REAL-TIME LOCATION DATA MANAGEMENT 
    8.3 ROUTING AND NAVIGATION 
    8.4 ASSET TRACKING 
    8.5 REVERSE GEOCODING 
    8.6 OTHER APPLICATIONS 
 
9 AR INDOOR NAVIGATION MARKET, BY END USER 
    9.1 INTRODUCTION 
           9.1.1 END USER: MARKET DRIVERS
    9.2 RETAIL AND SHOPPING MALLS 
    9.3 AIRPORTS AND TRANSPORTATION HUBS 
    9.4 HOSPITALS AND HEALTHCARE FACILITIES 
    9.5 CORPORATE OFFICES AND COMMERCIAL BUILDINGS 
    9.6 MUSEUMS AND CULTURAL INSTITUTIONS 
    9.7 EDUCATIONAL INSTITUTIONS 
    9.8 GOVERNMENT BUILDINGS 
    9.9 MANUFACTURING UNITS 
    9.10 OTHERS 
 
10 AR INDOOR NAVIGATION MARKET, BY GEOGRAPHIC ANALYSIS 
     10.1 INTRODUCTION 
     10.2 NORTH AMERICA 
             10.2.1 NORTH AMERICA: MARKET DRIVERS
             10.2.2 NORTH AMERICA: IMPACT OF RECESSION
             10.2.3 UNITED STATES
             10.2.4 CANADA
     10.3 EUROPE 
             10.3.1 EUROPE: MARKET DRIVERS
             10.3.2 EUROPE: IMPACT OF RECESSION
             10.3.3 UNITED KINGDOM
             10.3.4 FRANCE
             10.3.5 GERMANY
             10.3.6 ITALY
             10.3.7 SPAIN
             10.3.8 REST OF EUROPE
     10.4 ASIA PACIFIC 
             10.4.1 ASIA PACIFIC: MARKET DRIVERS
             10.4.2 ASIA PACIFIC: IMPACT OF RECESSION
             10.4.3 CHINA
             10.4.4 JAPAN
             10.4.5 SOUTH KOREA
             10.4.6 INDIA
             10.4.7 AUSTRALIA AND NEW ZEALAND
             10.4.8 REST OF ASIA PACIFIC
     10.5 MIDDLE EAST AND AFRICA 
             10.5.1 MIDDLE EAST AND AFRICA: MARKET DRIVERS
             10.5.2 MIDDLE EAST AND AFRICA: IMPACT OF RECESSION
             10.5.3 KSA
             10.5.4 UAE
             10.5.5 ISRAEL
             10.5.6 TURKEY
             10.5.7 QATAR
             10.5.8 SOUTH AFRICA
             10.5.9 REST OF MIDDLE EAST AND AFRICA
     10.6 LATIN AMERICA 
             10.6.1 LATIN AMERICA: MARKET DRIVERS
             10.6.2 LATIN AMERICA: IMPACT OF RECESSION
             10.6.3 BRAZIL
             10.6.4 MEXICO
             10.6.5 ARGENTINA
             10.6.6 REST OF LATIN AMERICA
 
11 COMPETITIVE LANDSCAPE 
     11.1 INTRODUCTION 
     11.2 KEY PLAYER STRATEGIES/RIGHT TO WIN 
     11.3 MARKET SHARE ANALYSIS 
             11.3.1 HISTORIC REVENUE ANALYSIS
     11.4 MARKET RANKING ANALYSIS 
     11.5 COMPETITIVE SCENARIOS AND TRENDS 
             11.5.1 NEW LAUNCHES
             11.5.2 DEALS
             11.5.3 OTHERS
     11.6 COMPANY EVALUATION QUADRANT 
             11.6.1 DEFINITIONS AND METHODOLOGY
             11.6.2 STARS
             11.6.3 EMERGING LEADERS
             11.6.4 PERVASIVE
             11.6.5 PARTICIPANTS
     11.7 STARTUP/SME EVALUATION MATRIX 
             11.7.1 DEFINITIONS AND METHODOLOGY
             11.7.2 PROGRESSIVE
             11.7.3 RESPONSIVE
             11.7.4 DYNAMIC
             11.7.5 STARTING BLOCKS
     11.8 COMPETITVE BENCHMARKING 
     11.9 PRODUCT BENCHMARKING 
 
12 COMPANY PROFILES 
     12.1 INTRODUCTION 
     12.2 KEY PLAYERS 
             12.2.1 GOOGLE
                       12.2.1.1 Business and Financial overview
                       12.2.1.2 Recent developments
                       12.2.1.3 MNM VIEW
                                   12.2.1.3.1 Key strengths/right to win
                                   12.2.1.3.2 Strategic choices made
                                   12.2.1.3.3 Weaknesses and competitive threats
             12.2.2 APPLE
                       12.2.2.1 Business and Financial Overview
                       12.2.2.2 Recent developments
                       12.2.2.3 MNM VIEW
                                   12.2.2.3.1 Key strengths/right to win
                                   12.2.2.3.2 Strategic choices made
                                   12.2.2.3.3 Weaknesses and competitive threats
             12.2.3 NEARMAP
                       12.2.3.1 Business and Financial Overview
                       12.2.3.2 Recent developments
                       12.2.3.3 MNM VIEW
                                   12.2.3.3.1 Key strengths/right to win
                                   12.2.3.3.2 Strategic choices made
                                   12.2.3.3.3 Weaknesses and competitive threats
             12.2.4 TOMTOM
                       12.2.4.1 Business and Financial Overview
                       12.2.4.2 Recent Developments
                       12.2.4.3 MNM VIEW
                                   12.2.4.3.1 Key strengths/right to win
                                   12.2.4.3.2 Strategic choices made
                                   12.2.4.3.3 Weaknesses and competitive threats
             12.2.5 ESRI
                       12.2.5.1 Business and Financial Overview
                       12.2.5.2 Recent Developments
                       12.2.5.3 MnM View
                                   12.2.5.3.1 Key strengths/right to win
                                   12.2.5.3.2 Strategic choices made
                                   12.2.5.3.3 Weaknesses and competitive threats
             12.2.6 INRIX
                       12.2.6.1 Business and Financial Overview
                       12.2.6.2 Recent developments
             12.2.7 INGCO INTERNATIONAL
                       12.2.7.1 Business and Financial Overview
                       12.2.7.2 Recent developments
             12.2.8 HPE
                       12.2.8.1 Business and Financial Overview
                       12.2.8.2 Recent developments
             12.2.9 SERVICENOW
                       12.2.9.1 Business and Financial Overview
                       12.2.9.2 Recent developments
             12.2.10 HYPER AR
                       12.2.10.1 Business and Financial Overview
                       12.2.10.2 Recent developments
             12.2.11 COMPANY NAME 11
             12.2.12 COMPANY NAME 12
             12.2.13 COMPANY NAME 13
             12.2.14 COMPANY NAME 14
             12.2.15 COMPANY NAME 15
             12.2.16 COMPANY NAME 16
             12.2.17 COMPANY NAME 17
             12.2.18 COMPANY NAME 18
             12.2.19 COMPANY NAME 19
             12.2.20 COMPANY NAME 20
             12.2.21 COMPANY NAME 21
             12.2.22 COMPANY NAME 22
             12.2.23 COMPANY NAME 23
             12.2.24 COMPANY NAME 24
             12.2.25 COMPANY NAME 25
             12.2.26 COMPANY NAME 26
             12.2.27 COMPANY NAME 27
             12.2.28 COMPANY NAME 28
             12.2.29 COMPANY NAME 29
             12.2.30 COMPANY NAME 30
 
13 APPENDIX 
     13.1 DISCUSSION GUIDE 
     13.2 AVAILABLE CUSTOMIZATIONS 
     13.3 RELATED REPORTS 

Request for detailed methodology, assumptions & how numbers were triangulated.

Please share your problem/objectives in greater details so that our analyst can verify if they can solve your problem(s).
5 7 6 3 0  
  • Select all
  • News-Letters with latest Market insights
  • Information & discussion on the relevant new products and services
  • Information & discussion on Market insights and Market information
  • Information & discussion on our events and conferences
    • Select all
    • Email Phone Professional and social network (Linkedin, etc)
Custom Market Research Services

We will customize the research for you, in case the report listed above does not meet with your exact requirements. Our custom research will comprehensively cover the business information you require to help you arrive at strategic and profitable business decisions.

Request Customization
Report Code
UC 6476
Available for Pre-Book
Choose License Type
Prebook Now
  • SHARE
X
Request Customization
Speak to Analyst
Speak to Analyst
OR FACE-TO-FACE MEETING
PERSONALIZE THIS RESEARCH
  • Triangulate with your Own Data
  • Get Data as per your Format and Definition
  • Gain a Deeper Dive on a Specific Application, Geography, Customer or Competitor
  • Any level of Personalization
REQUEST A FREE CUSTOMIZATION
LET US HELP YOU!
  • What are the Known and Unknown Adjacencies Impacting the AR Indoor Navigation Market
  • What will your New Revenue Sources be?
  • Who will be your Top Customer; what will make them switch?
  • Defend your Market Share or Win Competitors
  • Get a Scorecard for Target Partners
CUSTOMIZED WORKSHOP REQUEST
  • Call Us
  • +1-888-600-6441 (Corporate office hours)
  • +1-888-600-6441 (US/Can toll free)
  • +44-800-368-9399 (UK office hours)
CONNECT WITH US
ABOUT TRUST ONLINE
©2024 MarketsandMarkets Research Private Ltd. All rights reserved
DMCA.com Protection Status Website Feedback