Antistatic Agents Market by Form (Liquid, Powder), Product (Ethoxylated Fatty Acid Amines, Glycerol Monostearate, Diethanolamides), Polymer (PP, ABS, PE, PVC), End-Use Industry (Packaging, Automotive, Electronics), and Region - Global Forecast to 2024


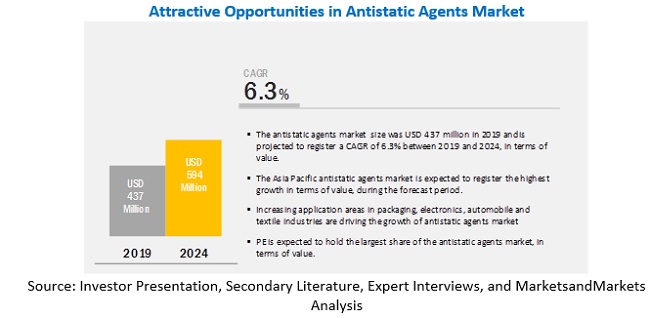
MarketsandMarkets forecasts the antistatic agents market to grow from USD 437 million to USD 594 million by 2024, at a CAGR of 6.3% from 2019 to 2024. The growth of this market can be attributed to the increasing demand for antistatic agents from the packaging, electronics, and textiles industries. Rising population, ongoing urbanization, and increasing disposable income of the middle-class population are the main factors that have led to the growth of packaging, electronics, and textiles industries across the globe. This, in turn, is expected to drive the growth of the antistatic agents market, worldwide.
The ethoxylated fatty acid amines segment is projected to grow at the highest CAGR during the forecast period, in terms of value
Based on product, the ethoxylated fatty acid amines segment of the antistatic agents market is projected to grow at the highest CAGR from 2019 to 2024, in terms of value and volume. The growth of this segment can be attributed to the high processing stability of ethoxylated fatty acid amines and improved performance benefits offered by them as compared to other types of antistatic agents. Ethoxylated fatty acid amines are the widely used antistatic agents in the manufacturing of films & sheets used in the packaging industry to remove or reduce the static charge build-up over their surfaces.
Based on form, the liquid segment is projected to lead the antistatic agents market during the forecast period, in terms of value
The liquid segment is estimated to account for the largest share of the antistatic agents market in 2019, in terms of value. Liquid antistatic agents have a higher tendency to migrate over the material surfaces as compared to other forms of antistatic agents. These agents are used mainly in spraying and efficient dyeing applications. The application of liquid antistatic agents results in non-sticky surfaces and effective antistatic properties, which improve the weaving operations in the textiles industry. These ionic liquids can be transparent or translucent and as such, do not hamper the optical properties of the final products.
By end-use industry, the packaging industry is expected to lead the antistatic agents market during the forecast period
Major end-use industries in the antistatic agents market include packaging, electronics, automotive, textile, and others. The demand for plastics and resins from the packaging industry is growing at a rapid pace. Antistatic agents are one of the major functional agents used in the plastic industry for processing of plastic resins. Major challenges faced by manufacturers of antistatic agents include efficient management of wastes and disposables that are generated by packaging and electronics industries.
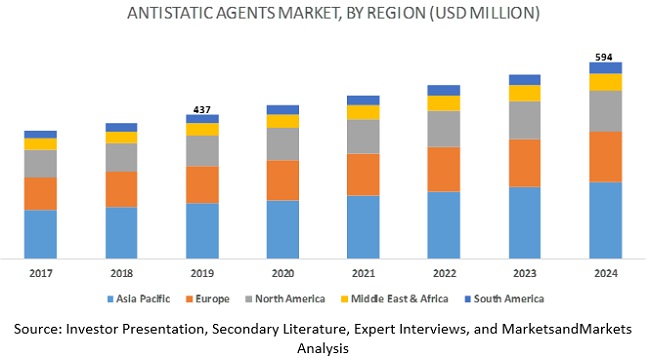
Asia Pacific is expected to hold the largest share of the antistatic agents market during the forecast period.
The Asia Pacific region is estimated to account for the largest share of the antistatic agents market in 2019 in terms of value and volume, followed by the European and North American regions. China is one of the major consumers of antistatic agents in the Asia Pacific region. Improving lifestyle of the population, increasing investments in the packaging industry, and flourishing electronics, automotive, and textiles industries in Asia Pacific are fuelling the demand for antistatic agents in the region, thereby contributing to the growth of the Asia Pacific antistatic agents market.
Market Dynamics
Driver: Increasing demand for antistatic agents from various end-use industries
The demand for antistatic agents from various end-use industries such as packaging, electronics, textiles, automotive, etc. is continuously increasing to remove or reduce the static charge accumulation that hampers different processes. Rising population, ongoing urbanization, and increasing disposable income of the middle-class population are factors that have led to the growth of the food processing and food packaging sectors, worldwide. Moreover, the organized retail sector is also flourishing, globally, along with the emergence of supermarkets & convenient stores that have led to the increased demand for branded and packaged food items. This, in turn, is fueling the growth of the food packaging sector, which is significantly contributing to the increased demand for antistatic agents. Antistatic agents are widely used in the automotive industry for manufacturing interior and exterior body parts of automobiles. These agents are used to eliminate the static charge in plastic components that are used in fuel systems, electrical and electronic components, dashboards, seat belts, and engines of automobiles. In the textiles industry, antistatic agents are used to remove the static charge in textiles by enhancing their antistatic properties. In the textiles industry, fabrics are manufactured by high-speed spinning and weaving processes that lead to the accumulation of static charge over their surfaces. This static charge disturbs the manufacturing line and may also result in extreme electric shocks. It may also cause several problems such as increasing the clinging tendency of fabrics or creating a spark that may cause a fire. Hence, antistatic agents are used during the manufacturing of fabrics to avoid such hazards and delays in the manufacturing processes by adding them to the bulk or spraying them over the surface of fabrics.
Restraint: Formulation and stringent implementation of rules & regulations related to packaging films for food & beverages
The formulation and stringent implementation of rules & regulations by the US Food and Drug Administration (FDA) and the European Food Safety Authority (EFSA) regarding the use of antistatic agents in the food & beverages packaging sector are expected to restrain the growth of the antistatic agents market. According to these regulations, the use of certain antistatic agents in packaging films that have direct contact with food products is restricted. Though these rules & regulations are amended at regular intervals, they act as a restraint impacting the growth of the antistatic agents market.
Opportunity: Development of new and improved antistatic agents
There is an increasing demand for antistatic agents from various end-use industries such as packaging, textiles, and electronics. Polyethylene films laced with antistatic agents are the most widely used films as they do not let the static charge accumulate over their surface. They are mainly used in the electronics and textiles industries. Hence, the leading players in the antistatic agents market are focusing on carrying out R&D activities to develop antistatic agents that can be used in different industries for different applications. With the increased demand of green antistatic agents and stringent implementation of regulations by several countries regarding the use of antistatic agents in the food & beverages industry, there is a requirement for the development of new and improved antistatic agents. This, in turn, is expected to lead to advancements in the field of antistatic agents.
Challenge: Management of plastic wastes generated from the packaging and electronic industries
The packaging and electronics industries produce wastes in large quantities that are not only difficult to dispose-off but can also have an adverse effect on the environment. Accumulation of plastics on the earth�s surface has adverse effects on human life and wildlife habitats. As the decomposition of plastics is very slow, it results in health hazards to living organisms as well as impacts marine life by polluting land, water, and air. Due to the durability of low-cost plastics, they are widely used in the manufacturing of various packaging items and films that are used in the food & beverages and agricultural industries. It is difficult for end users to manage plastic wastes that are generated from these industries. Hence, several countries across the globe have imposed bans on the use of plastic products and are implementing various regulatory norms related to their use, thereby affecting the growth of the packaging sector. As the packaging industry is one of the key end-use industries for antistatic agents, a decline in demand for plastic packaging acts as a key challenge for the manufacturers of antistatic agents.
Scope of the Report
|
Report Metric |
Details |
|
Market size available for years |
2017�2024 |
|
Base year considered |
2018 |
|
Forecast period |
2019�2024 |
|
Forecast units |
Volume (Tons) & Value (USD Million) |
|
Segments covered |
Form, Polymer, Product, End-use Industry, and Region |
|
Geographies covered |
Asia Pacific, North America, Europe, the Middle East & Africa, and South America |
|
Companies covered |
BASF SE (Germany), Arkema (France), Clariant (Switzerland), Croda International PLC. (UK), DowDuPont (US), Evonik Industries AG (Germany), Nouryon (Netherlands), Solvay S.A. (Belgium), PolyOne Corporation (US), Riken Vitamin Co., Ltd. (Japan), Mitsubishi Chemical Corporation (Japan), and Kao Group (Japan) Total 25 major players covered. |
Markets covered
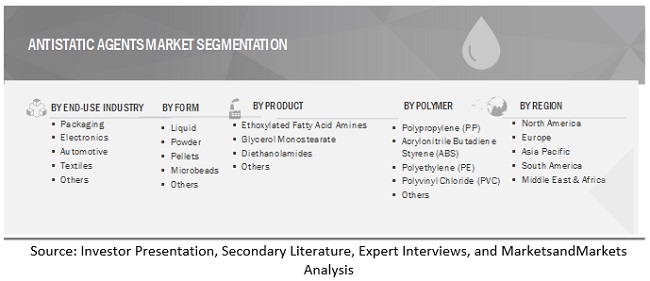
The research report categorizes the antistatic agents market to forecast the revenues and analyze the trends in each of the following sub-segments:
Based on form, the antistatic agents market has been segmented as follows:
- Liquid
- Powder
- Pellets
- Microbeads
- Others
Based on product, the antistatic agents market has been segmented as follows:
- Ethoxylated Fatty Acid Amines
- Glycerol Monostearate
- Diethanolamides
- Others (Alkyl Sulfonate, Quaternary Ammonium Salts, Liquid Electrolyte Solutions, Molten Salts, Metals, and Carbon Blacks)
Based on polymer, the antistatic agents market has been segmented as follows:
- Polypropylene (PP)
- Acrylonitrile Butadiene Styrene (ABS)
- Polyethylene (PE)
- Polyvinyl Chloride (PVC)
- Others (Polystyrene, Polyethylene Terephthalate, Polylactic Acid, Ethylene Vinyl Acetate, Wax, Polyesters, Polyamides, and Fluoropolymers)
Based on end-use industry, the antistatic agents market has been segmented as follows:
- Packaging
- Electronics
- Automotive
- Textiles
- Others (Footwear, Pharmaceuticals, and Furniture)
Based on region, the antistatic agents market has been segmented as follows:
- North America
- Europe
- Asia Pacific
- South America
- Middle East & Africa
Key Market Players
BASF SE (Germany), Arkema (France), Clariant (Switzerland), Croda International PLC.(UK), DowDuPont (US), Evonik Industries AG (Germany), Nouryon (Netherland) and Solvay S.A. (Belgium), Polyone Corporation (US), Riken Vitamin Co., Ltd. (Japan), Mitsubishi Chemical Corporation (Japan) and Kao Group (Japan) and among others
Recent Developments
- In October 2017, Clariant launches amide/amine-free anti-static concentrate for clean-room and API films which is used in the production of pharmaceutical products. This innovation was done owing to the stringent government regulation regarding the use of toxic material for producing antistatic agents. This product has helped the company to increase its market by producing a bio friendly product by helping manufacturers in the medical and pharmaceutical sectors control and minimize risk.
- In June 2019, Kao Group�s Kao Corporation has expanded its production by completing the joint venture between Kao and PT Apical of Apical Group. This joint venture is done with the view to increase the production capacity of fatty acids which are required to produce antistatic agent. With this the company has able to extend its reach and strengthen their supply chain produce high quality of products for wide range of applications.
- In October 2017, BASF SE developed a new product Elastollan� which has high antistatic, mechanical strength, abrasion resistance, a broad hardness range and a good slip resistance which makes it appropriate to be used for the safety shoe sole which can be manufactured with injection molding. This has helped the company to update its PU and TPU product portfolio.
To speak to our analyst for a discussion on the above findings, click Speak to Analyst
 Exclusive indicates content/data unique to MarketsandMarkets and not available with any competitors.
Table of Contents
1 Introduction (Page No. - 19)
1.1 Objectives of the Study
1.2 Market Definition
1.3 Study Scope
1.3.1 Markets Covered
1.3.2 Years Considered For the Study
1.4 Currency
1.5 Stakeholders
1.6 Limitations
2 Research Methodology (Page No. - 22)
2.1 Research Data
2.1.1 Secondary Data
2.1.1.1 Key Data From Secondary Sources
2.1.2 Primary Data
2.1.2.1 Key Data From Primary Sources
2.1.2.2 Key Industry Insights
2.1.2.3 Break Down of Primaries
2.2 Market Size Estimation
2.3 Market Breakdown and Data Triangulation
2.4 Assumptions
3 Executive Summary (Page No. - 29)
4 Premium Insights (Page No. - 31)
4.1 Attractive Growth Opportunities In the Antistatic Agents Market
4.2 Antistatic Agents Market, By Product
4.3 Antistatic Agents Market By Polymer and End-Use Industry
5 Market Overview (Page No. - 33)
5.1 Introduction
5.2 Market Dynamics
5.2.1 Drivers
5.2.1.1 Increasing Demand For Antistatic Agents From Various End-Use Industries
5.2.1.2 Growing Adoption of Green Antistatic Agents Across the Globe
5.2.2 Restraints
5.2.2.1 Formulation and Stringent Implementation of Rules & Regulations Related to Packaging Films For Food & Beverages
5.2.2.2 Volatility In the Prices of Raw Materials
5.2.3 Opportunities
5.2.3.1 Development of New and Improved Antistatic Agents
5.2.4 Challenges
5.2.4.1 Management of Plastic Wastes Generated From the Packaging and Electronic Industries
5.2.4.2 Lack of Proper Regulations to Monitor the Use of Antistatic Agents In Emerging Economies
5.3 Porter�s Five Forces Analysis
5.3.1 Threat of New Entrants
5.3.2 Threat of Substitutes
5.3.3 Bargaining Power of Suppliers
5.3.4 Bargaining Power of Buyers
5.3.5 Intensity of Competitive Rivalry
6 Antistatic Agents Market, By Category (Page No. - 39)
6.1 Introduction
6.2 External Antistatic Agents
6.2.1 Topical Antistatic Agents
6.3 Internal Antistatic Agents
6.3.1 Migratory Antistatic Agents
6.3.1.1 Cationic Antistatic Agents
6.3.1.2 Anionic Antistatic Agents
6.3.1.3 Nonionic Antistatic Agents
7 Antistatic Agents Market, By Form (Page No. - 41)
7.1 Introduction
Antistatic Agents Market, By Form, 2017�2024 (USD Million)
Antistatic Agents Market, By Form, 2017�2024 (Tons)
7.2 Liquid
Liquid Antistatic Agents Market, By Region, 2017�2024 (USD Million)
Liquid Antistatic Agents Market, By Region, 2017�2024 (Tons)
7.2.1 Greater Tendency to Migrate Into the Material Surface Compared to Other Forms Is Expected to Drive the Growth of Liquid Antistatic Agents Market.
7.3 Powder
Powder Antistatic Agents Market, By Region, 2017�2024 (USD Million)
Powder Antistatic Agents Market, By Region, 2017�2024 (Tons
7.3.1 Increasing Applications For All Kinds of Thermosetting Powder Coating Is Projected to Grow Market For Powder Form
7.4 Pellet
Pellet Antistatic Agents Market, By Region, 2017�2024 (USD Million)
Pellet Antistatic Agents Market, By Region, 2017�2024 (Tons)
7.4.1 Increasing Applications For All Kinds Of Plastics Is Projected To Grow Market For Pellet Form
7.5 Microbead
Microbead Antistatic Agents Market, By Region, 2017�2024 (USD Million)
Microbead Antistatic Agents Market, By Region, 2017�2024 (Tons)
7.5.1 Increase In Handling Is Anticipated To Grow The Market For Microbead
7.6 Others
Other Antistatic Agents Market, By Region, 2017�2024 (USD Million)
Other Antistatic Agents Market, By Region, 2017�2024 (Tons
7.6.1 Asia Pacific Region Is Expected to Lead the Others Segment of Antistatic Agent Market
8 Antistatic Agents Market, By Product (Page No. - 46)
8.1 Introduction
Antistatic Agents Market, By Product, 2017�2024 (USD Million)
Antistatic Agents Market, By Product, 2017�2024 (Tons)
8.2 Ethoxylated Fatty Acid Amines
Ethoxylated Fatty Acid Amines Antistatic Agents Market, By Region, 2017�2024 (USD Million)
Ethoxylated Fatty Acid Amines Antistatic Agents Market, By Region, 2017�2024 (Tons)
8.2.1 Increasing Demand For Polyethylene Films & Sheets Is Projected to Drive the Market For Ethoxylated Fatty Acid Amines
8.3 Glycerol Monostearate
Glycerol Monostearate Antistatic Agents Market, By Region, 2017�2024 (USD Million)
Glycerol Monostearate Antistatic Agents Market, By Region, 2017�2024 (Tons)
8.3.1 Glycerol Monostearate Product Is Expected to Grow Antistatic Agents Market, Owing to Its High Heat Stability Properties.
8.4 Diethanolamides
Diethanolamides Antistatic Agents Market, By Region, 2017�2024 (USD Million)
Diethanolamides Antistatic Agents Market, By Region, 2017�2024 (Tons)
8.4.1 High Compatibility of Diethanolamide With Various Commodity Plastics has Led Its Growth In Antistatic Agent Market
8.5 Others
Other Antistatic Agents Market, By Region, 2017�2024 (USD Million)
Other Antistatic Agents Market, By Region, 2017�2024 (Tons)
8.5.1 Increasing Demand Form Textile Industries has Anticipated the Growth For Others Segment of Antistatic Agents
9 Antistatic Agents Market, By Polymer (Page No. - 52)
9.1 Introduction
Antistatic Agents Market, By Polymer, 2017�2024 (USD Million)
Antistatic Agents Market, By Polymer, 2017�2024 (Tons)
9.2 Polypropylene (PP)
Polypropylene Antistatic Agents Market, By Region, 2017�2024 (USD Million)
Polypropylene Antistatic Agents Market, By Region, 2017�2024 (Tons)
9.2.1 Versatility and Compatibility of PP With Other Polymer and Additives has Led to Increase Its Use For Producing Antistatic Additives
9.2.2 Polypropylene Homopolymers
9.2.3 Polypropylene Copolymers
9.3 Acrylonitrile Butadiene Styrene (ABS)
Acrylonitrile Butadiene Styrene Antistatic Agents Market, By Region, 2017�2024 (USD Million)
Acrylonitrile Butadiene Styrene Antistatic Agents Market, By Region, 2017�2024 (Tons)
9.3.1 Increasing Applications In Automobile and Electronic Products Is Expected Grow ABS Polymer In Antistatic Agent Market
9.3.2 Automobile Components
9.3.3 Electronic Products
9.3.4 Consumer Products
9.4 Polyethylene (PE)
Polyethylene Antistatic Agents Market, By Region, 2017�2024 (USD Million)
Polyethylene Antistatic Agents Market, By Region, 2017�2024 (Tons)
9.4.1 PE Polymer Is Expected to Grow Antistatic Agents Market, Owing to Its Increased Applications In Various Industries.
9.4.2 Linear Low-Density Polyethylene (LIDPE)
9.4.3 Low-Density Polyethylene (LDPE)
9.4.4 High-Density Polyethylene (HDPE)
9.5 Polyvinyl Chloride (Pvc)
Polyvinyl Chloride Antistatic Agents Market, By Region, 2017�2024 (USD Million)
Polyvinyl Chloride Antistatic Agents Market, By Region, 2017�2024 (Tons)
9.5.1 Pvc Polymer Is Projected to Increase Antistatic Agents Market, Due to Its Increasing Use In Electronics and Healthcare Industries.
9.5.2 Rigid Pvc
9.5.3 Flexible Pvc
9.6 Others
Others Antistatic Agents Market, By Region, 2017�2024 (USD Million)
Others Antistatic Agents Market, By Region, 2017�2024 (Tons)
9.6.1 Increasing Applications In Various Industries has Led the Growth of Others Segment of Antistatic Agents Market
10 Antistatic Agents Market, By End-Use Industry (Page No. - 60)
10.1 Introduction
Antistatic Agents Market, By End-Use Industry, 2017�2024 (USD Million)
Antistatic Agents Market, By End-Use Industry, 2017�2024 (Tons)
10.2 Packaging
Antistatic Agents Market For Packaging, By Region, 2017�2024 (USD Million)
Antistatic Agents Market For Packaging, By Region, 2017�2024 (Tons)
10.2.1 Increase In Demand to Reduce the Accumulation of Static Charge In Packaging Industry, Is Expected to Grow the Demand For Antistatic Agents Market
10.2.2 Industrial Packaging
10.2.3 Retail Packaging
10.2.4 Consumer Packaging
10.3 Electronics
Antistatic Agents Market For Electronics, By Region, 2017�2024 (USD Million)
Antistatic Agents Market For Electronics, By Region, 2017�2024 (Tons)
10.3.1 Lower Cost and Insulation Properties of Plastics has Increased the Demand For Antistatic Agent
10.3.2 Electronic Transport Systems
10.3.3 Electronic Components
10.3.4 Electronic Packaging
10.4 Automotive
Antistatic Agents Market For Auotmotive, By Region, 2017�2024 (USD Million)
Antistatic Agents Market For Automotive, By Region, 2017�2024 (Tons)
10.4.1 Increasing Use of Plastics In Automotive Industries Is Projected to Grow the Demand For Antistatic Agents.
10.4.2 Oem Parts
10.4.3 Interior Components
10.4.4 Exterior Components
10.4.5 Aftermarket Parts
10.5 Textiles
Antistatic Agents Market For Textile, By Region, 2017�2024 (USD Million)
Antistatic Agents Market For Textile, By Region, 2017�2024 (Tons)
10.5.1 Technological Advancement Such as High Speed Spinning and Weaving In the Textile Industry Is Anticipated to Increase Demand For Antistatic Agents.
10.5.2 Carpets
10.5.3 Synthetic Fibers
10.5.4 Natural Fibers
10.5.5 Fabric Softeners
10.6 Others
Antistatic Agents Market For Other, By Region, 2017�2024 (USD Million)
Antistatic Agents Market For Other, By Region, 2017�2024 (Tons)
10.6.1 Increasing Application From Various End-Use Industries Is Driving the Growth of Antistatic Agents Market
11 Regional Analysis (Page No. - 68)
11.1 Introduction
11.2 North America
11.2.1 North America Antistatic Agents Market, By Country, 2017�2024 (USD Million)
North America Antistatic Agents Market, By Country, 2017�2024 (Tons)
11.2.2 North America Antistatic Agents Market, By Application, 2017�2024 (USD Million)
North America Antistatic Agents Market, By Application, 2017�2024 (Tons)
11.2.3 North America Antistatic Agents Market, By Additive, 2017�2024 (USD Million)
North America Antistatic Agents Market, By Additive, 2017�2024 (Tons)
11.2.4 North America Antistatic Agents Market, By End-Use Industry, 2017�2024 (USD Million)
North America Antistatic Agents Market, By End-Use Industry, 2017�2024 (Tons)
11.2.5 US
11.2.5.1 US Is Projected to Lead the North America Antistatic Agents Market From 2019 to 2024
11.2.6 Canada
11.2.6.1 Increased Automobile Production In Canada Is Expected to Drive the Growth of the Antistatic Agents Market In the Country
11.2.7 Mexico
11.2.7.1 Increased Production of Automotive Parts and Rise In Demand For Plastics Used In Packaging Materials are Expected to Drive the Growth of the Antistatic Agents Market In Mexico
11.3 Europe
11.3.1 Europe Antistatic Agents Market, By Country, 2017�2024 (USD Million)
Europe Antistatic Agents Market, By Country, 2017�2024 (Tons)
11.3.2 Europe Antistatic Agents Market, By Application, 2017�2024 (USD Million)
Europe Antistatic Agents Market, By Application, 2017�2024 (Tons)
11.3.3 Europe Antistatic Agents Market, By Additive, 2017�2024 (USD Million)
Europe Antistatic Agents Market, By Additive, 2017�2024 (Tons)
11.3.4 Europe Antistatic Agents Market, By End-Use Industry, 2017�2024 (USD Million)
Europe Antistatic Agents Market, By End-Use Industry, 2017�2024 (Tons)
11.3.5 Germany
11.3.5.1 Germany Is Projected to Lead the European Antistatic Agents Market During the Forecast Period In Terms of Volume
11.3.6 Russia
11.3.6.1 Flourishing Textiles Industry of Russia Is Expected to Drive the Growth of the Antistatic Agents Market In the Country
11.3.7 Italy
11.3.7.1 Increasing Consumption of Antistatic Agents In Various End-Use Industries Is Expected to Drive the Growth of the Antistatic Agents Market In Italy
11.3.8 France
11.3.8.1 Increasing Foreign Investments In Various End-Use Industries are Expected to Fuel the Growth of the Antistatic Agents Market In France
11.3.9 UK
11.3.9.1 Flourishing Flexible Packaging Industry In the Country Is Expected to Drive the Growth of the Antistatic Agents Market In the UK
11.3.10 Spain
11.3.10.1 Increasing Consumption of Packaging Materials In the Country Is Expected to Fuel the Growth of the Antistatic Agents Market In Spain
11.3.11 Rest of Europe
11.3.11.1 Initiatives Undertaken By Governments of Different Countries of the Region to Promote their Manufacturing Sectors are
Expected to Contribute to the Growth of the Antistatic Agents Market In the Rest of Europe
11.4 South America
11.4.1 South America Antistatic Agents Market, By Country, 2017�2024 (USD Million)
South America Antistatic Agents Market, By Country, 2017�2024 (Tons)
11.4.2 South America Antistatic Agents Market, By Application, 2017�2024 (USD Million)
South America Antistatic Agents Market, By Application, 2017�2024 (Tons)
11.4.3 South America Antistatic Agents Market, By Additive, 2017�2024 (USD Million)
South America Antistatic Agents Market, By Additive, 2017�2024 (Tons)
11.4.4 South America Antistatic Agents Market, By End-Use Industry, 2017�2024 (USD Million)
South America Antistatic Agents Market, By End-Use Industry, 2017�2024 (Tons)
11.4.5 Brazil
11.4.5.1 Increased Automotive Production In Brazil Is Expected to Fuel the Demand For Antistatic Agents In the Country
11.4.6 Argentina
11.4.6.1 Growth of Various End-Use Industries In the Country Is Expected to Lead to the Growth of the Antistatic Agents Market In Argentina
11.4.7 Rest of South America
11.4.7.1 Growth of Antistatic Agents In Various Countries of the Region Is Expected to Fuel the Growth of the Rest of South America Antistatic Agents Market
11.5 Asia Pacific
Asia Pacific Antistatic Agents Market, By Country, 2017�2024 (USD Million)
Asia Pacific Antistatic Agents Market, By Country, 2017�2024 (Tons)
11.5.1 Asia Pacific Antistatic Agents Market, By Application, 2017�2024 (USD Million)
Asia Pacific Antistatic Agents Market, By Application, 2017�2024 (Tons)
11.5.2 Asia Pacific Antistatic Agents Market, By Additive, 2017�2024 (USD Million)
Asia Pacific Antistatic Agents Market, By Additive, 2017�2024 (Tons)
11.5.3 Asia Pacific Antistatic Agents Market, By End-Use Industry, 2017�2024 (USD Million)
Asia Pacific Antistatic Agents Market, By End-Use Industry, 2017�2024 (Tons)
11.5.4 China
11.5.4.1 In Terms of Value, China Is Projected to Lead the Asia Pacific Antistatic Agents Market During the Forecast Period
11.5.5 Japan
11.5.5.1 Advent of New and Innovative Automobile Production Technologies Is Projected to Fuel the Growth of the Antistatic Agents Market In Japan
11.5.6 India
11.5.6.1 Availability of Cheap Labor and Rise In the Inflow of Fdi In the Manufacturing Sector of the Country are Fueling the Growth of the Antistatic Agents Market In India
11.5.7 Indonesia
11.5.7.1 Growing Demand For Antistatic Agents From the Packaging Films & Sheets and Textiles Industries Is Expected to Contribute to the Growth of the Antistatic Agents Market In Indonesia
11.5.8 South Korea
11.5.8.1 Technological Advancements In the Field of Electronics and Semiconductors In the Country are Projected to Drive the Growth of the Antistatic Agents Market In South Korea
11.5.9 Rest of Asia Pacific
11.5.9.1 Growth of Various End-Use Industries Is Expected to Lead to the Increased Consumption of Antistatic Agents In the Rest of Asia Pacific
11.6 Middle East & Africa (MEA)
Middle East & Africa Antistatic Agents Market, By Country, 2017�2024 (USD Million)
Middle East & Africa Antistatic Agents Market, By Country, 2017�2024 (Tons)
11.6.1 Middle East & Africa Antistatic Agents Market, By Application, 2017�2024 (USD Million)
Middle East & Africa Antistatic Agents Market, By Application, 2017�2024 (Tons)
11.6.2 Middle East & Africa Antistatic Agents Market, By Additive, 2017�2024 (USD Million)
Middle East & Africa Antistatic Agents Market, By Additive, 2017�2024 (Tons)
11.6.3 Middle East & Africa Antistatic Agents Market, By End-Use Industry, 2017�2024 (USD Million)
Middle East & Africa Antistatic Agents Market, By End-Use Industry, 2017�2024 (Tons)
11.6.4 Saudi Arabia
11.6.4.1 Increasing Demand For Antistatic Agents From the Packaging and Automobiles Industries Is Fueling the Growth of the Saudi Arabia Antistatic Agents Market
11.6.5 UAE
11.6.5.1 Increasing Use of Electronic Products and Appliances Is Expected to Fuel the Growth of the UAE Antistatic Agents Market
11.6.6 South Africa
11.6.6.1 Growing Application of Antistatic Agents In Various End-Use Industries Is Driving the Growth of the Antistatic Agents Market In South Africa
11.6.7 Rest of Middle East & Africa
11.6.7.1 Rising Demand For Antistatic Agents From the Automotive and Furniture Sectors Is Projected to Propel the Growth of the
Antistatic Agents Market In the Rest of Middle East & Africa
12 Competitive Landscape (Page No. - 113)
12.1 Introduction
12.1.1 Visionaries
12.1.2 Innovators
12.1.3 Dynamic Differentiators
12.1.4 Emerging Companies
12.2 Ranking of Key Market Players In the Antistatic Agents Market, 2018
13 Company Profiles (Page No. - 115)
(Business Overview, Products & Services Offered, Recent Developments, SWOT Analysis & MnM View)*
13.1 BASF SE
13.2 Nouryon
13.3 Dowdupont
13.4 Clariant
13.5 Croda International Plc.
13.6 Arkema
13.7 Evonik Industries AG
13.8 Solvay S.A.
13.9 Polyone Corporation
13.10 Riken Vitamin Co., Ltd.
13.11 KAO Group
13.12 Mitsubishi Chemical Corporation
13.13 Other Key Players
13.13.1 Kenrich Petrochemicals Inc.
13.13.2 Fine Organics
13.13.3 Corbion N.V.
13.13.4 Palsgaard
13.13.5 Emery Oleochemicals
13.13.6 Tosaf Compounds Ltd.
13.13.7 Ilshinwells
13.13.8 Lamberti S.P.A.
13.13.9 Foster Corporation
13.13.10 Adeka Europe GmbH
13.13.11 Blend Colours
13.13.12 New Japan Chemical Co., Ltd.
13.13.13 Welsum Technology Co., Ltd.
*Details on Business Overview, Products & Services Offered, Recent Developments, SWOT Analysis & MnM View Might Not Be Captured In Case of Unlisted Companies.
14 Appendix (Page No. - 147)
14.1 Industry Experts
14.2 Discussion Guide
14.3 Knowledge Store: Marketsandmarkets� Subscription Portal
14.4 Available Customizations
14.5 Related Reports
14.6 Author Details
List of Tables (138 Tables)
Table 1 Antistatic Agents Market, By Form, 2017�2024 (USD Million)
Table 2 Market, By Form, 2017�2024 (Tons)
Table 3 Market of Liquid Antistatic Agents, By Region, 2017�2024 (USD Million)
Table 4 Market of Liquid Antistatic Agents, By Region, 2017�2024 (Tons)
Table 5 Market of Powder Antistatic Agents, By Region, 2017�2024 (USD Million)
Table 6 Market of Powder Antistatic Agents, By Region, 2017�2024 (Tons)
Table 7 Market of Other Antistatic Agents, By Region, 2017�2024 (USD Million)
Table 8 Market of Other Antistatic Agents, By Region, 2017�2024 (Tons)
Table 9 Antistatic Agents Market, By Product, 2017�2024 (USD Million)
Table 10 Market, By Product, 2017�2024 (Tons)
Table 11 Market of Ethoxylated Fatty Acid Amines Antistatic Agents, By Region, 2017�2024 (USD Million)
Table 12 Market of Ethoxylated Fatty Acid Amines Antistatic Agents, By Region, 2017�2024 (Tons)
Table 13 Market of Glycerol Monostearate Amines Antistatic Agents, By Region, 2017�2024 (USD Million)
Table 14 Market of Glycerol Monostearate Amines Antistatic Agents, By Region, 2017�2024 (Tons)
Table 15 Market of Diethanolamides Antistatic Agents, By Region, 2017�2024 (USD Million)
Table 16 Market of Diethanolamides Antistatic Agents, By Region, 2017�2024 (Tons)
Table 17 Market of Other Antistatic Agents, By Region, 2017�2024 (USD Million)
Table 18 Market of Other Antistatic Agents, By Region, 2017�2024 (Tons)
Table 19 Antistatic Agents Market, By Polymer, 2017�2024 (USD Million)
Table 20 Market, By Polymer, 2017�2024 (Tons)
Table 21 Market of Polypropylene Antistatic Agents, By Region, 2017�2024 (USD Million)
Table 22 Market of Polypropylene Antistatic Agents, By Region, 2017�2024 (Tons)
Table 23 Market of Acrylonitrile Butadiene Styrene Antistatic Agents, By Region, 2017�2024 (USD Million)
Table 24 Market of Acrylonitrile Butadiene Styrene Antistatic Agents, By Region, 2017�2024 (Tons)
Table 25 Market of Polyethylene Antistatic Agents, By Region, 2017�2024 (USD Million)
Table 26 Market of Polyethylene Antistatic Agents, By Region, 2017�2024 (Tons)
Table 27 Market of Polyvinyl Chloride Antistatic Agents, By Region, 2017�2024 (USD Million)
Table 28 Market of Polyvinyl Chloride Antistatic Agents, By Region, 2017�2024 (Tons)
Table 29 Market of Other Antistatic Agents, By Region, 2017�2024 (USD Million)
Table 30 Market of Other Antistatic Agents, By Region, 2017�2024 (Tons)
Table 31 Antistatic Agents Market, By End-Use Industry, 2017�2024 (USD Million)
Table 32 Market, By End-Use Industry, 2017�2024 (Tons)
Table 33 Market For Packaging, By Region, 2017�2024 (USD Million)
Table 34 Market For Packaging, By Region, 2017�2024 (Tons)
Table 35 Market For Electronics, By Region, 2017�2024 (USD Million)
Table 36 Market For Electronics, By Region, 2017�2024 (Tons)
Table 37 Market For Automotive, By Region, 2017�2024 (USD Million)
Table 38 Market For Automotive, By Region, 2017�2024 (Tons)
Table 39 Market For Textiles, By Region, 2017�2024 (USD Million)
Table 40 Market For Textiles, By Region, 2017�2024 (Tons)
Table 41 Market For Other End-Use Industries, By Region, 2017�2024 (USD Million)
Table 42 Market For Other End-Use Industries, By Region, 2017�2024 (Tons)
Table 43 Market, By Region, 2017�2024 (USD Million)
Table 44 Market, By Region, 2017�2024 (Tons)
Table 45 North America Antistatic Agents Market, By Country, 2017�2024 (USD Million)
Table 46 North America Market, By Country, 2017�2024 (Tons)
Table 47 North America Market, By End-Use Industry, 2017�2024 (USD Million)
Table 48 North America Market, By End-Use Industry, 2017�2024 (Tons)
Table 49 North America Market, By Polymer, 2017�2024 (USD Million)
Table 50 North America Market, By Polymer, 2017�2024 (Tons)
Table 51 North America Market, By Product, 2017�2024 (USD Million)
Table 52 North America Market, By Product, 2017�2024 (Tons)
Table 53 North America Market, By Form, 2017�2024 (USD Million)
Table 54 North America Market, By Form, 2017�2024 (Tons)
Table 55 US Market, By End-Use Industry, 2017�2024 (USD Million)
Table 56 US Market, By End-Use Industry, 2017�2024 (Tons)
Table 57 Canada Market, By End-Use Industry, 2017�2024 (USD Million)
Table 58 Canada Market, By End-Use Industry, 2017�2024 (Tons)
Table 59 Mexico Market, By End-Use Industry, 2017�2024 (USD Million)
Table 60 Mexico Market, By End-Use Industry, 2017�2024 (Tons)
Table 61 Europe Antistatic Agents Market, By Country, 2017�2024 (USD Million)
Table 62 Europe Market, By Country, 2017�2024 (Tons)
Table 63 Europe Market, By End-Use Industry, 2017�2024 (USD Million)
Table 64 Europe Market, By End-Use Industry, 2017�2024 (Tons)
Table 65 Europe Market, By Product, 2017�2024 (USD Million)
Table 66 Europe Market, By Product, 2017�2024 (Tons)
Table 67 Europe Market, By Polymer, 2017�2024 (USD Million)
Table 68 Europe Market, By Polymer, 2017�2024 (Tons)
Table 69 Europe Market, By Form, 2017�2024 (USD Million)
Table 70 Europe Market, By Form, 2017�2024 (Tons)
Table 71 Germany Market, By End-Use Industry, 2017�2024 (USD Million)
Table 72 Germany Market, By End-Use Industry, 2017�2024 (Tons)
Table 73 Russia Market, By End-Use Industry, 2017�2024 (USD Million)
Table 74 Russia Market, By End-Use Industry, 2017�2024 (Tons)
Table 75 Italy Market, By End-Use Industry, 2017�2024 (USD Million)
Table 76 Italy Market, By End-Use Industry, 2017�2024 (Tons)
Table 77 France Market, By End-Use Industry, 2017�2024 (USD Million)
Table 78 France Market, By End-Use Industry, 2017�2024 (Tons)
Table 79 UK Market, By End-Use Industry, 2017�2024 (USD Million)
Table 80 UK Market, By End-Use Industry, 2017�2024 (Tons)
Table 81 Spain Market, By End-Use Industry, 2017�2024 (USD Million)
Table 82 Spain Market, By End-Use Industry, 2017�2024 (Tons)
Table 83 Rest of Europe Market, By End-Use Industry, 2017�2024 (USD Million)
Table 84 Rest of Europe Market, By End-Use Industry, 2017�2024 (Tons)
Table 85 South America Antistatic Agents Market, By Country, 2017�2024 (USD Million)
Table 86 South America Market, By Country, 2017�2024 (Tons)
Table 87 South America Market, By End-Use Industry, 2017�2024 (USD Million)
Table 88 South America Market, By End-Use Industry, 2017�2024 (Tons)
Table 89 South America Market, By Polymer, 2017�2024 (USD Million)
Table 90 South America Market, By Polymer, 2017�2024 (Tons)
Table 91 South America Market, By Product, 2017�2024 (USD Million)
Table 92 South America Market, By Product, 2017�2024 (Tons)
Table 93 Brazil Market, By End-Use Industry, 2017�2024 (USD Million)
Table 94 Brazil Market, By End-Use Industry, 2017�2024 (Tons)
Table 95 Argentina Market, By End-Use Industry, 2017�2024 (USD Million)
Table 96 Argentina Market, By End-Use Industry, 2017�2024 (Tons)
Table 97 Rest of South America Market, By End-Use Industry, 2017�2024 (USD Million)
Table 98 Rest of South America Market, By End-Use Industry, 2017�2024 (Tons)
Table 99 Asia Pacific Antistatic Agents Market, By Country, 2017�2024 (USD Million)
Table 100 Asia Pacific Market, By Country, 2017�2024 (Tons)
Table 101 Asia Pacific Market, By End-Use Industry, 2017�2024 (USD Million)
Table 102 Asia Pacific Market, By End-Use Industry, 2017�2024 (Tons)
Table 103 Asia Pacific Market, By Product, 2017�2024 (USD Million)
Table 104 Asia Pacific Market, By Product, 2017�2024 (Tons)
Table 105 Asia Pacific Market, By Polymer, 2017�2024 (USD Million)
Table 106 Asia Pacific Market, By Polymer, 2017�2024 (Tons)
Table 107 Asia Pacific Market, By Form, 2017�2024 (USD Million)
Table 108 Asia Pacific Market, By Form, 2017�2024 (Tons)
Table 109 China Market, By End-Use Industry, 2017�2024 (USD Million)
Table 110 China Market, By End-Use Industry, 2017�2024 (Tons)
Table 111 Japan Market, By End-Use Industry, 2017�2024 (USD Million)
Table 112 Japan Market, By End-Use Industry, 2017�2024 (Tons)
Table 113 India Market, By End-Use Industry, 2017�2024 (USD Million)
Table 114 India Market, By End-Use Industry, 2017�2024 (Tons)
Table 115 Indonesia Market, By End-Use Industry, 2017�2024 (USD Million)
Table 116 Indonesia Market, By End-Use Industry, 2017�2024 (Tons)
Table 117 South Korea Market, By End-Use Industry, 2017�2024 (USD Million)
Table 118 South Korea Market, By End-Use Industry, 2017�2024 (Tons)
Table 119 Rest of Asia Pacific Market, By End-Use Industry, 2017�2024 (USD Million)
Table 120 Rest of Asia Pacific Market, By End-Use Industry, 2017�2024 (Tons)
Table 121 Middle East & Africa Antistatic Agents Market, By Country, 2017�2024 (USD Million)
Table 122 Middle East & Africa Market, By Country, 2017�2024 (Tons)
Table 123 Middle East & Africa Market, By End-Use Industry, 2017�2024 (USD Million)
Table 124 Middle East & Africa Market, By End-Use Industry, 2017�2024 (Tons)
Table 125 Middle East & Africa Market, By Polymer, 2017�2024 (USD Million)
Table 126 Middle East & Africa Market, By Polymer, 2017�2024 (Tons)
Table 127 Middle East & Africa Market, By Product, 2017�2024 (USD Million)
Table 128 Middle East & Africa Market, By Product, 2017�2024 (Tons)
Table 129 Middle East & Africa Market, By Form, 2017�2024 (USD Million)
Table 130 Middle East & Africa Market, By Form, 2017�2024 (Tons)
Table 131 Saudi Arabia Market, By End-Use Industry, 2017�2024 (USD Million)
Table 132 Saudi Arabia Market, By End-Use Industry, 2017�2024 (Tons)
Table 133 UAE Market, By End-Use Industry, 2017�2024 (USD Million)
Table 134 UAE Market, By End-Use Industry, 2017�2024 (Tons)
Table 135 South Africa Market, By End-Use Industry, 2017�2024 (USD Million)
Table 136 South Africa Market, By End-Use Industry, 2017�2024 (Tons)
Table 137 Rest of Middle East & Africa Market, By End-Use Industry, 2017�2024 (USD Million)
Table 138 Rest of Middle East & Africa Market, By End-Use Industry, 2017�2024 (Tons)
List of Figures (46 Figures)
Figure 1 Antistatic Agents Market: Research Design
Figure 2 Breakdown of Primary Interviews: By Company, Designation, and Region
Figure 3 Market Size Estimation: Top-Down Approach
Figure 4 Market Size Estimation: Bottom-Up Approach
Figure 5 Data Triangulation
Figure 6 Packaging Segment Is Expected to Lead the Market of Antistatic Agents From 2019 to 2024 In Terms of Value
Figure 7 Asia Pacific Region Is Projected to Lead the Market of Antistatic Agents From 2019 to 2024
Figure 8 Antistatic Agents Market In Asia Pacific Is Projected to Grow at the Highest Rate From 2019 to 2024 In Terms of Volume
Figure 9 Ethoxylated Fatty Acid Amines Segment Is Projected to Lead the Market of Antistatic Agents From 2019 to 2024 In Terms of Volume
Figure 10 Polypropylene and Packaging End-Use Industry Segments Accounted For the Largest Market Shares of Antistatic Agents In 2018 In Terms of Volume
Figure 11 Antistatic Agents Market Dynamics
Figure 12 Porter�s Five Forces Analysis
Figure 13 Market, By Form, 2019 & 2024 (USD Million)
Figure 14 Market, By Product, 2019 & 2024 (USD Million)
Figure 15 Market, By Polymer, 2019 & 2024 (USD Million)
Figure 16 Packaging Segment of the Antistatic Agents Market Is Projected to Grow at the Highest Cagr From 2019 to 2024
Figure 17 Antistatic Agents Market In Asia Pacific Is Projected to Grow at the Highest Cagr From 2019 to 2024
Figure 18 North America Market Snapshot
Figure 19 Europe Market Snapshot
Figure 20 South America Market Snapshot
Figure 21 Asia Pacific Market Snapshot
Figure 22 Middle East Market Snapshot
Figure 23 Antistatic Agents Market: Competitive Leadership Mapping
Figure 24 BASF SE: Company Snapshot
Figure 25 BASF SE: SWOT Analysis
Figure 26 Nouryon: SWOT Analysis
Figure 27 Dowdupont: Company Snapshot
Figure 28 Dowdupont: SWOT Analysis
Figure 29 Clariant: Company Snapshot
Figure 30 Clariant: SWOT Analysis
Figure 31 Croda International Plc.: Company Snapshot
Figure 32 Croda International Plc. : SWOT Analysis
Figure 33 Arkema: Company Snapshot
Figure 34 Arkema: SWOT Analysis
Figure 35 Evonik Industries AG.: Company Snapshot
Figure 36 Evonik Industries AG.: SWOT Analysis
Figure 37 Solvay S.A.: Company Snapshot
Figure 38 Solvay S.A.: SWOT Analysis
Figure 39 Polyone Corporation.: Company Snapshot
Figure 40 Polyone Corporation: SWOT Analysis
Figure 41 Riken Vitamin Co., Ltd.: Company Snapshot
Figure 42 Riken Vitamin Co., Ltd.: SWOT Analysis
Figure 43 KAO Group: Company Snapshot
Figure 44 KAO Group: SWOT Analysis
Figure 45 Mitsubishi Chemical Corporation: Company Snapshot
Figure 46 Mitsubishi Chemical Corporation: SWOT Analysis
The study involved 4 major activities for estimating the current size of the antistatic agents market. Exhaustive secondary research was carried out to collect information on the market, its peer markets, and its parent market. The next step was to validate the findings collected from secondary sources, assumptions, and sizing with the industry experts across the value chain through primary research. Both, top-down and bottom-up approaches were employed to estimate the overall size of the antistatic agents market. Thereafter, the market breakdown and data triangulation procedures were used to estimate the size of different segments and subsegments of the market.
Secondary Research
In the secondary research process, sources such as D&B Hoovers, Bloomberg BusinessWeek, and Dun & Bradstreet were referred to for identifying and collecting information for this study on the market. Other secondary sources included annual reports, press releases & investor presentations of companies, white papers, certified publications, and articles by recognized authors, gold standard & silver standard websites, associations, regulatory bodies, trade directories, and databases.
Primary Research
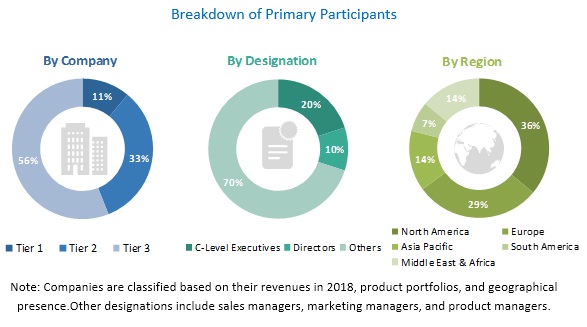
The antistatic agents market comprises stakeholders such as raw material suppliers, end product manufacturers, and regulatory agencies in the supply chain of the antistatic agents. The demand side of this market is characterized by developments taking place in the packaging, electronics, and other end-use industries. The supply side is characterized by the market consolidation activities undertaken by the manufacturers of antistatic agents. Several primary sources from both, supply and demand sides of the market were interviewed to obtain qualitative and quantitative information. Following is the breakdown of the primary respondents.
To know about the assumptions considered for the study, download the pdf brochure
Market Size Estimation:
Both, top-down and bottom-up approaches were used to estimate and validate the overall size of the antistatic agents market. These methods were also used extensively used to estimate the size of various segments and subsegments of the market. The research methodology used to estimate the market size included the following:
- Key players in the industry and markets were identified through extensive secondary research.
- The supply chain of the industry and the market size, in terms of value and volume, were determined through primary and secondary research processes.
- All percentage shares, splits, and breakdowns were determined using secondary sources and verified through primary sources.
Data Triangulation:
After arriving at the overall market size-using the market size estimation process explained above-the market was split into several segments and subsegments. The data triangulation and market breakdown procedures were employed, wherever applicable to complete the overall market engineering process and arrive at the exact statistics of each market segment and subsegment. The data was triangulated by studying various factors and trends from both, demand and supply sides.
Objectives of the Report:
- To define and describe the antistatic agents market based on form, product, polymer, end-use industry, and region
- To estimate and forecast the size of the antistatic agents market, in terms of value (USD million) and volume (tons)
- To analyze region-specific trends in North America, Europe, Asia Pacific, the Middle East & Africa, and South America
- To identify and analyze the key drivers, restraints, opportunities, and challenges impacting the growth of the antistatic agents market across the globe
- To strategically identify and profile key market players, and analyze their core competencies in the market
- To analyze competitive developments such as new product launches, expansions, mergers & acquisitions, and partnerships that have taken place in the market
Available Customizations:
Along with the market data, MarketsandMarkets offers customizations according to the specific requirements of companies. The following customization options are available for the report:
Regional Analysis
- A further breakdown of the regional antistatic agents market to the country level based on polymer
Country-level Information
- Regional market split by major countries
Company Information
- Detailed analysis and profiles of additional market players (up to 5)


Growth opportunities and latent adjacency in Antistatic Agents Market
Interested to know the market scenario of antistatic products and ongoing development of new antistatic products
antistats market for HDPE, in the US