Anti-Icing Coating Market by Substrate (Metals, Glass, Concrete & Ceramics), End-Use Industry (Automotive & Transportation, Renewable Energy, Communication Equipment, Construction and Others), and Region - Global Forecast to 2023


Anti-Icing Coating Market Size And Forecast
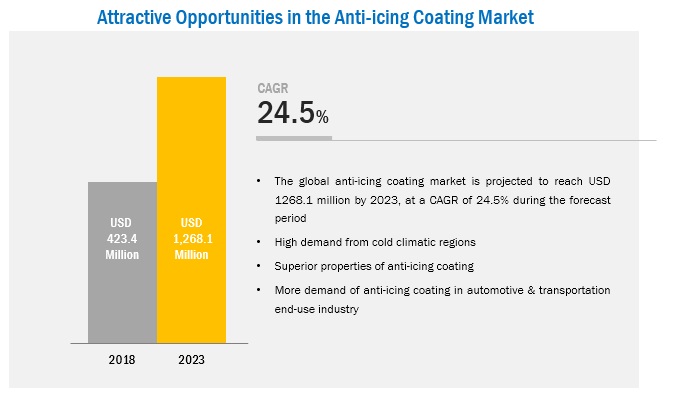
The anti-Icing coating market is projected to reach USD 1,268.1 million by 2023, at a CAGR of 24.5%. he report segments the anti-icing coating market on the basis of substrate into metals, glass, concrete & ceramics; on the basis of end-use industry into automotive & transportation, renewable energy, communication equipment, construction, and others; and on the basis of region into North America, Europe, APAC, and ROW. Base year considered for the study is 2017, while the forecast period is 2018-2023. The rise in demand for anti-icing coatings in various end-use industries, such as automotive & transportation, renewable energy, communication equipment, and construction is driving the anti-icing coating market.
Top-down and bottom-up approaches have been used to estimate and validate the size of the anti-icing coating market and various other dependent submarkets. The research study involves the use of extensive secondary sources, directories, and databases such as Hoovers, Bloomberg, Chemical Weekly, Factiva, American Coatings Associations (ACA), Japanese-European De-Icing Aircraft Collaborative Exploration (JEDI ACE), Association of European Airlines (AEA), Civil Aviation Transport Canada (CATC), Japan Aerospace Exploration Agency (JAXA), and other government and private websites to identify and collect information useful for a technical, market-oriented, and commercial study of the anti-icing coating market.
To know about the assumptions considered for the study, download the pdf brochure
Anti-icing coatings are manufactured by using silica based nanocoatings. Major players in the market are PPG (US), DowDuPont (US), Fraunhofer (Germany), Battelle (US), CG2 Nanocoatings (Canada), Aerospace & Advanced Composites (Austria), Nanosonic (US), NEI Corporation (US), Cytonix (US), NeverWet (US), and others.
Key Target Audience in Anti-Icing Coating Market
- Anti-icing Coating Manufacturers
- Raw Material Suppliers
- Traders, Distributors, and Suppliers of Anti-icing Coating
- Regional Manufacturer Associations and General Anti-icing Coating Associations
- Government & Regional Agencies and Research Organizations
- Investment Research Firms
Anti-Icing Coating Market Report Scope
This research report categorizes the anti-icing coating market on the basis of substrate, end-use industry, and region.
On the Basis of Substrate:
- Metals
- Glass
- Concrete & Ceramics
On the Basis of End-use Industry:
- Automotive & transportation
- Renewable Energy
- Communication Equipment
- Construction
- Others
On the Basis of Region:
- North America
- Europe
- APAC
- ROW
The market is further analyzed for key countries in each of these regions.
Anti-Icing Coating Market Report Available Customizations
Along with the market data, MarketsandMarkets offers customizations according to the company’s specific needs. The following customization options are available for the report:
Anti-Icing Coating Market Regional Analysis:
- Country-level analysis of varied end-use industries of anti-icing coatings
Anti-Icing Coating Market Company Information:
- Detailed analysis and profiling of additional market players
The anti-icing coating market is estimated to be USD 423.4 million in 2018 and is projected to reach USD 1,268.1 million by 2023, at a CAGR of 24.5% during the forecast period. The market is driven due to the use of anti-icing coatings in different end-use industries, namely, automotive & transportation, renewable energy, communication equipment, construction, and others. The high demand for anti-icing coating from the aerospace, automobile, marine, and rail applications of the automotive & transportation end-use industry and solar & wind energy plants of the renewable energy end-use industry is also driving the anti-icing coating market.
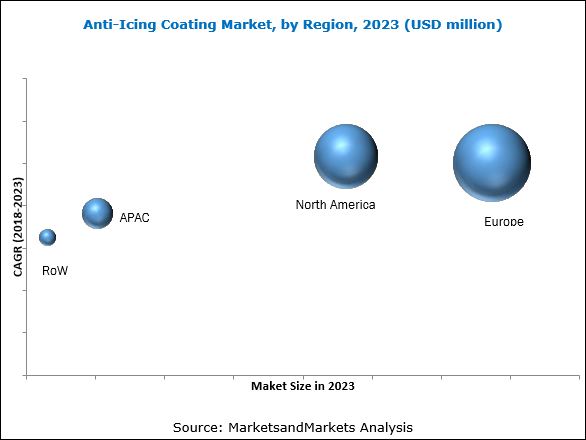
The demand for anti-icing coatings for the aircraft application and renewable energy as well as communication equipment end-use industries is high, especially in Russia, the US, Canada, and Scandinavian countries. Emerging technologies and innovations drive the demand for anti-icing coating in these industries. APAC is estimated to witness strong growth over the next 5 years after North America and Europe.
Different types of anti-icing coatings are used in end-use industries based on their application requirements and durability of products. They have distinct properties, which vary according to application requirements. These are classified based on their substrate, namely, metals, glass, and concrete & ceramics. Anti-icing coating is a replacement for the traditional method de-icing fluid containing salt and other chemicals. This market is based on its demand from various end-use industries and applied mostly on metal substrates such as aluminum, steel, and others. The growing demand for anti-icing coatings from the cold climatic regions such as Europe and North America, where average snowfall is higher than other regions, is expected to drive the market. However, government regulations and availability of substitutes are affecting market growth.
Products based on silica-based nanocoatings as other chemical solvents/salts and de-icing fluids are affecting the environment in most countries of Europe and North America. However, since these substitutes are cheaper than coatings, they are used in many applications. This factor is restraining the growth of the anti-icing coating market in these regions.
Key Players in Anti-Icing Coating Market
Key players operating in the anti-icing coating market include PPG (US), DowDuPont (US), Fraunhofer (Germany), Battelle (US), CG2 Nanocoatings (Canada), Aerospace & Advanced Composites (Austria), Nanosonic (US), NEI Corporation (US), Cytonix (US), NeverWet (US), and others. Diverse product portfolio, strategically positioned R&D centers, continuous adoption of development strategies, and technological advancements are the factors strengthening the market position of these companies. These companies have adopted various organic and inorganic growth strategies to enhance their market share in the anti-icing coating market.
Frequently Asked Questions (FAQ):
How big is the Anti-Icing Coating Market industry?
The market size of anti-icing coatings is projected to grow from USD 423.4 million in 2018 to USD 1,268.1 million by 2023, at a CAGR of 24.5% from 2018 to 2023.
Who leading market players in Anti-Icing Coating industry?
Key players profiled in the anti-icing coating market report include PPG (US), DowDuPont (US), Fraunhofer (Germany), Battelle (US), CG2 Nanocoatings (Canada), Aerospace & Advanced Composites (Austria), Nanosonic (US), NEI Corporation (US), Cytonix (US), NeverWet (US), and others.
To speak to our analyst for a discussion on the above findings, click Speak to Analyst
 Exclusive indicates content/data unique to MarketsandMarkets and not available with any competitors.
TABLE OF CONTENTS
1 INTRODUCTION (Page No. - 18)
1.1 OBJECTIVES OF THE STUDY
1.2 MARKET DEFINITION
1.3 MARKET SCOPE
FIGURE 1 ANTI-ICING COATING MARKET SEGMENTATION
1.3.1 YEARS CONSIDERED FOR THE STUDY
1.4 CURRENCY
1.5 UNITS CONSIDERED
1.6 STAKEHOLDERS
2 RESEARCH METHODOLOGY (Page No. - 21)
2.1 RESEARCH DATA
FIGURE 2 ANTI-ICING COATING MARKET: RESEARCH DESIGN
2.1.1 SECONDARY DATA
2.1.1.1 Key data from secondary sources
2.1.2 PRIMARY DATA
2.1.2.1 Key data from primary sources
2.1.2.2 Key industry insights
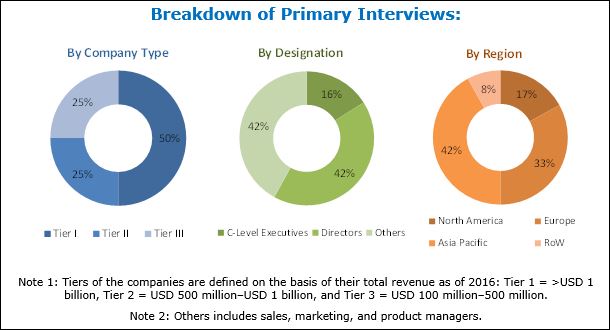
2.1.2.3 Breakdown of primary interviews
2.2 MARKET SIZE ESTIMATION
2.2.1 BOTTOM-UP APPROACH
FIGURE 3 MARKET SIZE ESTIMATION: BOTTOM-UP APPROACH
2.2.2 TOP-DOWN APPROACH
FIGURE 4 MARKET SIZE ESTIMATION: TOP-DOWN APPROACH
2.3 DATA TRIANGULATION
FIGURE 5 ANTI-ICING COATING MARKET: DATA TRIANGULATION
2.4 ASSUMPTIONS
2.5 LIMITATIONS
3 EXECUTIVE SUMMARY (Page No. - 29)
TABLE 1 ANTI-ICING COATING MARKET SNAPSHOT (2018 VS. 2023)
FIGURE 6 EUROPE TO LEAD THE ANTI-ICING COATING MARKET
FIGURE 7 AUTOMOTIVE & TRANSPORTATION TO BE THE LEADING END-USE INDUSTRY OF ANTI-ICING COATING
FIGURE 8 EUROPE IS THE LARGEST AND NORTH AMERICA TO BE THE FASTEST-GROWING ANTI-ICING COATING MARKET
4 PREMIUM INSIGHTS (Page No. - 32)
4.1 SIGNIFICANT OPPORTUNITIES IN THE ANTI-ICING COATING MARKET
FIGURE 9 COLD CLIMATIC REGIONS TO OFFER LUCRATIVE GROWTH OPPORTUNITIES TO THE MARKET PLAYERS
4.2 ANTI-ICING COATING MARKET, BY END-USE INDUSTRY
FIGURE 10 AUTOMOTIVE & TRANSPORTATION TO BE THE LARGEST END-USE INDUSTRY
4.3 ANTI-ICING COATING MARKET, BY END-USE INDUSTRY AND COUNTRY (2017)
FIGURE 11 RUSSIA ACCOUNTED FOR THE LARGEST MARKET SHARE
4.4 ANTI-ICING COATING MARKET: DEVELOPED VS. DEVELOPING COUNTRIES
FIGURE 12 ANTI-ICING COATING MARKET TO WITNESS HIGHER GROWTH IN THE DEVELOPED COUNTRIES
FIGURE 13 THE ANTI-ICING COATING MARKET IN CHINA TO REGISTER THE HIGHEST CAGR IN APAC
4.5 ANTI-ICING COATING MARKET, BY C0UNTRY
FIGURE 14 RUSSIA AND THE US TO DOMINATE THE GLOBAL ANTI-ICING COATING MARKET
5 MARKET OVERVIEW (Page No. - 35)
5.1 INTRODUCTION
5.2 MARKET DYNAMICS
FIGURE 15 OVERVIEW OF THE FACTORS GOVERNING THE ANTI-ICING COATING MARKET
5.2.1 DRIVERS
5.2.1.1 High demand in the cold climatic regions
5.2.1.2 Superior properties of anti-icing coatings
5.2.2 RESTRAINTS
5.2.2.1 Availability of cost-effective substitutes
5.2.3 OPPORTUNITIES
5.2.3.1 Growing demand in communication equipment industry
5.2.4 CHALLENGES
5.2.4.1 Stringent regulatory policies
5.3 PORTER’S FIVE FORCES ANALYSIS
5.3.1 THREAT OF NEW ENTRANTS
5.3.2 THREAT OF SUBSTITUTES
5.3.3 BARGAINING POWER OF SUPPLIERS
5.3.4 BARGAINING POWER OF BUYERS
5.3.5 INTENSITY OF COMPETITIVE RIVALRY
5.4 MACROECONOMIC OVERVIEW AND KEY TRENDS
5.4.1 INTRODUCTION
5.4.2 TRENDS AND FORECAST OF GDP
TABLE 2 TRENDS AND FORECAST OF GDP: ANNUAL PERCENTAGE CHANGE
5.4.3 TRENDS AND FORECAST OF CONSTRUCTION INDUSTRY
TABLE 3 CONTRIBUTION OF CONSTRUCTION INDUSTRY TO GDP OF NORTH AMERICA, BY COUNTRY, 2014–2021 (USD BILLION)
TABLE 4 CONTRIBUTION OF CONSTRUCTION INDUSTRY TO GDP OF EUROPE, BY COUNTRY, 2014–2021 (USD BILLION)
TABLE 5 CONTRIBUTION OF CONSTRUCTION INDUSTRY TO GDP OF APAC, BY COUNTRY, 2014–2021 (USD BILLION)
TABLE 6 CONTRIBUTION OF CONSTRUCTION INDUSTRY TO GDP OF MIDDLE EAST & AFRICA, BY COUNTRY, 2014–2021 (USD BILLION)
TABLE 7 CONTRIBUTION OF CONSTRUCTION INDUSTRY TO GDP OF SOUTH AMERICA, BY COUNTRY, 2014–2021 (USD BILLION)
5.4.4 TRENDS AND FORECAST OF AUTOMOTIVE INDUSTRY
TABLE 8 AUTOMOTIVE PRODUCTION, BY REGION/COUNTRY, 2014–2017 (THOUSAND UNIT)
5.4.5 TRENDS AND FORECAST OF AEROSPACE INDUSTRY
TABLE 9 GLOBAL GROWTH INDICATORS OF AEROSPACE INDUSTRY, 2016–2035
TABLE 10 GROWTH INDICATORS OF AEROSPACE INDUSTRY, BY REGION, 2016–2035
TABLE 11 NEW AIRPLANE DELIVERIES, BY REGION, 2016–2035
5.4.6 TRENDS AND FORECAST OF WIND ENERGY INDUSTRY
TABLE 12 WIND ENERGY INSTALLATIONS, BY REGION, 2017–2021 (GW)
6 ANTI-ICING COATING MARKET, BY SUBSTRATE (Page No. - 44)
6.1 INTRODUCTION
FIGURE 16 METAL IS THE LARGEST SUBSTRATE TYPE FOR ANTI-ICING COATING
6.2 METALS
6.3 GLASS
6.4 CONCRETE & CERAMICS
7 ANTI-ICING COATING MARKET, BY END-USE INDUSTRY (Page No. - 46)
7.1 INTRODUCTION
FIGURE 17 AUTOMOTIVE & TRANSPORTATION TO BE THE DOMINANT CONSUMER OF ANTI-ICING COATING, 2018 VS. 2023
TABLE 13 ANTI-ICING COATING MARKET SIZE, BY END-USE INDUSTRY, 2016–2023 (USD THOUSAND)
TABLE 14 ANTI-ICING COATING MARKET SIZE, BY END-USE INDUSTRY, 2016–2023 (TON)
7.2 AUTOMOTIVE & TRANSPORTATION
7.2.1 AIRCRAFT & AVIATION
7.2.2 AUTOMOBILES
7.2.3 MARINE
7.2.4 RAIL
TABLE 15 ANTI-ICING COATING MARKET SIZE IN AUTOMOTIVE & TRANSPORTATION, BY REGION, 2016–2023 (USD THOUSAND)
TABLE 16 ANTI-ICING COATING MARKET SIZE IN AUTOMOTIVE & TRANSPORTATION, BY REGION, 2016–2023 (TON)
7.3 RENEWABLE ENERGY
7.3.1 SOLAR ENERGY PLANTS
7.3.2 WIND ENERGY PLANTS
TABLE 17 ANTI-ICING COATING MARKET SIZE IN RENEWABLE ENERGY, BY REGION, 2016–2023 (USD THOUSAND)
TABLE 18 ANTI-ICING COATING MARKET SIZE IN RENEWABLE ENERGY, BY REGION, 2016–2023 (TON)
7.4 COMMUNICATION EQUIPMENT
TABLE 19 ANTI-ICING COATING MARKET SIZE IN COMMUNICATION EQUIPMENT, BY REGION, 2016–2023 (USD THOUSAND)
TABLE 20 ANTI-ICING COATING MARKET SIZE IN COMMUNICATION EQUIPMENT, BY REGION, 2016–2023 (TON)
7.5 CONSTRUCTION
TABLE 21 ANTI-ICING COATING MARKET SIZE IN CONSTRUCTION, BY REGION, 2016–2023 (USD THOUSAND)
TABLE 22 ANTI-ICING COATING MARKET SIZE IN CONSTRUCTION, BY REGION, 2016–2023 (TON)
7.6 OTHERS
7.6.1 ELECTRICAL INSULATORS
7.6.2 COLD STORAGES
TABLE 23 ANTI-ICING COATING MARKET SIZE IN OTHER END-USE INDUSTRIES, BY REGION, 2016–2023 (USD THOUSAND)
TABLE 24 ANTI-ICING COATING MARKET SIZE IN OTHER END-USE INDUSTRIES, BY REGION, 2016–2023 (TON)
8 ANTI-ICING COATING MARKET, BY REGION (Page No. - 54)
8.1 INTRODUCTION
FIGURE 18 THE US AND RUSSIA EMERGING AS STRATEGIC LOCATIONS FOR ANTI-ICING COATING MARKET
FIGURE 19 NORTH AMERICA AND EUROPE ARE THE FASTEST-GROWING ANTI-ICING COATING MARKETS IN THE KEY END-USE INDUSTRIES
TABLE 25 ANTI-ICING COATING MARKET SIZE, BY REGION, 2016–2023 (USD THOUSAND)
TABLE 26 ANTI-ICING COATING MARKET SIZE, BY REGION, 2016–2023 (TON)
8.2 NORTH AMERICA
FIGURE 20 NORTH AMERICA: ANTI-ICING COATING MARKET SNAPSHOT
TABLE 27 NORTH AMERICA: ANTI-ICING COATING MARKET SIZE, BY COUNTRY, 2016–2023 (USD THOUSAND)
TABLE 28 NORTH AMERICA: ANTI-ICING COATING MARKET SIZE, BY COUNTRY, 2016–2023 (TON)
TABLE 29 NORTH AMERICA: ANTI-ICING COATING MARKET SIZE, BY END-USE INDUSTRY, 2016–2023 (USD THOUSAND)
TABLE 30 NORTH AMERICA: ANTI-ICING COATING MARKET SIZE, BY END-USE INDUSTRY, 2016–2023 (TON)
8.2.1 US
FIGURE 21 US: INCREASING DEMAND FROM THE AUTOMOTIVE & TRANSPORTATION INDUSTRY TO DRIVE THE ANTI-ICING COATING MARKET
TABLE 31 US: ANTI-ICING COATING MARKET SIZE, BY END-USE INDUSTRY, 2016–2023 (USD THOUSAND)
TABLE 32 US: ANTI-ICING COATING MARKET SIZE, BY END-USE INDUSTRY, 2016–2023 (TON)
8.2.2 CANADA
TABLE 33 CANADA: ANTI-ICING COATING MARKET SIZE, BY END-USE INDUSTRY, 2016–2023 (USD THOUSAND)
TABLE 34 CANADA: ANTI-ICING COATING MARKET SIZE, BY END-USE INDUSTRY, 2016–2023 (TON)
8.3 EUROPE
FIGURE 22 EUROPE: AUTOMOTIVE & TRANSPORTATION END-USE INDUSTRY TO DOMINATE THE ANTI-ICING COATING MARKET
TABLE 35 EUROPE: ANTI-ICING COATING MARKET SIZE, BY COUNTRY, 2016–2023 (USD THOUSAND)
TABLE 36 EUROPE: ANTI-ICING COATING MARKET SIZE, BY COUNTRY, 2016–2023 (TON)
FIGURE 23 RUSSIA TO DOMINATE THE ANTI-ICING COATING MARKET IN EUROPE
TABLE 37 EUROPE: ANTI-ICING COATING MARKET SIZE, BY END-USE INDUSTRY, 2016–2023 (USD THOUSAND)
TABLE 38 EUROPE: ANTI-ICING COATING MARKET SIZE, BY END-USE INDUSTRY, 2016–2023 (TON)
8.3.1 RUSSIA
TABLE 39 RUSSIA: ANTI-ICING COATING MARKET SIZE, BY END-USE INDUSTRY, 2016–2023 (USD THOUSAND)
TABLE 40 RUSSIA: ANTI-ICING COATING MARKET SIZE, BY END-USE INDUSTRY, 2016–2023 (TON)
8.3.2 SWITZERLAND
TABLE 41 SWITZERLAND: ANTI-ICING COATING MARKET SIZE, BY END-USE INDUSTRY, 2016–2023 (USD THOUSAND)
TABLE 42 SWITZERLAND: ANTI-ICING COATING MARKET SIZE, BY END-USE INDUSTRY, 2016–2023 (TON)
8.3.3 GERMANY
TABLE 43 GERMANY: ANTI-ICING COATING MARKET SIZE, BY END-USE INDUSTRY, 2016–2023 (USD THOUSAND)
TABLE 44 GERMANY: ANTI-ICING COATING MARKET SIZE, BY END-USE INDUSTRY, 2016–2023 (TON)
8.3.4 FRANCE
TABLE 45 FRANCE: ANTI-ICING COATING MARKET SIZE, BY END-USE INDUSTRY, 2016–2023 (USD THOUSAND)
TABLE 46 FRANCE: ANTI-ICING COATING MARKET SIZE, BY END-USE INDUSTRY, 2016–2023 (TON)
8.3.5 ITALY
TABLE 47 ITALY: ANTI-ICING COATING MARKET SIZE, BY END-USE INDUSTRY, 2016–2023 (USD THOUSAND)
TABLE 48 ITALY: ANTI-ICING COATING MARKET SIZE, BY END-USE INDUSTRY, 2016–2023 (TON)
8.3.6 UK
TABLE 49 UK: ANTI-ICING COATING MARKET SIZE, BY END-USE INDUSTRY, 2016–2023 (USD THOUSAND)
TABLE 50 UK: ANTI-ICING COATING MARKET SIZE, BY END-USE INDUSTRY, 2016–2023 (TON)
8.3.7 TURKEY
TABLE 51 TURKEY: ANTI-ICING COATING MARKET SIZE, BY END-USE INDUSTRY, 2016–2023 (USD THOUSAND)
TABLE 52 TURKEY: ANTI-ICING COATING MARKET SIZE, BY END-USE INDUSTRY, 2016–2023 (TON)
8.3.8 POLAND
TABLE 53 POLAND: ANTI-ICING COATING MARKET SIZE, BY END-USE INDUSTRY, 2016–2023 (USD THOUSAND)
TABLE 54 POLAND: ANTI-ICING COATING MARKET SIZE, BY END-USE INDUSTRY, 2016–2023 (TON)
8.3.9 SCANDINAVIA
TABLE 55 SCANDINAVIA: ANTI-ICING COATING MARKET SIZE, BY END-USE INDUSTRY, 2016–2023 (USD THOUSAND)
TABLE 56 SCANDINAVIA: ANTI-ICING COATING MARKET SIZE, BY END-USE INDUSTRY, 2016–2023 (TON)
8.3.10 REST OF EUROPE
TABLE 57 REST OF EUROPE: ANTI-ICING COATING MARKET SIZE, BY END-USE INDUSTRY, 2016–2023 (USD THOUSAND)
TABLE 58 REST OF EUROPE: ANTI-ICING COATING MARKET SIZE, BY END-USE INDUSTRY, 2016–2023 (TON)
8.4 APAC
FIGURE 24 APAC: ANTI-ICING COATING MARKET SNAPSHOT
TABLE 59 APAC: ANTI-ICING COATING MARKET SIZE, BY COUNTRY, 2016–2023 (USD THOUSAND)
TABLE 60 APAC: ANTI-ICING COATING MARKET SIZE, BY COUNTRY, 2016–2023 (TON)
TABLE 61 APAC: ANTI-ICING COATING MARKET SIZE, BY END-USE INDUSTRY, 2016–2023 (USD THOUSAND)
TABLE 62 APAC: ANTI-ICING COATING MARKET SIZE, BY END-USE INDUSTRY, 2016–2023 (TON)
8.4.1 CHINA
TABLE 63 CHINA: ANTI-ICING COATING MARKET SIZE, BY END-USE INDUSTRY, 2016–2023 (USD THOUSAND)
TABLE 64 CHINA: ANTI-ICING COATING MARKET SIZE, BY END-USE INDUSTRY, 2016–2023 (TON)
8.4.2 INDIA
TABLE 65 INDIA: ANTI-ICING COATING MARKET SIZE, BY END-USE INDUSTRY, 2016–2023 (USD THOUSAND)
TABLE 66 INDIA: ANTI-ICING COATING MARKET SIZE, BY END-USE INDUSTRY, 2016–2023 (TON)
8.4.3 JAPAN
TABLE 67 JAPAN: ANTI-ICING COATING MARKET SIZE, BY END-USE INDUSTRY, 2016–2023 (USD THOUSAND)
TABLE 68 JAPAN: ANTI-ICING COATING MARKET SIZE, BY END-USE INDUSTRY, 2016–2023 (TON)
8.4.4 SOUTH KOREA
TABLE 69 SOUTH KOREA: ANTI-ICING COATING MARKET SIZE, BY END-USE INDUSTRY, 2016–2023 (USD THOUSAND)
TABLE 70 SOUTH KOREA: ANTI-ICING COATING MARKET SIZE, BY END-USE INDUSTRY, 2016–2023 (TON)
8.4.5 AUSTRALIA & NEW ZEALAND
TABLE 71 AUSTRALIA & NEW ZEALAND: ANTI-ICING COATING MARKET SIZE, BY END-USE INDUSTRY, 2016–2023 (USD THOUSAND)
TABLE 72 AUSTRALIA & NEW ZEALAND: ANTI-ICING COATING MARKET SIZE, BY END-USE INDUSTRY, 2016–2023 (TON)
8.4.6 REST OF APAC
TABLE 73 REST OF APAC: ANTI-ICING COATING MARKET SIZE, BY END-USE INDUSTRY, 2016–2023 (USD THOUSAND)
TABLE 74 REST OF APAC: ANTI-ICING COATING MARKET SIZE, BY END-USE INDUSTRY, 2016–2023 (TON)
8.5 REST OF THE WORLD (ROW)
TABLE 75 ROW: ANTI-ICING COATING MARKET SIZE, BY COUNTRY, 2016–2023 (USD THOUSAND)
TABLE 76 ROW: ANTI-ICING COATING MARKET SIZE, BY COUNTRY, 2016–2023 (TON)
TABLE 77 ROW: ANTI-ICING COATING MARKET SIZE, BY END-USE INDUSTRY, 2016–2023 (USD THOUSAND)
TABLE 78 ROW: ANTI-ICING COATING MARKET SIZE, BY END-USE INDUSTRY, 2016–2023 (TON)
8.5.1 BRAZIL
TABLE 79 BRAZIL: ANTI-ICING COATING MARKET SIZE, BY END-USE INDUSTRY, 2016–2023 (USD THOUSAND)
TABLE 80 BRAZIL: ANTI-ICING COATING MARKET SIZE, BY END-USE INDUSTRY, 2016–2023 (TON)
8.5.2 MIDDLE EAST
TABLE 81 MIDDLE EAST: ANTI-ICING COATING MARKET SIZE, BY END-USE INDUSTRY, 2016–2023 (USD THOUSAND)
TABLE 82 MIDDLE EAST: ANTI-ICING COATING MARKET SIZE, BY END-USE INDUSTRY, 2016–2023 (TON)
8.5.3 AFRICAN AND SOUTH AMERICAN COUNTRIES
TABLE 83 AFRICAN AND SOUTH AMERICAN COUNTRIES: ANTI-ICING COATING MARKET SIZE, BY END-USE INDUSTRY, 2016–2023 (USD THOUSAND)
TABLE 84 AFRICAN AND SOUTH AMERICAN COUNTRIES: ANTI-ICING COATING MARKET SIZE, BY END-USE INDUSTRY, 2016–2023 (TON)
9 COMPETITIVE LANDSCAPE (Page No. - 89)
9.1 OVERVIEW
FIGURE 25 KEY GROWTH STRATEGY OF COMPANIES BETWEEN 2015 AND 2018*
9.2 INVESTMENT & EXPANSION
TABLE 85 INVESTMENT & EXPANSION, 2015–2018
9.3 MERGER & ACQUISITION
TABLE 86 MERGER & ACQUISITION, 2015–2018
9.4 JOINT VENTURE, PARTNERSHIP, CONTRACT & AGREEMENT
TABLE 87 JOINT VENTURE, PARTNERSHIP, CONTRACT & AGREEMENT, 2015–2018
9.5 NEW PRODUCT LAUNCH
TABLE 88 NEW PRODUCT LAUNCH, 2015–2018
10 COMPANY PROFILES (Page No. - 92)
(Business Overview, Products Offered, Recent Developments, SWOT Analysis and MNM View)*
10.1 PPG INDUSTRIES
FIGURE 26 PPG INDUSTRIES: COMPANY SNAPSHOT
FIGURE 27 PPG INDUSTRIES: SWOT ANALYSIS
10.2 DOWDUPONT
FIGURE 28 DOWDUPONT: COMPANY SNAPSHOT
FIGURE 29 DOWDUPONT: SWOT ANALYSIS
10.3 FRAUNHOFER-GESELLSCHAFT
FIGURE 30 FRAUNHOFER-GESELLSCHAFT: COMPANY SNAPSHOT
10.4 NEVERWET
10.5 NEI CORPORATION
10.6 BATTELLE MEMORIAL INSTITUTE
10.7 CG2 NANOCOATINGS INC.
10.8 AEROSPACE & ADVANCED COMPOSITES GMBH
10.9 NANOSONIC INC.
10.10 CYTONIX
10.11 ADDITIONAL COMPANIES
10.11.1 ECOLOGICAL COATINGS
10.11.2 HYGRATEK
10.11.3 KISS POLYMERS
10.11.4 NBD NANOTECHNOLOGIES
10.11.5 OCEANIT
10.11.6 OPUS MATERIALS TECHNOLOGIES
10.11.7 HELICITY TECHNOLOGIES
*Details on Business Overview, Products Offered, Recent Developments, SWOT Analysis and MNM View might not be captured in case of unlisted companies.
11 APPENDIX (Page No. - 106)
11.1 KEY INSIGHTS FROM INDUSTRY EXPERTS
11.2 DISCUSSION GUIDE
11.3 KNOWLEDGE STORE: MARKETSANDMARKETS SUBSCRIPTION PORTAL
11.4 INTRODUCING RT: REAL-TIME MARKET INTELLIGENCE
11.5 AVAILABLE CUSTOMIZATIONS
11.6 RELATED REPORTS
11.7 AUTHOR DETAILS


Growth opportunities and latent adjacency in Anti-Icing Coating Market