Animal Feed Micronutrients Market by Type (Zinc, Iron, Manganese, and Copper), by Livestock (Ruminant, Poultry, Aqua, Swine, and Equine) & by Geography - Global Trends & Forecasts to 2019


The increasing middle-class population and rising per capita income, along with increasing expenditure on animal health and wellness are some of the drivers ofthe animal feed micronutrients market.
This research report provides a separate in-depth market insight into the global industry.There has been an increasing pressure on the livestock sector to meet the growing demand for high-value animal protein. In order to meet this increasing demand, animal farmers as well as animal breeders increases their production. This trend has created massive demand for these micronutrients, which plays a major role in optimizing the growth of animals as well as their production rate. This report takes into account the wide range of factors determining the size of the animal feed micronutrients market and their influence on the market dynamics. The market drivers and restraints are explained in detail in the report, along with growth opportunities in the animal feed micronutrients industry.
The animal feed micronutrients market is expected to reach a value of $1476.3 million by 2019 growing at a CAGR of 6.1% from year 2014 to 2019.The market is estimated by segmenting the market into micro-markets, based on the share of each type, livestock, and geographical region. The animal micronutrients market is segmented into zinc, iron, manganese, copper and others according to type, and ruminants, poultry, aqua, swine, equine and others, by livestock. The market data is available from 2012 to 2019 with a forecasted CAGR from 2014 to2019.
Animal Feed Micronutrients Market Share(Revenue), by Type, 2013
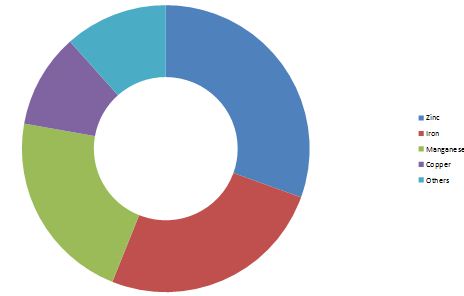
Source: MarketsandMarkets Analysis
The global animal feed micronutrients market generated revenue of $1,031.2 million in 2013 and is anticipated to grow at a CAGR of 6.1% by 2019. The market, by type, was led by the zinc segment. The highest CAGR is projected to be that of iron.
Various secondary sources such as encyclopedias, directories, and databases were used to identify and collect information useful for this extensive commercial study of the market. The primary sources�experts from related industries and suppliers�have been interviewed to obtain and verify critical information as well as to assess the future prospects of the market.
Scope of the report
This research categorizes the global animal micronutrients market based on geography, type, and livestock:
Based on geography:
- North America
- Europe
- Asia-Pacific
- ROW
Based on livestock:
- Ruminant
- Poultry
- Aqua
- Swine
- Equine
Based on type:
- Zinc
- Iron
- Manganese
- Copper
The Asia-Pacific region topped the consumption chart of the global animal feed micronutrients market, having accounted for around 32% of the total share in 2013.The global market value for these micronutrients is expected to grow at a CAGR of 6.1% by 2019, with the highest growth projected to be observed in the Asia-Pacific region, wherein China is projected to be the market leader. Here, increasing urbanization with increased domestic demand for meat and meat export opportunities are major factors motivating the growth of the animal micronutrients market.
Animal Feed Micronutrients Market Share (Revenue), by Geography, 2013
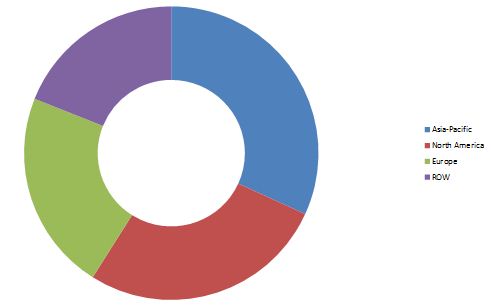
Source: MarketsandMarkets Analysis
The global market was dominated by the Asia-Pacific region in 2013. Strong economic and population growth are the key drivers that have pushed the market forward in this region, especially in India and China. North America is the second largest market for animal micronutrients. Europe ranks third, where increasing meat consumption, food safety concerns, and improving meat prices are important drivers for the growth of the animal micronutrient market. ROW (Rest of the World) occupied the least share. Here,these products are showing significant growth in Brazil and Argentina. South Africa also has a strong livestock industry, which makes it a major market. The consumption prospects of animal micronutrients are better as compared to other parts of the ROW.
Novus International Inc. (U.S), Alltech Inc. (U.S.), Cargill Inc. (U.S), Nutreco N.V. (The Netherlands), and ADM (U.S.) are some of the key players in the animal feed micronutrients market and their recent development strategies have been studied in detail in this report.
 Exclusive indicates content/data unique to MarketsandMarkets and not available with any competitors.
Table Of Contents
1 Introduction (Page No. - 16)
1.1 Objectives
1.2 Report Description
1.3 Stakeholders
1.4 Research Methdology
1.4.1 Markets Covered
1.4.2 Market Size
1.4.3 Secondary Sources
1.4.4 Assumptions Made for The Report
1.4.5 Key Data Validated From Primary & Secondary Sources
1.4.6 Key Questions Answered
2 Executive Summary (Page No. - 23)
3 Market Overview (Page No. - 25)
3.1 Introduction
3.2 Winning Imperatives
3.2.1 Investments in R&D
3.3 Burning Issue
3.3.1 Rising Cost of Raw Materials
3.4 Market Dynamics
3.4.1 Drivers
3.4.1.1 Increasing Demand of Proper Animal Nutrition
3.4.1.2 Effectiveness on Growth and Fertility
3.4.1.3 Increasing Demand for Animal Protein
3.4.2 Restraints
3.4.2.1 Critical Dosage Application
3.4.2.2 Lack of Awareness Among Farmers
3.4.3 Opportunities
3.4.3.1 Emerging Regional Markets
3.4.4 Porters Five forces Analysis
3.4.4.1 Supplier�s Power
3.4.4.2 Buyer�s Power
3.4.4.3 Threats From New Entrants
3.4.4.4 Threats From Substitutes
3.4.4.5 Degree of Competition
3.4.5 Supply Chain Analysis
3.5 Animal Micronutrients Market Share
3.6 Market Share Analysis
3.6.1 Animal Feed Micronutrients Market
4 Premium Insights (Page No. - 42)
4.1 Market Segmentation
4.2 Asia-Pacific: The Prodigious Market
4.3 Zinc: Market Leader Segment By Type
4.4 Poultry: Dominant Market By Livestock
4.5 Zinc: Market Leader in Asia-Pacific Market
4.6 Asia-Pacific: The Frontrunners for Animal Micronutrients Market
4.7 China: Market Leader in The Asia-Pacific Market
4.8 Asia-Pacific: Market Leader for Animal Micronutrients
4.9 Asia-Pacific (Zinc): Largest Market By Type
4.10 Asia-Pacific (Poultry): Market Leader By Livestock
5 Animal Feed Micronutrients Market, By Type (Page No. - 52)
5.1 Key Findings
5.2 Introduction
5.3 Zinc
5.4 Iron
5.5 Manganese
5.6 Copper
5.7 Others
6 Animal Feed Micronutrients Market, By Livestock (Page No. - 61)
6.1 Introduction
6.2 Ruminant
6.3 Poultry
6.4 Aqua
6.5 Swine
6.6 Equine
6.7 Others
7 Animal Feed Micronutrients Market, By Geography (Page No. - 75)
7.1 Introduction
7.2 North America
7.2.1 U.S.
7.2.2 Mexico
7.2.3 Canada
7.3 Europe
7.3.1 Germany
7.3.2 U.K.
7.3.3 Russia
7.3.4 Poland
7.3.5 France
7.3.6 Ukraine
7.3.7 Others
7.4 Asia-Pacific
7.4.1 China
7.4.2 Japan
7.4.3 Australia
7.4.4 India
7.4.5 Others
7.5 ROW
7.5.1 South Africa
7.5.2 Brazil
7.5.3 Argentina
7.5.4 Others
8 Competitive Landscape (Page No. - 136)
8.1 Introduction
8.2 Investments & Expansions: Most Preferred Strategic Approach
8.3 Acquistions
8.4 Investments & Expansions
8.5 New Product Launches
8.6 Partnerships
9 Company Profile (Company At A Glance, Recent Financials, Products & Services, Strategies & Insights, & Recent Developments)* (Page No. - 149)
9.1 Cargill Inc.
9.2 Nutreco N.V.
9.3 Archer Daniels Midland Company (ADM)
9.4 Kemin Industries Inc.
9.5 Lallemand Inc
9.6 Alltech Inc.
9.7 Novus International Inc.
9.8 Qualitech Inc.
9.9 Balchem Corp.
9.10 Zinpro Corporation.
*Details on Company At A Glance, Recent Financials, Products & Services, Strategies & Insights, & Recent Developments Might Not Be Captured in Case of Unlisted Companies.
List of Tables (81 Tables)
Table 1 Importance of Micronutrients
Table 2 Animal Feed Micronutrients Market Size, By Type, 2012-2019 ($Million)
Table 3 Zinc: Animal Micronutrients Market Size, By Geography, 2012-2019, ($Million)
Table 4 Iron: Animal Micronutrients Market Size, By Geography, 2012-2019, ($Million)
Table 5 Manganese: Animal Micronutrients Market Size, By Geography, 2012-2019, ($Million)
Table 6 Copper: Animal Micronutrients Market Size, By Geography, 2012-2019, ($Million)
Table 7 Others: Animal Micronutrients Market Size, By Geography, 2012-2019, ($Million)
Table 8 Main Role and Deficiency Symptoms of Micronutrients in Animals
Table 9 Animal Micronutrients Market Size, By Livestock, 2012-2019($Million)
Table 10 Animal Micronutrients:Market Size for Ruminant Feed, By Geography, 2012-2019($Million)
Table 11 Animal Micronutrients:Market Size for Poultry Feed, By Geography, 2012-2019($Million)
Table 12 Requirement of Micronutrients By Aquatic Animals
Table 13 Animal Micronutrients:Market Size for Aqua Feed, By Geography, 2012-2019($Million)
Table 14 Market Size for Swine Feed, By Geography, 2012-2019($Million)
Table 15 Animal Micronutrients:Market Size for Equine Feed, By Geography, 2012-2019($Million) Table 16 Animal Micronutrients:Market Size for Other Feed, By Geography, 2012-2019($Million)
Table 17 Market Size,By Geography 2012-2019 ($Million)
Table 18 North America: Market Size, By Country, 2012-2019 ($Million)
Table 19 North America: Market Size, By Type, 2012-2019($Million)
Table 20 North America: Market Size, By Livestock, 2012-2019 ($Million)
Table 21 U.S: Market, By Type, 2012-2019($Million)
Table 22 U.S: Market, By Livestock, 2012-2019 ($Million)
Table 23 Mexico: Market, By Type, 2012-2019($Million)
Table 24 Mexico: Market, By Livestock, 2012-2019 ($Million)
Table 25 Canada: Market, By Type, 2012-2019($Million)
Table 26 Canada: Animal Feed Micronutrients Market, By Livestock, 2012-2019 ($Million)
Table 27 Europe: Animal Micronutrients Market Size, By Geography, 2012-2019 ($Million)
Table 28 Europe: Animal Micronutrients Market Size, By Type, 2012-2019 ($Million)
Table 29 Europe: Animal Micronutrients Market Size, By Livestock, 2012-2019 ($Million)
Table 30 Germany: Animal Micronutrients Market Size, By Type, 2012-2019 ($Million)
Table 31 Germany: Animal Micronutrients Market Size, By Livestock, 2012-2019 ($Million)
Table 32 U.K.: Animal Micronutrients Market Size, By Type, 2012-2019 ($Million)
Table 33 U.K.: Animal Micronutrients Market Size, By Livestock, 2012-2019 ($Million)
Table 34 Russia: Animal Micronutrients Market Size, By Type, 2012-2019 ($Million)
Table 35 Russia: Animal Micronutrients Market Size, By Livestock, 2012-2019 ($Million)
Table 36 Poland: Animal Micronutrients Market Size, By Type, 2012-2019 ($Million)
Table 37 Poland: Animal Micronutrients Market Size, By Livestock, 2012-2019 ($Million)
Table 38 France: Animal Micronutrients Market Size, By Type, 2012-2019 ($Million)
Table 39 France: Animal Micronutrients Market Size, By Livestock, 2012-2019 ($Million)
Table 40 Ukraine: Animal Micronutrients Market Size, By Type, 2012-2019 ($Million)
Table 41 Ukraine: Animal Micronutrients Market Size, By Livestock, 2012-2019 ($Million)
Table 42 Others: Animal Micronutrients Market Size, By Type, 2012-2019 ($Million)
Table 43 Others: Animal Micronutrients Market Size, By Livestock, 2012-2019 ($Million)
Table 44 Asia-Pacific: Animal Feed Micronutrients Market Size, By Country, 2012-2019 ($Million) Table 45 Asia-Pacific: Market Size, By Type, 2012-2019($Million)
Table 46 Asia-Pacific: Market Size, By Livestock, 2012-2019 ($Million)
Table 47 China: Animal Micronutrients Market Size, By Type, 2012-2019($Million)
Table 48 China: Animal Micronutrients Market Size, By Livestock, 2012-2019 ($Million)
Table 49 Japan: Market Size, By Type, 2012-2019($Million)
Table 50 Japan: Market Size, By Livestock, 2012-2019 ($Million)
Table 51 Australia: Market Size, By Type, 2012-2019($Million)
Table 52 Australia: Market Size, By Livestock, 2012-2019 ($Million)
Table 53 India: Market Size, By Type, 2012-2019($Million)
Table 54 India: Market Size, By Livestock, 2012-2019 ($Million)
Table 55 Others : Market Size, By Type, 2012-2019($Million)
Table 56 Others : Market Size, By Livestock, 2013-2019 ($Million)
Table 57 ROW: Market Size, By Country, 2012-2019 ($Million)
Table 58 ROW: Market Size, By Type, 2012-2019 ($Million)
Table 59 ROW: Market Size, By Livestock, 2012-2019 ($Million)
Table 60 South Africa: Animal Micronutrients Market Size, By Type, 2012-2019($Million)
Table 61 South Africa: Animal Feed Micronutrients Market Size, By Livestock, 2012-2019 ($Million)
Table 62 Brazil: Market Size, By Type, 2012-2019($Million)
Table 63 Brazil: Market Size, By Livestock, 2012-2019 ($Million)
Table 64 Argentina: Market Size, By Type, 2012-2019($Million)
Table 65 Argentina: Market, By Livestock, 2012-2019 ($Million)
Table 66 Others: Market Size, By Type,2012-2019($Million)
Table 67 Others: Animal Feed Micronutrients Market Size, By Livestock, 2012-2019 ($Million)
Table 68 Acquisitions 2009�2013
Table 69 Investments and Expansions, 2009�2013
Table 70 New Product Launches, 2009�2013
Table 71 Partnerships, 2009-2013
Table 72 Cargill Inc.: Products & Their Description
Table 73 Nutreco: Products & Their Description
Table 74 ADM: Products & Their Description
Table 75 Kemin Industries Inc.: Products & Their Description
Table 76 Lallemand Inc. : Products & Their Description
Table 77 Alltech Inc.: Products & Their Description
Table 78 Novus International Inc.: Products & Their Description
Table 79 Qualitech Inc.: Products & Their Description
Table 80 Balchem Corp.: Products & Their Description
Table 81 Zinpro: Products & Their Description
List of Figures (25 Figures)
Figure 1 Animal Feed Micronutrients Market,By Geography, 2012
Figure 2 Animal Micronutrients,By Geography, 2014-2019
Figure 3 Market Segmentation
Figure 4 Market Size, By Geography, 2012-2019, ($Million)
Figure 5 Animal Micronutrients: Porters Five forces Analysis
Figure 6 Animal Feed Micronutrients Supply Chain Analysis
Figure 7 Market Share Analysis, By Company, 2012
Figure 8 Market Segmentation
Figure 9 Market Size, By Geography, (2013-2019)
Figure 10 Market Size, By Type, 2013-2019 ($Million)
Figure 11 Animal Micronutrients, By Livestock, 2013-2019 ($Million)
Figure 12 Market Size, By Type & Geography, 2013 ($Million)
Figure 13 Asia-Pacific: Animal Micronutrients Market Size, By Geography, 2013-2019 ($Million)
Figure 14 China: Market Size, By Geography, 2013-2019 ($Million)
Figure 15 Asia-Pacific: Market Size, By Geography, 2013-2019 ($Million)
Figure 16 Asia-Pacific: Market Share, By Geography, 2013-2019 ($Million)
Figure 17 Asia-Pacific: Market Size, By Livestock, 2013-2019 ($Million)
Figure 18 : Market Growth Strategies, 2009-2013
Figure 19 Animal Feed Micronutrients Market Developments, 2009-2013
Figure 20 Market Share, By Company, 2012
Figure 21 Cargill: SWOT Analysis
Figure 22 Nutreco: SWOT Analysis
Figure 23 ADM: SWOT Analysis
Figure 24 Novus: SWOT Analysis
Figure 25 Balchem Corp.:SWOT Analysis


Growth opportunities and latent adjacency in Animal Feed Micronutrients Market