Aircraft Braking System Market

Aircraft Braking System Market Size, Share & Industry Growth Analysis Report by Aircraft Type, End Use (OEM, Aftermarket), Actuation (Power Brake, Boosted Brake, Independent Brake), Component (Wheels, Brake Discs, Brake Housing, Valves, Actuators, Accumulator, Electronics), Region - Forecast to 2027

Report Code: AS 5248 Dec, 2022, by marketsandmarkets.com

Update: 10/22/2024

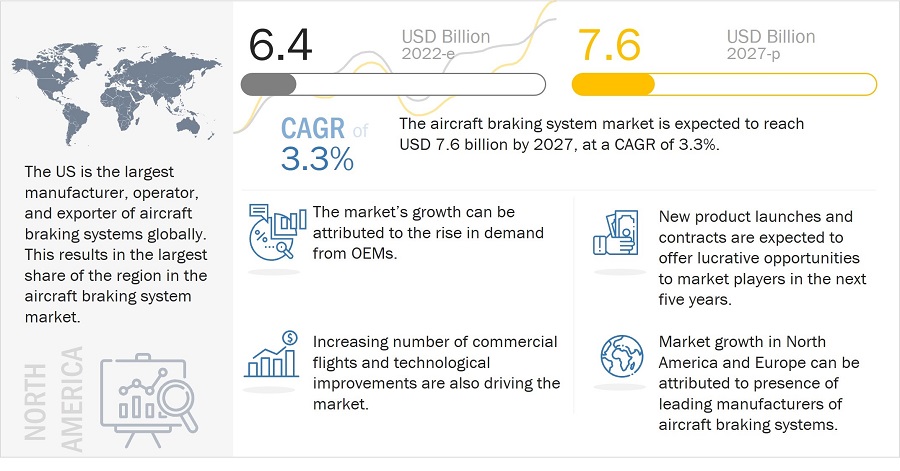
[200 Pages Report] The Aircraft Braking System Market is projected to grow from USD 6.4 Billion in 2022 to USD 7.6 Billion by 2027, at a CAGR of 3.3% during the forecast period. The growth of the Aircraft Braking System Industry can be attributed to several factors, such as the need for frequent replacement of braking units and the growing fleet size across the globe.

Different types of aircraft can use aircraft braking systems to improve their operational efficiency and be safer and more reliable. Some aircraft that use aircraft braking systems as landing gear in their operations are narrow-body aircraft, wide-body aircraft, private jets, transport aircraft, fighter aircraft, commercial and military helicopters, and unmanned aerial vehicles.

Increasing commercial aircraft operations are most likely to drive the growth in demand for aircraft braking systems. Major countries in Asia Pacific, North America, and Europe have witnessed a rise in military operations, which increases the demand for aircraft braking systems in military aircraft. Replacement services will be a factor in driving the market. These systems will also emerge useful in the unmanned aerial vehicle industry as there will be more risk of finding aircraft challenges.
Aircraft Braking system Market

Aircraft Braking system Market Forecast to 2027

To know about the assumptions considered for the study, Request for Free Sample Report

Aircraft Braking system Market Dynamics:

Driver: Technological Improvements in braking components

The technology of aircraft braking systems has evolved considerably. Earlier, only limited products accounted for safety, but now the system is an integral component in the landing gear system. Various types of brakes and components based on the aircraft application with the standards and regulations of the industry are available.

Technological improvement in the aircraft braking system will also be a significant driver as aircraft players will not be willing to compromise on the safety and efficiency of their aircraft, passengers, and employees. As a result, they will continue to subscribe to upgradation and maintenance services to have the highest order of braking systems for their aircraft. For instance, Safran Group (France) developed an efficient braking solution by introducing brake discs that combine both carbon and composite material. This resulted in longer life on brake discs and can be operated at higher braking temperatures, providing higher safety and efficiency.

Opportunity: Emerging market in growing economics

In earlier period, a limited number of players provided MRO services for braking systems to commercial and military aircraft. Brakes and wheels and along with other sub systems in the braking system have very short replacement cycles and are contributing a large revenue to the overall aircraft braking system market. Many countries including China, Japan and a few countries form the Latin American region are witnessing a increasing growth in companies providing the necessary MRO services to commercial as well as military aircraft. This is driving the growth for the aircraft braking systems in Asia Pacific, Middle Eastern and Latin American regions. Major aircraft MRO service providers like AAR Corp. (US) and Boeing (US) are also expanding to these regions due to the increasing demand for MRO services in these regions.

Challenge: Stringent Regulatory Environment

The regulatory bodies of the aerospace industry has established a strict and everchanging regulatory environment to ensure best safety standards for the safety and improvement of the aviation industry. These stringent regulations require aircraft braking system manufacturers and MRO service providers to adhere to some really complex manufacturing and quality assurance procedures.

An example of the strict regulatory standards is also associated with the replacement of steel brakes and carbon brakes in commercial aircraft. The braking system providers need to adhere to various tests and certification processes for their brakes and supporting systems to be able to fit on aircraft.

The OEM segment is estimated to lead the aircraft sensors market in 2022

Based on End Use, the OEM segment of the aircraft braking system market is accounted for the largest growth during the forecast period. Increasing demand for different aircraft across the commercial and military platforms is one of the main reasons for the drive in braking system market growth. Increasing developments in Advanced Air Mobility platforms and Unmanned Aerial Vehicle platforms to drive further growth in the aircraft braking system market.

The Actuators segment to witness largest growth in the forecast period

Based on component, actuators segment is witnessing highest growth in the forecast period. Actuators are used to press the brake discs to create friction to stop apply brakes onto the aircrafts. Traditionally actuators were hydromechanically driven. New technological advancements are making way to electromechanically driven actuators.

North American region is expected to have the highest market share during the forecast period

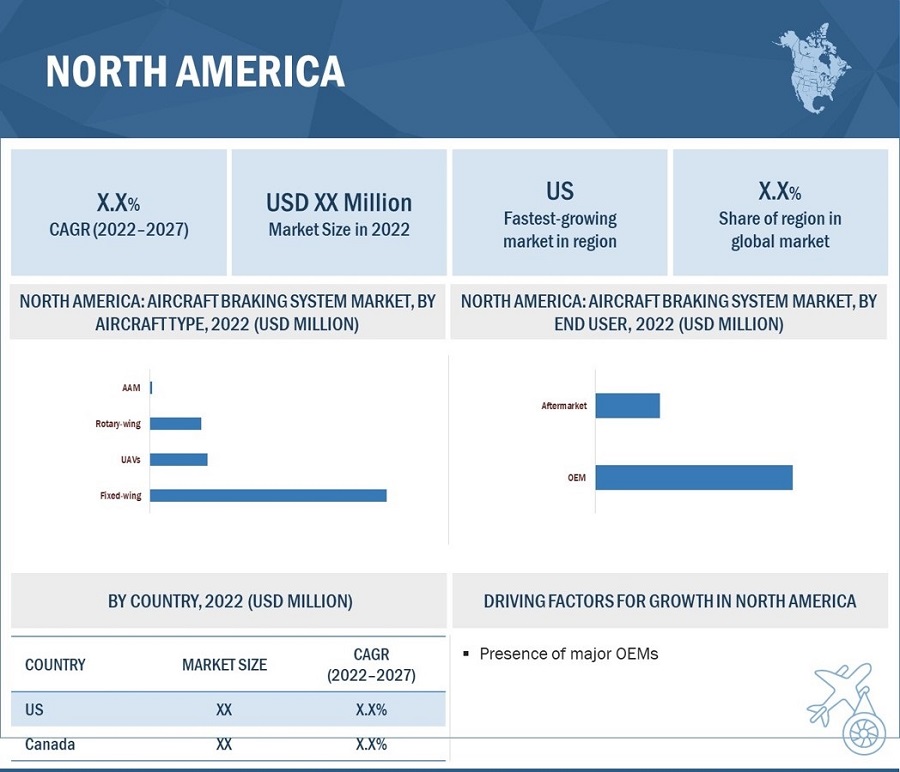
North American region constitutes the largest aircraft braking system manufacturers among all the regions. North America region also invests heavily in research and development of advanced braking system technologies required for current aircraft technologies as well as future technologies.
Aircraft Braking system Market by Region

Aircraft Braking system Market by Region

To know about the assumptions considered for the study, download the pdf brochure

Key Market Players

The Aircraft Braking System Companies are dominated by globally established players such as Safran (France), Collins Aerospace (US), Parker-Hannifin Corporation (US), Crane Co. (US), and Honeywell International Inc. (US) among others. These key players offer aircraft braking system and services to different key stakeholders.

Want to explore hidden markets that can drive new revenue in Aircraft Braking System Market?

Scope of the Report

Report Metric

Details

Estimated Market Size

USD 6.4 Billion in 2022

Projected Market Size

USD 7.6 Billion by 2027

Growth Rate

3.3%

Market Size Available for Years

2018-2027

Base Year Considered

2021

Forecast Period

2022-2027

Forecast Units

Value (USD)

Segments Covered

End User, Aircraft Type, Actuation. Component and Region

Geographies Covered

North America, Europe,  Asia Pacific, the Middle East, Latin America and Africa.

Companies Covered

Safran (France), Collins Aerospace (US), Parker-Hannifin Corporation (US), Crane Co. (US), and Honeywell International Inc. (US)

Aircraft Braking System Market Highlights

This research report categorizes the aircraft braking system market into End User, Aircraft Type, Actuation. Component and Region

Aspect

Details

By Component

  • Wheels
  • Brake Discs
  • Brake Housing
  • Valves
  • Actuators
  • Accumulator
  • Electronics

By Actuation

  • Independent Brake Systems
  • Boosted Brake Systems
  • Power Brake Systems

By Aircraft Type

  • Fixed-wing (Commercial Aviation, Business and General Aviation, Military Aviation)
  • Rotary-wing (Commercial Helicopters, Military Helicopters)
  • Unmanned Aerial Vehicles
  • Advanced Air Mobility

By End Use

  • OEM
  • Aftermarket

Regions

  • North America
  • Europe
  • Asia Pacific
  • Middle East
  • Latin America
  • Africa

Recent Developments

  • In August 2022, RUAG Australia has signed a contract with Honeywell International Inc. to become an Authorized Service Centre for the F-35 Joint Strike Fighter Wheels and Brakes program in Asia Pacific.
  • In April 2022, The largest cargo aircraft lessor globally, Air Transport Services Group (ATSG), will upgrade more than thirty Boeing 767Fs in its fleet. This will allow the corporation to use a uniform wheel and brake design across its entire fleet. Safran will supply the conversion kits and maintain the systems once they are in service. Carbon brakes have a competitive edge in weight, strength, and reliability over steel brakes. ATSG and its clients will be able to enhance operating margins, conserve fuel, and save expenses.

Frequently Asked Questions (FAQs):

To speak to our analyst for a discussion on the above findings, click Speak to Analyst

Exclusive indicates content/data unique to MarketsandMarkets and not available with any competitors.

TABLE OF CONTENTS
 
1 INTRODUCTION (Page No. - 23)
    1.1 STUDY OBJECTIVES 
    1.2 MARKET DEFINITION 
    1.3 MARKET SCOPE 
           1.3.1 MARKETS COVERED
                    FIGURE 1 AIRCRAFT BRAKING SYSTEM MARKET SEGMENTATION
           1.3.2 REGIONAL SCOPE
                    FIGURE 2 AIRCRAFT BATTERY REGIONAL SCOPE
    1.4 INCLUSIONS AND EXCLUSIONS 
           TABLE 1 INCLUSIONS AND EXCLUSIONS IN AIRCRAFT BRAKING SYSTEM MARKET
           1.4.1 YEARS CONSIDERED
    1.5 CURRENCY CONSIDERED 
    1.6 MARKET STAKEHOLDERS 
    1.7 SUMMARY OF CHANGES 
 
2 RESEARCH METHODOLOGY (Page No. - 27)
    2.1 RESEARCH DATA 
           FIGURE 3 REPORT PROCESS FLOW
           FIGURE 4 RESEARCH DESIGN
           2.1.1 SECONDARY DATA
           2.1.2 PRIMARY DATA
                    2.1.2.1 Key primary sources
    2.2 FACTOR ANALYSIS 
           2.2.1 INTRODUCTION
           2.2.2 DEMAND-SIDE INDICATORS
                    2.2.2.1 Increasing demand for aftermarket
           2.2.3 SUPPLY-SIDE ANALYSIS
                    2.2.3.1 Advancements in manufacturing technology
    2.3 MARKET SIZE ESTIMATION 
           2.3.1 MARKET DEFINITION AND SCOPE
           2.3.2 SEGMENTS AND SUBSEGMENTS
    2.4 RESEARCH APPROACH AND METHODOLOGY 
           2.4.1 BOTTOM-UP APPROACH
           2.4.2 AIRCRAFT BRAKING SYSTEM MARKET FOR OEM
                    FIGURE 5 MARKET SIZE CALCULATION FOR OEM
           2.4.3 AIRCRAFT BRAKING SYSTEM AFTERMARKET
                    FIGURE 6 MARKET SIZE CALCULATION FOR AFTERMARKET
                    FIGURE 7 MARKET SIZE ESTIMATION METHODOLOGY: BOTTOM-UP APPROACH
           2.4.4 TOP-DOWN APPROACH
                    FIGURE 8 MARKET SIZE ESTIMATION METHODOLOGY: TOP-DOWN APPROACH
    2.5 TRIANGULATION AND VALIDATION 
           FIGURE 9 DATA TRIANGULATION
           2.5.1 TRIANGULATION THROUGH PRIMARY AND SECONDARY RESEARCH
    2.6 GROWTH RATE ASSUMPTIONS 
    2.7 ASSUMPTIONS 
    2.8 RISKS 
    2.9 LIMITATIONS 
 
3 EXECUTIVE SUMMARY (Page No. - 38)
    FIGURE 10 ACTUATORS SEGMENT TO ACCOUNT FOR LARGEST SHARE OF AIRCRAFT BRAKING SYSTEM MARKET IN 2022
    FIGURE 11 AIRCRAFT BRAKING SYSTEM MARKET, BY ACTUATION, 2022
    FIGURE 12 AFTERMARKET SEGMENT TO DOMINATE MARKET IN 2022
    FIGURE 13 ASIA PACIFIC TO GROW AT HIGHEST CAGR DURING FORECAST PERIOD
 
4 PREMIUM INSIGHTS (Page No. - 41)
    4.1 ATTRACTIVE GROWTH OPPORTUNITIES IN AIRCRAFT BRAKING SYSTEM MARKET 
           FIGURE 14 RISING DEMAND FOR NEW AIRCRAFT TO DRIVE AIRCRAFT BRAKING SYSTEM MARKET FROM 2O22 TO 2027
    4.2 AIRCRAFT BRAKING SYSTEM MARKET, BY COMPONENT 
           FIGURE 15 ACTUATORS SEGMENT PROJECTED TO LEAD MARKET FROM 2022 TO 2027
    4.3 AIRCRAFT BRAKING SYSTEM MARKET, BY ACTUATION 
           FIGURE 16 POWER BRAKE SYSTEMS TO DOMINATE MARKET DURING FORECAST PERIOD
    4.4 AIRCRAFT BRAKING SYSTEM MARKET, BY COUNTRY 
           FIGURE 17 INDIA PROJECTED TO BE FASTEST-GROWING MARKET DURING 2022–2027
 
5 MARKET OVERVIEW (Page No. - 43)
    5.1 INTRODUCTION 
    5.2 MARKET DYNAMICS 
           FIGURE 18 AIRCRAFT BRAKING SYSTEM MARKET DYNAMICS
           5.2.1 DRIVERS
                    5.2.1.1 Increasing operations in commercial aircraft industry
                    5.2.1.2 Technological improvements in aircraft braking components
           5.2.2 RESTRAINTS
                    5.2.2.1 Long life of aircraft landing gears
                    5.2.2.2 Manufacturing challenges
           5.2.3 OPPORTUNITIES
                    5.2.3.1 Emerging market in growing economies
                    5.2.3.2 Growth of unmanned aerial vehicles industry
                               FIGURE 19 FIXED-WING UAV MARKET, 2019–2026 (USD MILLION)
           5.2.4 CHALLENGES
                    5.2.4.1 Stringent regulatory environment
    5.3 OPERATIONAL DATA 
           TABLE 2 NEW COMMERCIAL AIRPLANE DELIVERIES, BY REGION, 2020–2039
    5.4 TECHNOLOGY ANALYSIS 
           5.4.1 ELECTRIC BRAKES
           5.4.2 AIRCRAFT BRAKE CONTROL SYSTEMS
    5.5 TRENDS/DISRUPTIONS IMPACTING CUSTOMERS’ BUSINESSES 
           5.5.1 REVENUE SHIFT AND NEW REVENUE POCKETS FOR AIRCRAFT BRAKING SYSTEM MARKET
           FIGURE 20 REVENUE SHIFT IN AIRCRAFT BRAKING SYSTEM MARKET
    5.6 MARKET ECOSYSTEM 
           5.6.1 PROMINENT COMPANIES
           5.6.2 PRIVATE AND SMALL ENTERPRISES
           5.6.3 END USERS
                     FIGURE 21 MARKET ECOSYSTEM MAP: AIRCRAFT BRAKING SYSTEM MARKET
                     TABLE 3 AIRCRAFT BRAKING SYSTEM MARKET ECOSYSTEM
    5.7 VALUE CHAIN ANALYSIS 
           FIGURE 22 VALUE CHAIN ANALYSIS: AIRCRAFT BRAKING SYSTEM MARKET
    5.8 TRADE DATA ANALYSIS 
           TABLE 4 TRADE DATA FOR AIRCRAFT BRAKING SYSTEM MARKET
    5.9 PORTER’S FIVE FORCES MODEL 
           TABLE 5 PORTER’S FIVE FORCES ANALYSIS
    5.10 PORTER’S FIVE FORCES ANALYSIS 
           FIGURE 23 PORTER’S FIVE FORCE ANALYSIS: AIRCRAFT BRAKING SYSTEM MARKET
    5.11 KEY STAKEHOLDERS AND BUYING CRITERIA 
           5.11.1 KEY STAKEHOLDERS IN BUYING PROCESS
                     FIGURE 24 INFLUENCE OF STAKEHOLDERS IN BUYING PROCESS OF AIRCRAFT BRAKING SYSTEMS
                     TABLE 6 INFLUENCE OF STAKEHOLDERS IN BUYING PROCESS OF AIRCRAFT BRAKING SYSTEMS (%)
           5.11.2 BUYING CRITERIA
                     FIGURE 25 KEY BUYING CRITERIA FOR AIRCRAFT BRAKING SYSTEMS
                     TABLE 7 KEY BUYING CRITERIA FOR AIRCRAFT BRAKING SYSTEMS
    5.12 AVERAGE SELLING PRICE 
           TABLE 8 AVERAGE SELLING PRICE: OEM AIRCRAFT BRAKING SYSTEM, BY COMPONENT (USD)
           TABLE 9 AVERAGE SELLING PRICE: AFTERMARKET AIRCRAFT BRAKING SYSTEM, BY COMPONENT (USD)
    5.13 CASE STUDIES 
           5.13.1 LANDING GEAR NOISE REDUCTION TECHNOLOGY
           5.13.2 PREDICTING FUTURE OF AIRCRAFT THROUGH DATA
    5.14 KEY CONFERENCES AND EVENTS IN 2022–2023 
           TABLE 10 AIRCRAFT BATTERY MARKET: DETAILED LIST OF CONFERENCES AND EVENTS
    5.15 TARIFF AND REGULATORY LANDSCAPE FOR AEROSPACE INDUSTRY 
           TABLE 11 NORTH AMERICA: LIST OF REGULATORY BODIES, GOVERNMENT AGENCIES, AND OTHER ORGANIZATIONS
           5.15.1 FEDERAL AVIATION ADMINISTRATION ON BRAKING SYSTEM CERTIFICATION TEST AND ANALYSIS
                     TABLE 12 EUROPE: LIST OF REGULATORY BODIES, GOVERNMENT AGENCIES, AND OTHER ORGANIZATIONS
                     TABLE 13 ASIA PACIFIC: LIST OF REGULATORY BODIES, GOVERNMENT AGENCIES, AND OTHER ORGANIZATIONS
                     TABLE 14 REST OF THE WORLD: LIST OF REGULATORY BODIES, GOVERNMENT AGENCIES, AND OTHER ORGANIZATIONS
 
6 INDUSTRIAL TRENDS (Page No. - 61)
    6.1 INTRODUCTION 
    6.2 EMERGING TRENDS 
           6.2.1 ELECTRIC BRAKES
           6.2.2 CONNECTED SOLUTION THROUGH PREDICTIVE SOFTWARE
           6.2.3 TECHNOLOGICAL ADVANCEMENT AND CONTINUOUS IMPROVEMENT
    6.3 SUPPLY CHAIN ANALYSIS 
           FIGURE 26 SUPPLY CHAIN ANALYSIS
    6.4 IMPACT OF MEGATRENDS 
    6.5 INNOVATIONS AND PATENT REGISTRATIONS, 2014–2022 
 
7 AIRCRAFT BRAKING SYSTEM MARKET, BY END USE (Page No. - 67)
    7.1 INTRODUCTION 
           FIGURE 27 AFTERMARKET TO HAVE LARGER MARKET SIZE DURING FORECAST PERIOD
           TABLE 15 AIRCRAFT BRAKING SYSTEM MARKET, BY END USE, 2018–2021 (USD MILLION)
           TABLE 16 AIRCRAFT BRAKING SYSTEM MARKET, BY END USE, 2022–2027 (USD MILLION)
    7.2 OEM 
           7.2.1 INCREASED AIRCRAFT DELIVERIES TO DRIVE SEGMENT
    7.3 AFTERMARKET 
           7.3.1 RISING SIZE OF AIRCRAFT FLEET TO BOOST DEMAND
 
8 AIRCRAFT BRAKING SYSTEM MARKET, BY AIRCRAFT TYPE (Page No. - 70)
    8.1 INTRODUCTION 
           FIGURE 28 FIXED-WING SEGMENT EXPECTED TO LEAD MARKET DURING FORECAST PERIOD
           TABLE 17 AIRCRAFT BRAKING SYSTEM MARKET, BY AIRCRAFT TYPE, 2018–2021 (USD MILLION)
           TABLE 18 AIRCRAFT BRAKING SYSTEM MARKET, BY AIRCRAFT TYPE, 2022–2027 (USD MILLION)
    8.2 FIXED-WING 
           8.2.1 COMMERCIAL AVIATION
                    TABLE 19 COMMERCIAL AVIATION: AIRCRAFT BRAKING SYSTEM MARKET, BY AIRCRAFT TYPE, 2018–2021 (USD MILLION)
                    TABLE 20 COMMERCIAL AVIATION: AIRCRAFT BRAKING SYSTEM MARKET, BY AIRCRAFT TYPE, 2022–2027 (USD MILLION)
                    8.2.1.1 Narrow-body aircraft
                               8.2.1.1.1 Rising air traffic driving growth
                    8.2.1.2 Wide-body aircraft
                               8.2.1.2.1 Increasing international passenger air travel
                    8.2.1.3 Regional transport aircraft
                               8.2.1.3.1 Rising demand in US and Asia Pacific
           8.2.2 MILITARY AVIATION
                    TABLE 21 MILITARY AVIATION: AIRCRAFT BRAKING SYSTEM MARKET, BY AIRCRAFT TYPE, 2018–2021 (USD MILLION)
                    TABLE 22 MILITARY AVIATION: AIRCRAFT BRAKING SYSTEM MARKET, BY AIRCRAFT TYPE, 2022–2027 (USD MILLION)
                    8.2.2.1 Fighter aircraft
                               8.2.2.1.1 Growing national security to drive market
                    8.2.2.2 Transport aircraft
                               8.2.2.2.1 Increased use in military operations
                    8.2.2.3 Special mission aircraft
                               8.2.2.3.1 Growing defense spending and territorial disputes to drive demand
           8.2.3 BUSINESS AND GENERAL AVIATION
                    TABLE 23 BUSINESS AND GENERAL AVIATION: AIRCRAFT BRAKING SYSTEM MARKET, BY AIRCRAFT TYPE, 2018–2021 (USD MILLION)
                    TABLE 24 BUSINESS AND GENERAL AVIATION: AIRCRAFT BRAKING SYSTEM MARKET, BY AIRCRAFT TYPE, 2022–2027 (USD MILLION)
                    8.2.3.1 Light aircraft
                               8.2.3.1.1 Inexpensive alternative for ultra-short-haul journeys
                    8.2.3.2 Mid-sized aircraft
                               8.2.3.2.1 Intercity travel for mid-sized business jets to fuel segment
                    8.2.3.3 Large
                               8.2.3.3.1 Customization and high demand for extra range in business aviation to drive market
                    8.2.3.4 Airliner
                               8.2.3.4.1 Technological advancements to boost demand
    8.3 ROTARY-WING 
           8.3.1 MILITARY HELICOPTERS
                    8.3.1.1 Advanced models equipped with next-generation sensors
           8.3.2 UNMANNED AERIAL VEHICLES
                    8.3.2.1 Increasing use of drones in rescue and ISR operations
           8.3.3 ADVANCED AIR MOBILITY
                    8.3.3.1 Investments by developing countries
 
9 AIRCRAFT BRAKING SYSTEM MARKET, BY COMPONENT (Page No. - 78)
    9.1 INTRODUCTION 
           FIGURE 29 ACTUATORS SEGMENT TO HAVE LARGEST MARKET SHARE DURING FORECAST PERIOD
           TABLE 25 AIRCRAFT BRAKING SYSTEM MARKET, BY COMPONENT, 2018–2021 (USD MILLION)
           TABLE 26 AIRCRAFT BRAKING SYSTEM MARKET, BY COMPONENT, 2022–2027 (USD MILLION)
    9.2 WHEELS 
    9.3 BRAKE DISCS 
           TABLE 27 AIRCRAFT BRAKE DISCS MARKET, BY MATERIAL, 2018–2021 (USD MILLION)
           TABLE 28 AIRCRAFT BRAKE DISCS MARKET, BY MATERIAL, 2022–2027 (USD MILLION)
    9.4 BRAKE HOUSING 
    9.5 VALVES 
    9.6 ACTUATORS 
    9.7 ACCUMULATORS 
    9.8 ELECTRONICS 
 
10 AIRCRAFT BRAKING SYSTEM MARKET, BY ACTUATION (Page No. - 83)
     10.1 INTRODUCTION 
             FIGURE 30 POWER BRAKE SYSTEMS TO BE LARGEST MARKET DURING FORECAST PERIOD
             TABLE 29 AIRCRAFT BRAKING SYSTEM MARKET, BY ACTUATION, 2018–2021 (USD MILLION)
             TABLE 30 AIRCRAFT BRAKING SYSTEM MARKET, BY ACTUATION, 2022–2027 (USD MILLION)
     10.2 POWER BRAKE SYSTEMS 
             10.2.1 INCREASE IN WIDE-BODY COMMERCIAL AIRCRAFT TO DRIVE SEGMENT
     10.3 BOOSTED BRAKE SYSTEMS 
             10.3.1 SINGLE-AISLE AIRCRAFT SEGMENT TO BOOST SEGMENT
     10.4 INDEPENDENT BRAKE SYSTEMS 
             10.4.1 DRIVEN BY DEMAND FOR GENERAL AND REGIONAL TYPES OF AIRCRAFT
 
11 AIRCRAFT BRAKING SYSTEM MARKET, BY REGION (Page No. - 86)
     11.1 INTRODUCTION
           FIGURE 31 AIRCRAFT BRAKING SYSTEM MARKET: REGIONAL SNAPSHOT
           TABLE 31 AIRCRAFT BRAKING SYSTEM MARKET, BY REGION, 2018–2021 (USD MILLION)
           TABLE 32 AIRCRAFT BRAKING SYSTEM MARKET, BY REGION, 2022–2027 (USD MILLION)
     11.2 NORTH AMERICA 
           FIGURE 32 NORTH AMERICA: AIRCRAFT BRAKING SYSTEM MARKET
             11.2.1 PESTLE ANALYSIS
                        TABLE 33 NORTH AMERICA: AIRCRAFT BRAKING SYSTEM MARKET, BY COUNTRY, 2018–2021 (USD MILLION)
                        TABLE 34 NORTH AMERICA: AIRCRAFT BRAKING SYSTEM MARKET, BY COUNTRY, 2022–2027 (USD MILLION)
                        TABLE 35 NORTH AMERICA: AIRCRAFT BRAKING SYSTEM MARKET, BY AIRCRAFT TYPE, 2018–2021 (USD MILLION)
                        TABLE 36 NORTH AMERICA: AIRCRAFT BRAKING SYSTEM MARKET, BY AIRCRAFT TYPE, 2022–2027 (USD MILLION)
                        TABLE 37 NORTH AMERICA: AIRCRAFT BRAKING SYSTEM, BY END USE, 2018–2021 (USD MILLION)
                        TABLE 38 NORTH AMERICA: AIRCRAFT BRAKING SYSTEM, BY END USE, 2022–2027 (USD MILLION)
             11.2.2 US
                        11.2.2.1 Presence of leading OEMs
                                     TABLE 39 US: AIRCRAFT BRAKING SYSTEM MARKET, BY AIRCRAFT TYPE, 2018–2021 (USD MILLION)
                                     TABLE 40 US: AIRCRAFT BRAKING SYSTEM MARKET, BY AIRCRAFT TYPE, 2022–2027 (USD MILLION)
                                     TABLE 41 US: AIRCRAFT BRAKING SYSTEM, BY END USE, 2018–2021 (USD MILLION)
                                     TABLE 42 US: AIRCRAFT BRAKING SYSTEM, BY END USE, 2022–2027 (USD MILLION)
             11.2.3 CANADA
                        11.2.3.1 Aircraft modernization programs
                                     TABLE 43 CANADA: AIRCRAFT BRAKING SYSTEM MARKET, BY AIRCRAFT TYPE, 2018–2021 (USD MILLION)
                                     TABLE 44 CANADA: AIRCRAFT BRAKING SYSTEM MARKET, BY AIRCRAFT TYPE, 2022–2027 (USD MILLION)
                                     TABLE 45 CANADA: AIRCRAFT BRAKING SYSTEM, BY END USE, 2018–2021 (USD MILLION)
                                     TABLE 46 CANADA: AIRCRAFT BRAKING SYSTEM, BY END USE, 2022–2027 (USD MILLION)
     11.3 EUROPE 
           FIGURE 33 EUROPE: AIRCRAFT BRAKING SYSTEM MARKET
             11.3.1 PESTLE ANALYSIS: EUROPE
                        TABLE 47 EUROPE: AIRCRAFT BRAKING SYSTEM MARKET, BY COUNTRY, 2018–2021 (USD MILLION)
                        TABLE 48 EUROPE: AIRCRAFT BRAKING SYSTEM MARKET, BY COUNTRY, 2022–2027 (USD MILLION)
                        TABLE 49 EUROPE: AIRCRAFT BRAKING SYSTEM MARKET, BY AIRCRAFT TYPE, 2018–2021 (USD MILLION)
                        TABLE 50 EUROPE: AIRCRAFT BRAKING SYSTEM MARKET, BY AIRCRAFT TYPE, 2022–2027 (USD MILLION)
                        TABLE 51 EUROPE: AIRCRAFT BRAKING SYSTEM, BY END USE, 2018–2021 (USD MILLION)
                        TABLE 52 EUROPE: AIRCRAFT BRAKING SYSTEM, BY END USE, 2022–2027 (USD MILLION)
             11.3.2 UNITED KINGDOM
                        11.3.2.1 Advancing technologies in air travel to drive market
                                     TABLE 53 UK: AIRCRAFT BRAKING SYSTEM MARKET, BY AIRCRAFT TYPE, 2018–2021 (USD MILLION)
                                     TABLE 54 UK: AIRCRAFT BRAKING SYSTEM MARKET, BY AIRCRAFT TYPE, 2022–2027 (USD MILLION)
                                     TABLE 55 UK: AIRCRAFT BRAKING SYSTEM, BY END USE, 2018–2021 (USD MILLION)
                                     TABLE 56 UK: AIRCRAFT BRAKING SYSTEM, BY END USE, 2022–2027 (USD MILLION)
             11.3.3 FRANCE
                        11.3.3.1 Heavy investments in aviation industry
                                     TABLE 57 FRANCE: AIRCRAFT BRAKING SYSTEM MARKET, BY AIRCRAFT TYPE, 2018–2021 (USD MILLION)
                                     TABLE 58 FRANCE: AIRCRAFT BRAKING SYSTEM MARKET, BY AIRCRAFT TYPE, 2022–2027 (USD MILLION)
                                     TABLE 59 FRANCE: AIRCRAFT BRAKING SYSTEM, BY END USE, 2018–2021 (USD MILLION)
                                     TABLE 60 FRANCE: AIRCRAFT BRAKING SYSTEM, BY END USE, 2022–2027 (USD MILLION)
             11.3.4 GERMANY
                        11.3.4.1 Rising expenditure on air travel and connectivity
                                     TABLE 61 GERMANY: AIRCRAFT BRAKING SYSTEM MARKET, BY AIRCRAFT TYPE, 2018–2021 (USD MILLION)
                                     TABLE 62 GERMANY: AIRCRAFT BRAKING SYSTEM MARKET, BY AIRCRAFT TYPE, 2022–2027 (USD MILLION)
                                     TABLE 63 GERMANY: AIRCRAFT BRAKING SYSTEM, BY END USE, 2018–2021 (USD MILLION)
                                     TABLE 64 GERMANY: AIRCRAFT BRAKING SYSTEM, BY END USE, 2022–2027 (USD MILLION)
             11.3.5 REST OF EUROPE
                        TABLE 65 REST OF EUROPE: AIRCRAFT BRAKING SYSTEM MARKET, BY AIRCRAFT TYPE, 2018–2021 (USD MILLION)
                        TABLE 66 REST OF EUROPE: AIRCRAFT BRAKING SYSTEM MARKET, BY AIRCRAFT TYPE, 2022–2027 (USD MILLION)
                        TABLE 67 REST OF EUROPE: AIRCRAFT BRAKING SYSTEM, BY END USE, 2018–2021 (USD MILLION)
                        TABLE 68 REST OF EUROPE: AIRCRAFT BRAKING SYSTEM, BY END USE, 2022–2027 (USD MILLION)
     11.4 ASIA PACIFIC 
           FIGURE 34 ASIA PACIFIC: AIRCRAFT BRAKING SYSTEM MARKET
             11.4.1 PESTLE ANALYSIS: ASIA PACIFIC
                        TABLE 69 ASIA PACIFIC: AIRCRAFT BRAKING SYSTEM MARKET, BY COUNTRY, 2018–2021 (USD MILLION)
                        TABLE 70 ASIA PACIFIC: AIRCRAFT BRAKING SYSTEM MARKET, BY COUNTRY, 2022–2027 (USD MILLION)
                        TABLE 71 ASIA PACIFIC: AIRCRAFT BRAKING SYSTEM MARKET, BY AIRCRAFT TYPE, 2018–2021 (USD MILLION)
                        TABLE 72 ASIA PACIFIC: AIRCRAFT BRAKING SYSTEM MARKET, BY AIRCRAFT TYPE, 2022–2027 (USD MILLION)
                        TABLE 73 ASIA PACIFIC: AIRCRAFT BRAKING SYSTEM, BY END USE, 2018–2021 (USD MILLION)
                        TABLE 74 ASIA PACIFIC: AIRCRAFT BRAKING SYSTEM, BY END USE, 2022–2027 (USD MILLION)
             11.4.2 CHINA
                        11.4.2.1 Growing demand for aerospace products
                                     TABLE 75 CHINA: AIRCRAFT BRAKING SYSTEM MARKET, BY AIRCRAFT TYPE, 2018–2021 (USD MILLION)
                                     TABLE 76 CHINA: AIRCRAFT BRAKING SYSTEM MARKET, BY AIRCRAFT TYPE, 2022–2027 (USD MILLION)
                                     TABLE 77 CHINA: AIRCRAFT BRAKING SYSTEM, BY END USE, 2018–2021 (USD MILLION)
                                     TABLE 78 CHINA: AIRCRAFT BRAKING SYSTEM, BY END USE, 2022–2027 (USD MILLION)
             11.4.3 INDIA
                        11.4.3.1 Modernization plan for armed forces
                                     TABLE 79 INDIA: AIRCRAFT BRAKING SYSTEM MARKET, BY AIRCRAFT TYPE, 2018–2021 (USD MILLION)
                                     TABLE 80 INDIA: AIRCRAFT BRAKING SYSTEM MARKET, BY AIRCRAFT TYPE, 2022–2027 (USD MILLION)
                                     TABLE 81 INDIA: AIRCRAFT BRAKING SYSTEM, BY END USE, 2018–2021 (USD MILLION)
                                     TABLE 82 INDIA: AIRCRAFT BRAKING SYSTEM, BY END USE, 2022–2027 (USD MILLION)
             11.4.4 JAPAN
                        11.4.4.1 Growing in-house development of aircraft
                                     TABLE 83 JAPAN: AIRCRAFT BRAKING SYSTEM MARKET, BY AIRCRAFT TYPE, 2018–2021 (USD MILLION)
                                     TABLE 84 JAPAN: AIRCRAFT BRAKING SYSTEM MARKET, BY AIRCRAFT TYPE, 2022–2027 (USD MILLION)
                                     TABLE 85 JAPAN: AIRCRAFT BRAKING SYSTEM, BY END USE, 2018–2021 (USD MILLION)
                                     TABLE 86 JAPAN: AIRCRAFT BRAKING SYSTEM, BY END USE, 2022–2027 (USD MILLION)
             11.4.5 AUSTRALIA
                        11.4.5.1 Increased air traffic and new aircraft deliveries
                                     TABLE 87 AUSTRALIA: AIRCRAFT BRAKING SYSTEM MARKET, BY AIRCRAFT TYPE, 2018–2021 (USD MILLION)
                                     TABLE 88 AUSTRALIA: AIRCRAFT BRAKING SYSTEM MARKET, BY AIRCRAFT TYPE, 2022–2027 (USD MILLION)
                                     TABLE 89 AUSTRALIA: AIRCRAFT BRAKING SYSTEM, BY END USE, 2018–2021 (USD MILLION)
                                     TABLE 90 AUSTRALIA: AIRCRAFT BRAKING SYSTEM, BY END USE, 2022–2027 (USD MILLION)
             11.4.6 SOUTH KOREA
                        11.4.6.1 Growing passenger traffic
                                     TABLE 91 SOUTH KOREA: AIRCRAFT BRAKING SYSTEM MARKET, BY AIRCRAFT TYPE, 2018–2021 (USD MILLION)
                                     TABLE 92 SOUTH KOREA: AIRCRAFT BRAKING SYSTEM MARKET, BY AIRCRAFT TYPE, 2022–2027 (USD MILLION)
                                     TABLE 93 SOUTH KOREA: AIRCRAFT BRAKING SYSTEM, BY END USE, 2018–2021 (USD MILLION)
                                     TABLE 94 SOUTH KOREA: AIRCRAFT BRAKING SYSTEM, BY END USE, 2022–2027 (USD MILLION)
             11.4.7 REST OF ASIA PACIFIC
                        11.4.7.1 Replacement of aging aircraft
                                     TABLE 95 REST OF ASIA PACIFIC: AIRCRAFT BRAKING SYSTEM MARKET, BY AIRCRAFT TYPE, 2018–2021 (USD MILLION)
                                     TABLE 96 REST OF ASIA PACIFIC: AIRCRAFT BRAKING SYSTEM MARKET, BY AIRCRAFT TYPE, 2022–2027 (USD MILLION)
                                     TABLE 97 REST OF ASIA PACIFIC: AIRCRAFT BRAKING SYSTEM, BY END USE, 2018–2021 (USD MILLION)
                                     TABLE 98 REST OF ASIA PACIFIC: AIRCRAFT BRAKING SYSTEM, BY END USE, 2022–2027 (USD MILLION)
     11.5 MIDDLE EAST 
           FIGURE 35 MIDDLE EAST: AIRCRAFT BRAKING SYSTEM MARKET
             11.5.1 PESTLE ANALYSIS: MIDDLE EAST
                        TABLE 99 MIDDLE EAST: AIRCRAFT BRAKING SYSTEM MARKET, BY COUNTRY, 2018–2021 (USD MILLION)
                        TABLE 100 MIDDLE EAST: AIRCRAFT BRAKING SYSTEM MARKET, BY COUNTRY, 2022–2027 (USD MILLION)
                        TABLE 101 MIDDLE EAST: AIRCRAFT BRAKING SYSTEM MARKET, BY AIRCRAFT TYPE, 2018–2021 (USD MILLION)
                        TABLE 102 MIDDLE EAST: AIRCRAFT BRAKING SYSTEM MARKET, BY AIRCRAFT TYPE, 2022–2027 (USD MILLION)
                        TABLE 103 MIDDLE EAST: AIRCRAFT BRAKING SYSTEM, BY END USE, 2018–2021 (USD MILLION)
                        TABLE 104 MIDDLE EAST: AIRCRAFT BRAKING SYSTEM, BY END USE, 2022–2027 (USD MILLION)
             11.5.2 UAE
                        11.5.2.1 Upgrade projects for commercial aircraft
                                     TABLE 105 UAE: AIRCRAFT BRAKING SYSTEM MARKET, BY AIRCRAFT TYPE, 2018–2021 (USD MILLION)
                                     TABLE 106 UAE: AIRCRAFT BRAKING SYSTEM MARKET, BY AIRCRAFT TYPE, 2022–2027 (USD MILLION)
                                     TABLE 107 UAE: AIRCRAFT BRAKING SYSTEM, BY END USE, 2018–2021 (USD MILLION)
                                     TABLE 108 UAE: AIRCRAFT BRAKING SYSTEM, BY END USE, 2022–2027 (USD MILLION)
             11.5.3 SAUDI ARABIA
                        11.5.3.1 Increased military expenditure
                                     TABLE 109 SAUDI ARABIA: AIRCRAFT BRAKING SYSTEM MARKET, BY AIRCRAFT TYPE, 2018–2021 (USD MILLION)
                                     TABLE 110 SAUDI ARABIA: AIRCRAFT BRAKING SYSTEM MARKET, BY AIRCRAFT TYPE, 2022–2027 (USD MILLION)
                                     TABLE 111 SAUDI ARABIA: AIRCRAFT BRAKING SYSTEM, BY END USE, 2018–2021 (USD MILLION)
                                     TABLE 112 SAUDI ARABIA: AIRCRAFT BRAKING SYSTEM, BY END USE, 2022–2027 (USD MILLION)
             11.5.4 TURKEY
                        11.5.4.1 Growing commercial aviation market
                                     TABLE 113 TURKEY: AIRCRAFT BRAKING SYSTEM MARKET, BY AIRCRAFT TYPE, 2018–2021 (USD MILLION)
                                     TABLE 114 TURKEY: AIRCRAFT BRAKING SYSTEM MARKET, BY AIRCRAFT TYPE, 2022–2027 (USD MILLION)
                                     TABLE 115 TURKEY: AIRCRAFT BRAKING SYSTEM, BY END USE, 2018–2021 (USD MILLION)
                                     TABLE 116 TURKEY: AIRCRAFT BRAKING SYSTEM, BY END USE, 2022–2027 (USD MILLION)
             11.5.5 REST OF MIDDLE EAST
                        TABLE 117 REST OF MIDDLE EAST: AIRCRAFT BRAKING SYSTEM MARKET, BY AIRCRAFT TYPE, 2018–2021 (USD MILLION)
                        TABLE 118 REST OF MIDDLE EAST: AIRCRAFT BRAKING SYSTEM MARKET, BY AIRCRAFT TYPE, 2022–2027 (USD MILLION)
                        TABLE 119 REST OF MIDDLE EAST: AIRCRAFT BRAKING SYSTEM, BY END USE, 2018–2021 (USD MILLION)
                        TABLE 120 REST OF MIDDLE EAST: AIRCRAFT BRAKING SYSTEM, BY END USE, 2022–2027 (USD MILLION)
     11.6 LATIN AMERICA 
           FIGURE 36 LATIN AMERICA: AIRCRAFT BRAKING SYSTEM MARKET
             11.6.1 PESTLE ANALYSIS
                        TABLE 121 LATIN AMERICA: AIRCRAFT BRAKING SYSTEM MARKET, BY COUNTRY, 2018–2021 (USD MILLION)
                        TABLE 122 LATIN AMERICA: AIRCRAFT BRAKING SYSTEM MARKET, BY COUNTRY, 2022–2027 (USD MILLION)
                        TABLE 123 LATIN AMERICA: AIRCRAFT BRAKING SYSTEM MARKET, BY AIRCRAFT TYPE, 2018–2021 (USD MILLION)
                        TABLE 124 LATIN AMERICA: AIRCRAFT BRAKING SYSTEM MARKET, BY AIRCRAFT TYPE, 2022–2027 (USD MILLION)
                        TABLE 125 LATIN AMERICA: AIRCRAFT BRAKING SYSTEM, BY END USE, 2018–2021 (USD MILLION)
                        TABLE 126 LATIN AMERICA: AIRCRAFT BRAKING SYSTEM, BY END USE, 2022–2027 (USD MILLION)
             11.6.2 BRAZIL
                        11.6.2.1 Increase in air passenger traffic
                                     TABLE 127 BRAZIL: AIRCRAFT BRAKING SYSTEM MARKET, BY AIRCRAFT TYPE, 2018–2021 (USD MILLION)
                                     TABLE 128 BRAZIL: AIRCRAFT BRAKING SYSTEM MARKET, BY AIRCRAFT TYPE, 2022–2027 (USD MILLION)
                                     TABLE 129 BRAZIL: AIRCRAFT BRAKING SYSTEM, BY END USE, 2018–2021 (USD MILLION)
                                     TABLE 130 BRAZIL: AIRCRAFT BRAKING SYSTEM, BY END USE, 2022–2027 (USD MILLION)
             11.6.3 MEXICO
                        11.6.3.1 UAVs used to fight organized crimes and conduct surveillance
                                     TABLE 131 MEXICO: AIRCRAFT BRAKING SYSTEM MARKET, BY AIRCRAFT TYPE, 2018–2021 (USD MILLION)
                                     TABLE 132 MEXICO: AIRCRAFT BRAKING SYSTEM MARKET, BY AIRCRAFT TYPE, 2022–2027 (USD MILLION)
                                     TABLE 133 MEXICO: AIRCRAFT BRAKING SYSTEM, BY END USE, 2018–2021 (USD MILLION)
                                     TABLE 134 MEXICO: AIRCRAFT BRAKING SYSTEM, BY END USE, 2022–2027 (USD MILLION)
     11.7 AFRICA 
           FIGURE 37 AFRICA: AIRCRAFT BRAKING SYSTEM MARKET
             11.7.1 PESTLE ANALYSIS: AFRICA
                        TABLE 135 AFRICA: AIRCRAFT BRAKING SYSTEM MARKET, BY AIRCRAFT TYPE, 2018–2021 (USD MILLION)
                        TABLE 136 AFRICA: AIRCRAFT BRAKING SYSTEM MARKET, BY AIRCRAFT TYPE, 2022–2027 (USD MILLION)
                        TABLE 137 AFRICA: AIRCRAFT BRAKING SYSTEM, BY END USE, 2018–2021 (USD MILLION)
                        TABLE 138 AFRICA: AIRCRAFT BRAKING SYSTEM, BY END USE, 2022–2027 (USD MILLION)
 
12 COMPETITIVE LANDSCAPE (Page No. - 134)
     12.1 INTRODUCTION 
     12.2 RANKING OF LEADING PLAYERS, 2021 
             FIGURE 38 RANKING OF LEADING PLAYERS IN AIRCRAFT BRAKING SYSTEM MARKET, 2021
     12.3 MARKET SHARE ANALYSIS OF LEADING PLAYERS, 2021 
             TABLE 139 DEGREE OF COMPETITION
             FIGURE 39 SHARE OF TOP PLAYERS IN AIRCRAFT BRAKING SYSTEM MARKET, 2021
             FIGURE 40 REVENUE ANALYSIS OF TOP FIVE MARKET PLAYERS, 2021
     12.4 COMPANY EVALUATION QUADRANT 
             12.4.1 STARS
             12.4.2 EMERGING LEADERS
             12.4.3 PERVASIVE PLAYERS
             12.4.4 PARTICIPANTS
                        FIGURE 41 AIRCRAFT BRAKING SYSTEM MARKET: COMPANY EVALUATION  QUADRANT, 2021
                        TABLE 140 COMPANY PRODUCT FOOTPRINT
                        TABLE 141 COMPANY COMPONENT FOOTPRINT
                        TABLE 142 COMPANY AIRCRAFT TYPE FOOTPRINT
                        TABLE 143 COMPANY REGION FOOTPRINT
     12.5 MRO COMPANY EVALUATION QUADRANT 
             12.5.1 PROGRESSIVE COMPANIES
             12.5.2 RESPONSIVE COMPANIES
             12.5.3 DYNAMIC COMPANIES
             12.5.4 STARTING BLOCKS
                        FIGURE 42 AIRCRAFT BRAKING SYSTEM MARKET: MRO COMPANY EVALUATION  QUADRANT, 2021
     12.6 COMPETITIVE SCENARIO 
             12.6.1 DEALS
                        TABLE 145 AIRCRAFT BRAKING SYSTEM MARKET: DEALS, MARCH 2017–SEPTEMBER 2022
             12.6.2 PRODUCT LAUNCHES
                        TABLE 146 AIRCRAFT BRAKING SYSTEM MARKET, PRODUCT LAUNCHES, NOVEMBER 2019
 
13 COMPANY PROFILES (Page No. - 151)
     13.1 INTRODUCTION 
(Business overview, Products/Solutions/Services offered, Recent developments & MnM View)*  
     13.2 KEY PLAYERS 
             13.2.1 HONEYWELL INTERNATIONAL INC.
                        TABLE 147 HONEYWELL INTERNATIONAL INC.: BUSINESS OVERVIEW
                        FIGURE 43 HONEYWELL INTERNATIONAL INC.: COMPANY SNAPSHOT
                        TABLE 148 HONEYWELL INTERNATIONAL INC.: DEALS
                        TABLE 149 HONEYWELL INTERNATIONAL INC.: PRODUCT DEVELOPMENT
             13.2.2 SAFRAN
                        TABLE 150 SAFRAN: BUSINESS OVERVIEW
                        FIGURE 44 SAFRAN: COMPANY SNAPSHOT
                        TABLE 151 SAFRAN: DEALS
             13.2.3 PARKER-HANNIFIN CORPORATION
                        TABLE 152 PARKER-HANNIFIN CORPORATION: BUSINESS OVERVIEW
                        FIGURE 45 PARKER-HANNIFIN CORPORATION: COMPANY SNAPSHOT
             13.2.4 MEGGITT PLC
                        TABLE 153 MEGGITT PLC: BUSINESS OVERVIEW
                        FIGURE 46 MEGGITT PLC: COMPANY SNAPSHOT
                        TABLE 154 MEGGITT PLC: DEALS
             13.2.5 CRANE CO.
                        TABLE 155 CRANE CO.: BUSINESS OVERVIEW
                        FIGURE 47 CRANE CO.: COMPANY SNAPSHOT
                        TABLE 156 CRANE CO.: DEALS
             13.2.6 COLLINS AEROSPACE
                        TABLE 157 COLLINS AEROSPACE: BUSINESS OVERVIEW
                        FIGURE 48 COLLINS AEROSPACE: COMPANY SNAPSHOT
                        TABLE 158 COLLINS AEROSPACE: DEALS
             13.2.7 BERINGER AERO
                        TABLE 159 BERINGER AERO: BUSINESS OVERVIEW
             13.2.8 JAY-EM AEROSPACE
                        TABLE 160 JAY-EM AEROSPACE: BUSINESS OVERVIEW
             13.2.9 GROVE AIRCRAFT LANDING GEAR SYSTEMS INC.
                        TABLE 161 GROVE AIRCRAFT LANDING GEAR SYSTEMS INC.: BUSINESS OVERVIEW
             13.2.10 MATCO MFG.
                        TABLE 162 MATCO MFG.: BUSINESS OVERVIEW
                        TABLE 163 MATCO MFG.: DEALS
             13.2.11 TACTAIR
                        TABLE 164 TACTAIR: BUSINESS OVERVIEW
             13.2.12 CARLYLE JOHNSON
                        TABLE 165 CARLYLE JOHNSON: BUSINESS OVERVIEW
             13.2.13 AIRFRAMES ALASKA
                        TABLE 166 AIRFRAMES ALASKA: BUSINESS OVERVIEW
             13.2.14 ELECTROID
                        TABLE 167 ELECTROID: BUSINESS OVERVIEW
             13.2.15 RAPCO INC.
                        TABLE 168 RAPCO INC.: BUSINESS OVERVIEW
             13.2.16 GOLDFREN
                        TABLE 169 GOLDFREN: BUSINESS OVERVIEW
             13.2.17 SONEX AIRCRAFT LLC
                        TABLE 170 SONEX AIRCRAFT LLC: BUSINESS OVERVIEW
             13.2.18 MCFARLANE AVIATION
                        TABLE 171 MCFARLANE AVIATION: BUSINESS OVERVIEW
             13.2.19 AVIATION PRODUCTS SYSTEMS, INC.
                        TABLE 172 AVIATION PRODUCTS SYSTEMS, INC.: BUSINESS OVERVIEW
             13.2.20 NMG AEROSPACE
                        TABLE 173 NMG AEROSPACE: BUSINESS OVERVIEW
     13.3 MROS 
             13.3.1 LUFTHANSA TECHNIK AG
                        TABLE 174 LUFTHANSA TECHNIK AG: BUSINESS OVERVIEW
                        FIGURE 49 LUFTHANSA TECHNIK AG: COMPANY SNAPSHOT
                        TABLE 175 LUFTHANSA TECHNIK AG: DEALS
             13.3.2 JAMCO
                        TABLE 176 JAMCO: BUSINESS OVERVIEW
             13.3.3 SUMITOMO PRECISION PRODUCTS CO. LTD.
                        TABLE 177 SUMITOMO PRECISION PRODUCTS CO. LTD.: BUSINESS OVERVIEW
             13.3.4 HONG KONG AIRCRAFT ENGINEERING COMPANY
                        TABLE 178 HONG KONG AIRCRAFT ENGINEERING COMPANY: BUSINESS OVERVIEW
                        TABLE 179 HONG KONG AIRCRAFT ENGINEERING COMPANY: DEALS
             13.3.5 AAR CORP.
                        TABLE 180 AAR CORP.: BUSINESS OVERVIEW
                        TABLE 181 AAR CORP.: DEALS
*Details on Business overview, Products/Solutions/Services offered, Recent developments & MnM View might not be captured in case of unlisted companies.  
 
14 APPENDIX (Page No. - 194)
     14.1 DISCUSSION GUIDE 
     14.2 KNOWLEDGESTORE: MARKETSANDMARKETS’ SUBSCRIPTION PORTAL 
     14.3 CUSTOMIZATION OPTIONS 
     14.4 RELATED REPORTS 
     14.5 AUTHOR DETAILS 


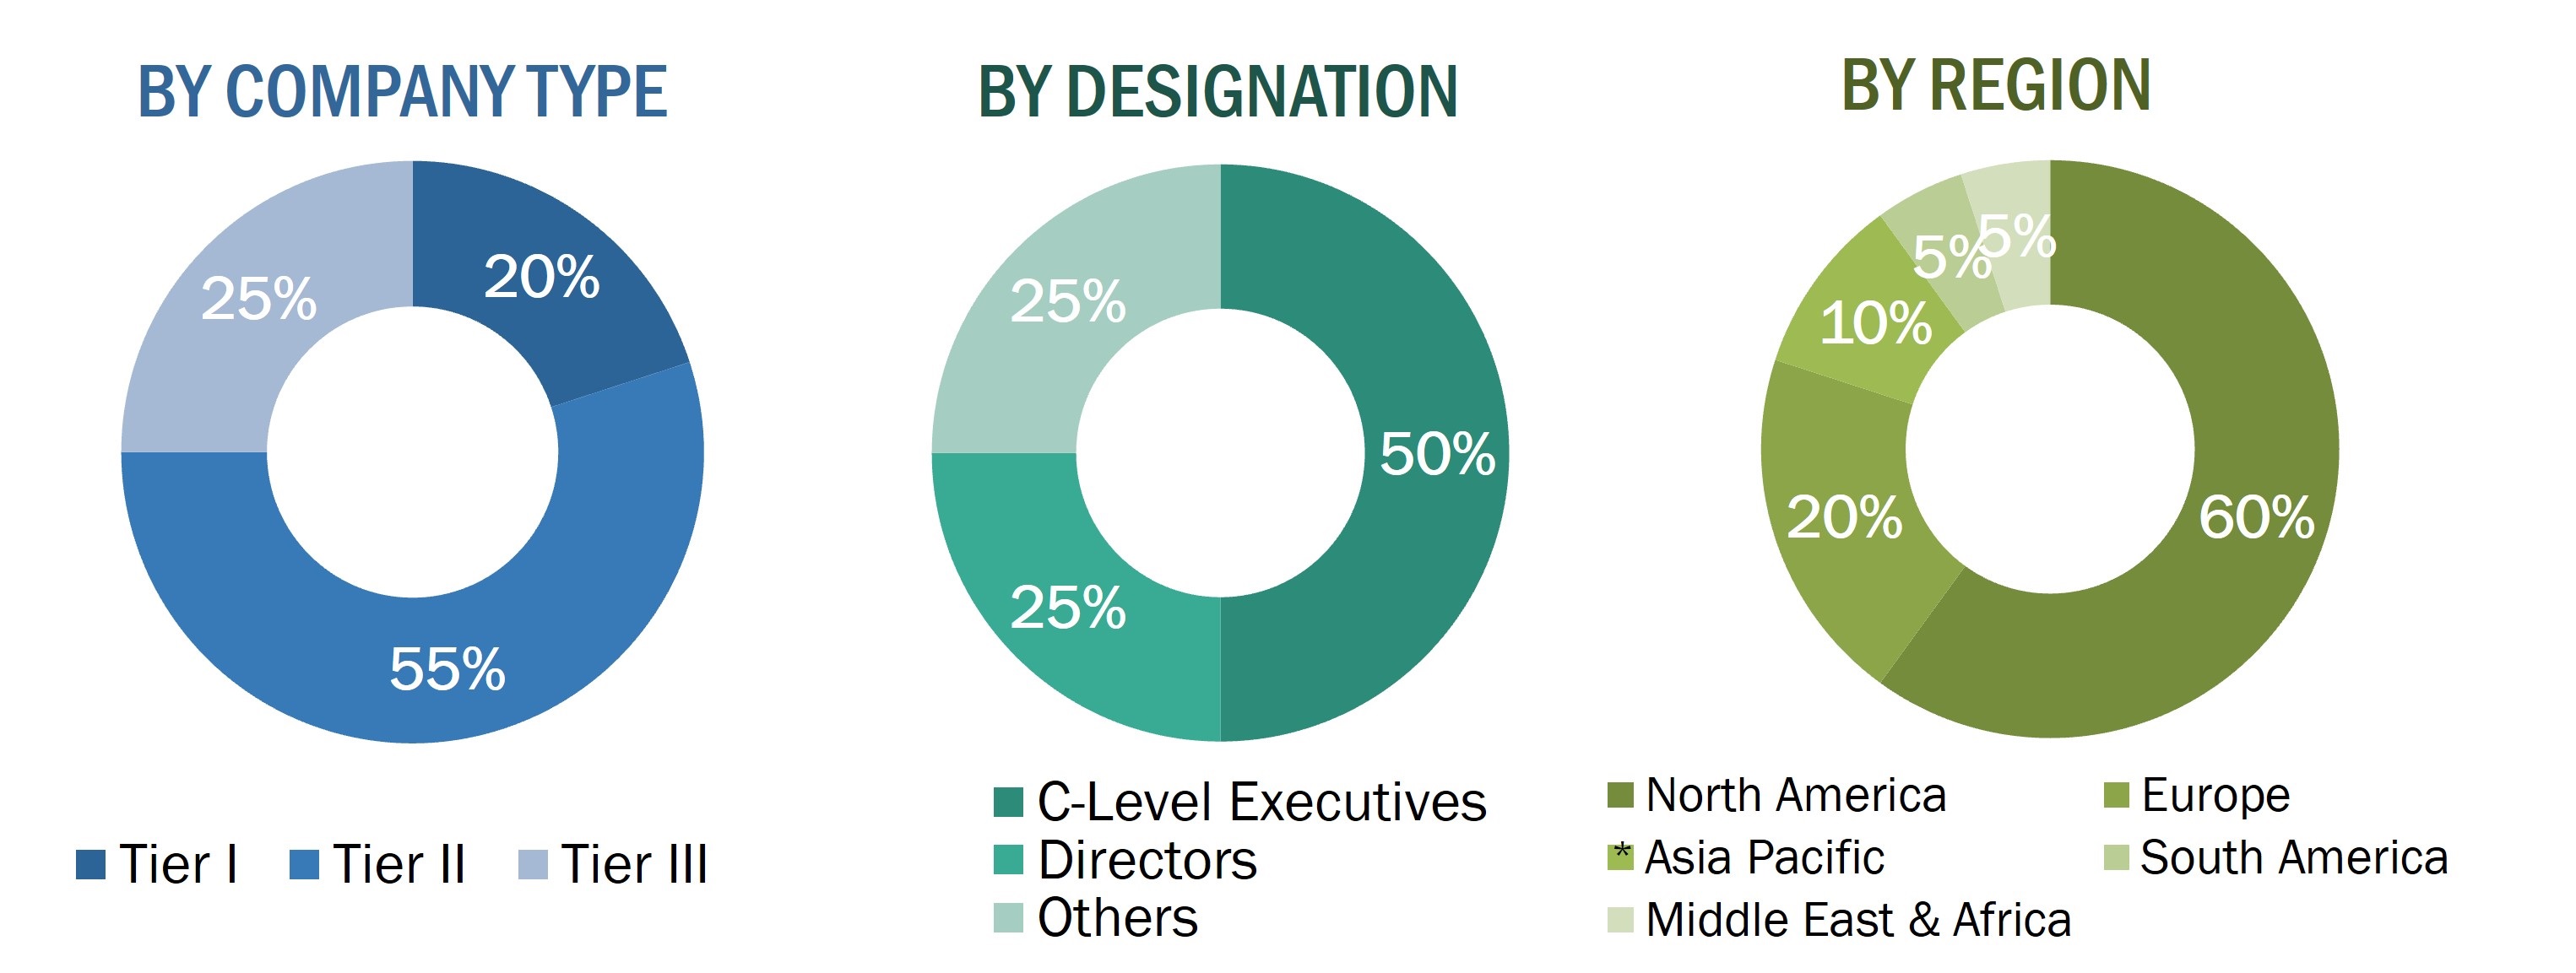
The research study conducted on the aircraft braking system market involved extensive use of secondary sources, directories, and databases such as Hoovers, Bloomberg Businessweek, and Factiva to identify and collect information relevant to the aircraft braking system market. The primary sources considered included industry experts from the aircraft braking system market as well as raw material providers, aircraft braking system manufacturers, solution providers, technology developers, alliances, government agencies, and aftermarket service providers related to all segments of the value chain of this industry. In-depth interviews with various primary respondents, including key industry participants, Subject Matter Experts (SMEs), industry consultants, and C-level executives have been conducted to obtain and verify critical qualitative and quantitative information pertaining to the aircraft braking system market as well as to assess the growth prospects of the market.

Secondary Research

The ranking of companies operating in the aircraft braking system market was arrived at based on secondary data made available through paid and unpaid sources, the analysis of product portfolios of the major companies in the market and rating them on the basis of their performance and quality. These data points were further validated by primary sources.

Secondary sources referred for this research study on the aircraft braking system market included government sources, such as corporate filings that included annual reports, investor presentations, and financial statements, and trade, business, and professional associations. Secondary data was collected and analyzed to arrive at the overall market size, which was further validated by various primary respondents.

Primary Research

The aircraft braking system market comprises several stakeholders, such as raw material providers, aircraft braking system manufacturers and suppliers, and regulatory organizations in the supply chain. While the demand side of this market is characterized by various end users, the supply side is characterized by technological advancements in actuator technologies. Various primary sources from both the supply and demand sides of the market were interviewed to obtain qualitative and quantitative information.
Aircraft Braking System Market Size, and Share

To know about the assumptions considered for the study, download the pdf brochure

Market Size Estimation

Both top-down and bottom-up approaches were used to estimate and validate the size of the aircraft braking system market. The following figure offers a representation of the overall market size estimation process employed for the purpose of this study on the aircraft braking system market.

The research methodology used to estimate the market size includes the following details:

  • Key players in this market were identified through secondary research, and their market share was determined through primary and secondary research. This included a study of the annual and financial reports of top market players and extensive interviews of leaders such as Chief Executive Officers (CEOs), directors, and marketing executives of leading companies operating in the aircraft braking system market.
  • All percentage shares, splits, and breakdowns were determined using secondary sources and verified through primary sources.
  • All possible parameters that affect the markets covered in this research study were accounted for, viewed in extensive detail, verified through primary research, and analyzed to obtain the final quantitative and qualitative data.

Market Size Estimation Methodology: Bottom-Up Approach

Aircraft Braking System Market Size, and Bottom-up approach

Market Size Estimation Methodology: Top-Down Approach

Aircraft Braking System Market Size, and Top-Down Approach

Data triangulation

After arriving at the overall market size through the market size estimation process explained above, the total market was split into several segments and subsegments. In order to complete the overall market engineering process and arrive at the exact statistics of each market segment and subsegments, the data triangulation and market breakdown procedures were employed, wherever applicable. The data was triangulated by studying various factors and trends from both the demand- and supply-sides. Along with this, the market size was validated using both the top-down and bottom-up approaches.

Report Objectives

  • To define, describe, segment, and forecast the aircraft braking system market based on End User, Aircraft Type, Actuation. Component and Region.
  • To analyze demand- and supply-side indicators influencing the growth of the market
  • To understand the market structure by identifying high-growth segments and subsegments of the market
  • To provide in-depth market intelligence regarding key market dynamics, such as drivers, restraints, opportunities, and challenges, influencing the growth of the market
  • To forecast the revenues of market segments with respect to 6 main regions: North America, Europe, Asia Pacific, the Middle East, Africa, and Latin America
  • To analyze technological advancements and new product launches in the market from 2017 to 2022
  • To provide a detailed competitive landscape of the market, in addition to market share analysis of leading players
  • To identify the financial position, product portfolio, and key developments of leading players operating in the market
  • To analyze micromarkets with respect to their individual growth trends, prospects, and contribution to the overall market
  • To provide a comprehensive analysis of business and corporate strategies adopted by key market players
  • To profile key market players and comprehensively analyze their core competencies

Available customizations

Along with the market data, MarketsandMarkets offers customizations as per the specific needs of companies. The following customization options are available for the report:

Product Analysis

  • Product matrix, which gives a detailed comparison of the product portfolio of each company

Regional Analysis

  • Further breakdown of the market segments at country-level

Company Information

  • Detailed analysis and profiling of additional market players (up to 5)
Custom Market Research Services

We will customize the research for you, in case the report listed above does not meet with your exact requirements. Our custom research will comprehensively cover the business information you require to help you arrive at strategic and profitable business decisions.

Request Customization

Instant Answers with GPT - Ask Now!

Ask real questions. Get complete answers !
Report Code
AS 5248
Published ON
Dec, 2022
Choose License Type
BUY NOW
  • SHARE
X
Request Customization
Speak to Analyst
Speak to Analyst
OR FACE-TO-FACE MEETING
PERSONALIZE THIS RESEARCH
  • Triangulate with your Own Data
  • Get Data as per your Format and Definition
  • Gain a Deeper Dive on a Specific Application, Geography, Customer or Competitor
  • Any level of Personalization
REQUEST A FREE CUSTOMIZATION
LET US HELP YOU!
  • What are the Known and Unknown Adjacencies Impacting the Aircraft Braking System Market
  • What will your New Revenue Sources be?
  • Who will be your Top Customer; what will make them switch?
  • Defend your Market Share or Win Competitors
  • Get a Scorecard for Target Partners
CUSTOMIZED WORKSHOP REQUEST
knowledgestore logo

Want to explore hidden markets that can drive new revenue in Aircraft Braking System Market?

Find Hidden Markets
  • Call Us
  • +1-888-600-6441 (Corporate office hours)
  • +1-888-600-6441 (US/Can toll free)
  • +44-800-368-9399 (UK office hours)
CONNECT WITH US
ABOUT TRUST ONLINE
©2024 MarketsandMarkets Research Private Ltd. All rights reserved
DMCA.com Protection Status
Website Feedback