Africa Automotive Lubricants Market Share, Sales Channel Analysis and Market Size & Forecast to 2020


Africa Automotive Lubricants Market
The africa automotive lubricants market is projected to be worth 763,781.6 kilo liters by 2020, at a cagr 3.5%. This report provides an in-depth analysis on Africa’s automotive lubricants market for seven major countries, namely, Egypt, Nigeria, South Africa, Tanzania, Tunisia, Kenya, and Morocco. The analysis includes market size, sales channel, company market share, brand awareness, marketing/promotion channel, and customer preference. The information about market size is provided for commercial and passenger vehicle segments. Each segment is further classified by sales channels such as OEM dealership, workshops, garages, and independent retailers. For each of the seven countries covered in this study, top automotive lubricant brands (companies) and their market shares are provided.
For this study, lubricant customers such as OEM dealers, workshop operators, and garages were approached and information on brand awareness, marketing channel, and customer preference was collected. Almost 80% of the data is collected from primary sources using telephonic interviews, emails, social network websites, and online survey tools. Marketing/promotion channels such as banners & hoardings, TV commercials, digital media, print media, and others have been studied and analysis is provided based on what major brands have adopted as promotion channel for each country. The breakdown of profiles of primary interviewees is depicted in the below figure:
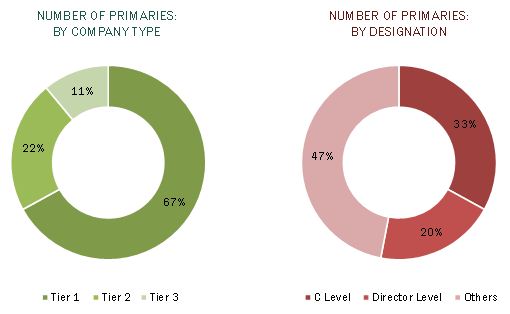
To know about the assumptions considered for the study, download the pdf brochure
Companies (or lubricant blenders) which are discussed and highlighted in this study are Royal Dutch Shell Plc. (Netherlands), Exxon Mobil Corporation (U.S.), Total S.A. (France), BP Plc. (U.K.), Chevron Corporation (U.S.), PetroChina Company Limited (China), Oil Libya (Kenya), Engen (South Africa), Valvoline (U.S.), KenolKobil (Kenya), Oryx Energies (Tanzania), Conoil Plc. (Nigeria), Misr Petroleum Company (Egypt), and many others.
The Target Audiences for the Africa Automotive Lubricants Market Report are as Follows:
- Automotive lubricants blenders
- Base oil, lubricant additives suppliers
- Automotive lubricants traders, distributors, and suppliers
- Investment banks and private equity firms
- Government bodies, research organizations, and associations
- Conferences’ organizers and participants
Africa Automotive Lubricants Market Report Scope
This report addresses the market of automotive lubricants for following countries:
- Egypt
- Kenya
- Tunisia
- Tanzania
- South Africa
- Nigeria
- Morocco
For each country, the following data has been covered:
- Market size by Type
-
Market size by Application & Sales channel
-
Passenger Vehicle
- OEM Dealership
- Workshops & servicing centers
- Garages
- Others
-
Commercial Vehicle
- OEM Dealership
- Workshops & servicing centers
- Garages
- Others
-
Passenger Vehicle
- Market share by brands/companies
- Marketing/Promotion channel
- Customer preference by sales channel
Africa Automotive Lubricants Market Report Available Customizations
With the given market data, MarketsandMarkets offers customizations according to the company’s specific needs. The following customization options are available for the report:
Country Analysis
- Information on additional countries
- More information on available countries
Company Information
- Detailed analysis and profiling of additional market players
Market Sizing
- Market sizing by vehicle type (four wheelers, two wheelers etc.), engine type, etc.
The Africa automotive lubricants market is projected to be worth 763,781.6 kilo liters by 2020, registering a CAGR of 3.5% between 2015 and 2020. The rapid growth in the automotive sector, driven by improved living standards and increased purchasing power of consumers, is a key factor driving the automotive lubricant market in the region.
The automotive lubricants market for Africa is classified on the basis of sales channels such as OEM dealership, workshops, garages, and others (includes independent retailers). In Africa, the passenger vehicle segment holds the major share in the automotive lubricant consumption. Independent workshop is the most preferred sales channel for lubricant refills in passenger vehicles. This is primarily because of faster service delivery offered by workshops as compared to OEM dealerships and low cost.
For most countries, hoardings & banners capture the maximum share in brand promotion channels for the African automotive lubricants market. This is because it is the convenient medium to reach out to the end users. TV commercial is the next preferred promotion channel with leading position in few countries. TV commercials help in spreading awareness about new products and also in informing people about the benefits of using right grade of lubricants. On the other hand, digital media has very small share. However, with the growth of information technology and infrastructure, it is projected to be a better medium to reach end users in future.
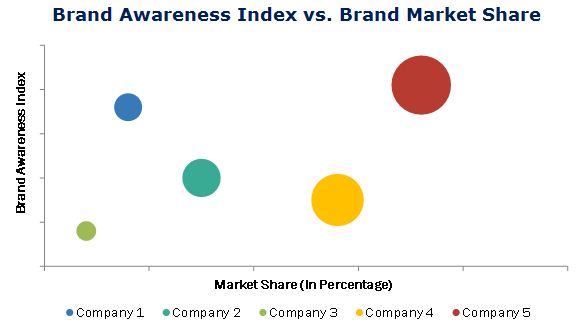
Behind selection of lubricant brand, margin is the most important factor, followed by price for workshops, garages, and retails. Other important factors are brand awareness, salesman relationship, product range, availability, delivery time, and product quality. For OEM dealership, this preference varies with country. For some countries, lubricants brand that dominate the market with the highest share and the brand with the highest market awareness are different.
Key Africa Automotive Lubricants Market Players
Some of the important automotive lubricants companies in Africa are Royal Dutch Shell Plc. (Netherlands), Exxon Mobil Corporation (U.S.), Total S.A. (France), BP Plc. (U.K.), Chevron Corporation (U.S.), PetroChina Company Limited (China), Oil Libya (Kenya), Engen (South Africa), Valvoline (U.S.), KenolKobil (Kenya), Oryx Energies (Tanzania), Conoil Plc. (Nigeria), Misr Petroleum Company (Egypt), and many others.
Frequently Asked Questions (FAQ):
How big is the africa automotive lubricants market industry?
The Africa automotive lubricants market is projected to be worth 763,781.6 kilo liters by 2020, registering a CAGR of 3.5% between 2015 and 2020.
Who leading market players in africa automotive lubricants industry?
Currently, the automotive lubricants market in Africa is dominated by various market players such as Royal Dutch Shell Plc. (Netherlands), Exxon Mobil Corporation (U.S.), Total S.A. (France), BP Plc. (U.K.), Chevron Corporation (U.S.), PetroChina Company Limited (China), Oil Libya (Kenya), Engen (South Africa), Valvoline (U.S.), KenolKobil (Kenya), Oryx Energies (Tanzania), Conoil Plc. (Nigeria), and Misr Petroleum Company (Egypt).
To speak to our analyst for a discussion on the above findings, click Speak to Analyst
 Exclusive indicates content/data unique to MarketsandMarkets and not available with any competitors.
Table of Contents
1 Introduction (Page No. - 11)
1.1 Objectives of the Study
1.2 Market Definition
1.3 Market Scope
1.3.1 Merket Covered
1.3.2 Years Considered for the Report
1.4 Limitations
2 Research Methodology (Page No. - 14)
2.1 Market Size Estimation
2.2 Market Breakdown and Data Triangulation
2.3 Market Share Estimation
2.3.1 Assumptions
3 Premium Insights (Page No. - 19)
3.1 African Countries Offer Untapped and Unexplored Opportunities
3.2 Egypt to Emerge as A Lucrative Market in Africa
3.3 Life Cycle Analysis, By Region
4 Industry Trends (Page No. - 22)
4.1 Introduction
4.2 Value Chain Analysis
5 Automotive Lubricants Market in Africa, By Country (Page No. - 24)
5.1 Introduction
5.2 Egypt
5.2.1 Introduction
5.2.2 Market Size and Projection
5.2.3 Application and Sales Channels
5.2.4 Consumer Preferences and Market Share
5.2.5 Brand Promotion Channel
5.3 Kenya
5.3.1 Introduction
5.3.2 Market Size and Projection
5.3.3 Application and Sales Channels
5.3.4 Consumer Preferences and Market Share
5.3.5 Brand Promotion
5.4 Tunisia
5.4.1 Introduction
5.4.2 Market Size and Projection
5.4.3 Application and Sales Channel
5.4.4 Consumer Preferences & Market Share
5.4.5 Brand Promotion
5.5 Tanzania
5.5.1 Introduction
5.5.2 Market Size and Projection
5.5.3 Application and Sales Channel
5.5.4 Consumer Preferences and Market Share
5.5.5 Brand Promotion
5.6 South Africa
5.6.1 Introduction
5.6.2 Market Size and Projection
5.6.3 Application and Sales Channel
5.6.4 Application and Sales Channel
5.6.5 Brand Promotion
5.7 Nigeria
5.7.1 Introduction
5.7.2 Market Size and Projection
5.7.3 Application and Sales Channel
5.7.4 Consumer Preferences and Market Share
5.7.5 Brand Promotion
5.8 Morocco
5.8.1 Introduction
5.8.2 Market Size and Projection
5.8.3 Application and Sales Channel
5.8.4 Consumer Preferences and Market Share
5.8.5 Brand Promotion
6 Competitive Landscape (Page No. - 65)
6.1 Overview
6.2 Expansions and Agreements: Most Popular Growth Strategies
6.3 Maximum Developments in 2014
6.4 Competitive Situations and Trends
6.4.1 Developments
7 Company Profiles (Page No. - 70)
(Overview, Financial*, Products & Services, Strategy, and Developments)
7.1 Key Players for Automotive Lubricants in Africa
7.2 Royal Dutch Shell PLC.
7.3 Exxon Mobil Corporation
7.4 BP PLC.
7.5 Chevron Corporation
7.6 Total S.A.
7.7 Petrochina Company Limited
7.8 Sinopec Limited
7.9 Lukoil
7.10 Fuchs Petrolub AG
7.11 Idemitsu Kosan Co. Ltd.
*Details Might Not Be Captured in Case of Unlisted Companies
List of Tables (14 Tables)
Table 1 Egypt: Africa Automotive Lubricants Market Size, By Type, 2013–2020 (Kiloliter)
Table 2 Egypt: Africa Automotive Lubricant Market Size, By Application & Sales Channel, 2013–2020 (Kiloliter)
Table 3 Kenya: Africa Automotive Lubricants Market Size, By Type, 2013–2020 (Kiloliter)
Table 4 Kenya: Africa Automotive Lubricant Market Size, By Application and Sales Channel, 2013–2020 (Kiloliter)
Table 5 Tunisia: Africa Automotive Lubricants Market Size, By Type, 2013–2020 (Kiloliter)
Table 6 Tunisia: Africa Automotive Lubricant Market Size, By Application & Sales Channel, 2013–2020 (Kiloliter)
Table 7 Tanzania: Africa Automotive Lubricants Market Size, By Type, 2013–2020 (Kiloliter)
Table 8 Tanzania: Africa Automotive Lubricant Market Size, By Application & Sales Channel, 2013–2020 (Kiloliter)
Table 9 South Africa: Africa Automotive Lubricants Market Size, By Type, 2013–2020 (Kiloliter)
Table 10 South Africa: Africa Automotive Lubricant Market Size, By Application and Sales Channel, 2013–2020 (Kiloliter)
Table 11 Nigeria: Africa Automotive Lubricants Market Size, By Type, 2013–2020 (Kiloliter)
Table 12 Nigeria: Africa Automotive Lubricant Market Size, By Application & Sales Channel, 2013–2020 (Kiloliter)
Table 13 Morocco: Africa Automotive Lubricants Market Size, By Type, 2013–2020 (Kiloliter)
Table 14 Morocco: Africa Automotive Lubricant Market Size, By Application and Sales Channel, 2013–2020 (Kiloliters)
List of Figures (63 Figures)
Figure 1 Market Size Estimation: Bottom-Up Approach
Figure 2 Market Size Estimation: Top-Down Approach
Figure 3 Breakdown of Primary Interviews
Figure 4 Key Data From Secondary Sources
Figure 5 Growth in the Automotive Industry is Increasing the Lubricants Sales
Figure 6 African Countries With High Growth
Figure 7 The Africa Lubrican Market is in the Growth Phase
Figure 8 Value Chain Analysis for Automotive Lubricants
Figure 9 Egypt: Synthetic Lubricants Market By Sales Channel
Figure 10 Egypt: Automotive Lubricants Market Share, By Sales Channel, 2014
Figure 11 Market Share Analysis of Automotive Lubricants Market in Egypt, 2014
Figure 12 Egypt: Hoardings & Banners Captured the Maximum Share in Egypt
Figure 13 Customer Preference By Sales Channelanalysis
Figure 14 Brand Awareness Index vs Brand Market Share
Figure 15 Kenya: Automotive Lubricants Market Share, By Sales Channel, 2014
Figure 16 Market Share Analysis of Automotive Lubricants Market in Kenya, 2014
Figure 17 Kenya: Hoardings & Banners is Adopted By Major Brands as Their Brand Promotion Channel
Figure 18 Customer Preference By Sales Channelanalysis
Figure 19 Brand Awareness Index vs Brand Market Share
Figure 20 Tunisia: Synthetic Lubricant Market By Sales Channel
Figure 21 Tunisia: Automotive Lubricants Market Share, By Sales Channel, 2014
Figure 22 Market Share Analysis of Automotive Lubricants Market in Tunisia, 2014
Figure 23 Hoardings & Banners Captured the Maximum Share in Tunisia
Figure 24 Customer Preference By Sales Channelanalysis
Figure 25 Brand Awareness Index vs Brand Market Share
Figure 26 Tanzania: Automotive Lubricants Market Share, By Sales Channel 2014
Figure 27 Market Share Analysis of Automotive Lubricants Market in Tanzania, 2014
Figure 28 Tanzania: Billboards is the Major Brand Promotion Channels Adopted By Major Brands
Figure 29 Customer Preference By Sales Channelanalysis
Figure 30 Brand Awareness Index vs Brand Market Share
Figure 31 South Africa: Synthetic Lubricants Market By Sales Channel
Figure 32 South Africa: Automotive Lubricant Market Share, By Sales Channel 2014
Figure 33 Market Share Analysis of Automotive Lubricants Market in South Africa, 2014
Figure 34 South Africa: TV Commercials is the Major Brand Promotion Channels Adopted By Major Brands
Figure 35 Customer Preference By Sales Channelanalysis
Figure 36 Brand Awareness Index vs Brand Market Share
Figure 37 Nigeria: Automotive Lubricants Market Share, By Sales Channel 2014
Figure 38 Market Share Analysis of Automotive Lubricants Market in Nigeria, 2014
Figure 39 Nigeria: Hoardings & Banners is Adopted By the Major Brands for Promotion
Figure 40 Customer Preference By Sales Channelanalysis
Figure 41 Brand Awareness Index vs Brand Market Share
Figure 42 Morocco: Automotive Lubricant Market Share, By Sales Channel 2014
Figure 43 Market Share Analysis of Automotive Lubricants Market in Morocco, 2014
Figure 44 Morocco: TV Commercials is the Major Brand Promotion Channel Adopted By Major Brands
Figure 45 Customer Preference By Sales Channelanalysis
Figure 46 Brand Awareness Index vs Brand Market Share
Figure 47 Major Growth Strategies in the Global Lubricants Market, 2010–2015
Figure 48 Maximum Number of Developments Recorded in the Year 2014
Figure 49 Royal Dutch Shell PLC: Business Overview
Figure 50 Royal Dutch Shell PLC: SWOT Analysis
Figure 51 Exxon Mobil Corporation: Business Overview
Figure 52 Exxonmobil Corporation: SWOT Analysis
Figure 53 BP PLC.: Business Overview
Figure 54 BP PLC.: SWOT Analysis
Figure 55 Chevron Corporation: Business Overview
Figure 56 Chevron Corporation: SWOT Analysis
Figure 57 Total S.A.: Business Overview
Figure 58 Total S.A.: SWOT Analysis
Figure 59 Petrochina Company Limited: Business Overview
Figure 60 Sinopec Limited: Business Overview
Figure 61 Lukoil: Business Overview
Figure 62 Fuchs Petrolub AG: Business Overview
Figure 63 Idemitsu Kosan Co. Ltd.: Business Overview


Growth opportunities and latent adjacency in Africa Automotive Lubricants Market