Aerosol Valves Market by Type (Metered, and Continuous), End-use sector (Personal care, home care, Healthcare, Automotive), And Region (North America, Europe, Asia-Pacific, Latin America, and Middle East & Africa) - Global Forecast to 2022


The aerosol valves market is projected to reach USD 3.30 Billion by 2022, at a CAGR of 4.03%. The base year considered for the study is 2016, and the market size is forecasted from 2017 to 2022. The primary objective of the study is to define, segment, and project the aerosol valves market size on the basis of type, end-use sector, and region. The study also aims at strategically analyzing micromarkets with respect to individual growth trends, future prospects, and their contribution to the total market. It also provides detailed information about the main factors influencing the growth of the market (drivers, restraints, opportunities, and industry-specific challenges). In addition to this, the study analyzes competitive developments such as partnerships, expansions & investments, and R&D activities in the aerosol valves market.
The research methodology used to estimate and forecast the market size included the top-down approach. The total market size for aerosol valves was calculated, and accordingly, the percentage was allotted to different sectors in each of the segments. This allotment and calculation were done on the basis of extensive primary interviews and secondary research from a variety of sources such as AEROBOL (European Association of Aluminium Aerosol Container Manufacturers), FEA (European Aerosol Federation), and NAA (National Aerosol Association). Primary research involved in this report includes extensive interviews with key people such as CEOs, VPs, directors, and executives. After arriving at the overall market size, the total market was split into several segments and subsegments. These data triangulation and market breakdown procedures were employed to complete the overall market engineering process and arrive at the exact statistics for all segments and subsegments. The breakdown of profiles of primary respondents is depicted in the figure below.
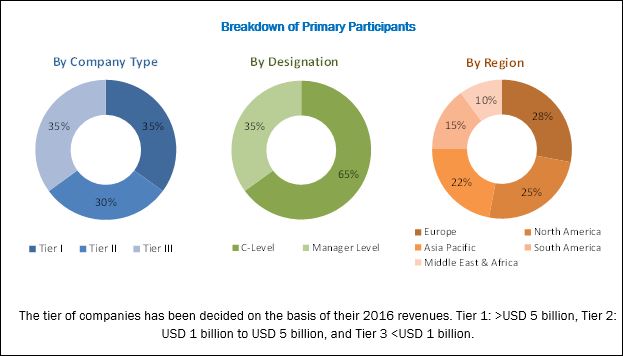
To know about the assumptions considered for the study, download the pdf brochure
Key Players in Aerosol Valves Market
The key players operating in the aerosol valves market includes Aptar Group (US), Precision Valve Corporation (US), Coster Tecnologie Speciali (Italy), LINDAL Group Holding (Germany), Mitani Valve (Japan), Summit Packaging Systems (UK), Clayton Corp. (US), Newman Green (US), KOH-I-NOOR Mladá Vo�ice a.s. (Czech Republic), SALVALCO (US), Majesty Packaging System Limited (China), Shanghai Sunhome Industrial Company (China), EC Packs Industrial Limited (Hong Kong), C. Ehrensperger AG. (Switzerland), Aroma Industries (India), Seung IL Corporation (South Korea), Yingbo Aerosol Valve (Zhongshan) Co., Ltd. (China), Guangzhou Zhongpin Aerosol Valves Co., Ltd (China)
Target Audience in Aerosol Valves Market
- Manufacturers of aerosol valves
- Importers and exporters of aerosol valves
- Traders, distributors, and suppliers of aerosol valves
- End users (food & beverage, healthcare, and cosmetics & toiletries industries)
Aerosol Valves Market Report Scope
This research report categorizes the aerosol valves market based on type, end-use sector, and region.
Based on Type, the market has been segmented as follows:
- Continuous
- Metered
Based on End-use Sector, the market has been segmented as follows:
- Personal care
- Home care
- Healthcare
- Automotive
- Others (food & beverage and electronics)
Based on Region, the market has been segmented as follows:
- North America
- Europe
- Asia Pacific
- Middle East & Africa
- Latin America
Available Customizations
With the given market data, MarketsandMarkets offers customizations as per the client-specific needs. The following customization options are available for the report:
Product Analysis
- Product matrix which gives a detailed comparison of the market for different recycled product types
Geographic Analysis
- Further analysis of aerosol valves market for additional countries
Company Information
- Detailed analysis and profiling of additional market players (up to five)
MarketsandMarkets projects that the aerosol valves market size will grow from USD 2.71 Billion in 2017 to USD 3.30 Billion by 2022, growing at a CAGR of 4.03% between 2017 and 2022. Growing demand for aerosol-based products in the home care, personal care, and healthcare sectors are driving the market growth for aerosol valves which offers ease of handling and occupies less space. Furthermore, the growing demand for easy to use products due to widening consumer acceptance is expected to drive the growth of the aerosol valves market.
The aerosol valves market has been segmented on the basis of type, end-use sector, and region. On the basis of type, continuous aerosol valves accounted for a larger market share in 2017, in terms of both volume and value due to its wide range of application in various end-use sectors. For instance, in personal care, continuous aerosol valves are used in deodorants, hairsprays, and shaving creams; in the automotive sector they are used for spray paints and in lubricants dispensing aerosol cans; and in the food & beverage industry, aerosol valves due to their easy dispensing mechanism are widely used for whipped cream dispensing aerosol cans.
On the basis of end-use sector, the personal care segment accounted for the largest market share, in terms of both volume and value. Increase in disposable incomes of the population in developing countries and change in preferences of manufacturers for convenient packaging are some of the factors that are driving the aerosol valves market. Aerosol valves are widely used in the personal care industry in aerosol cans for the packaging of different products such as deodorants, face & body creams, shaving foams, and perfumes.
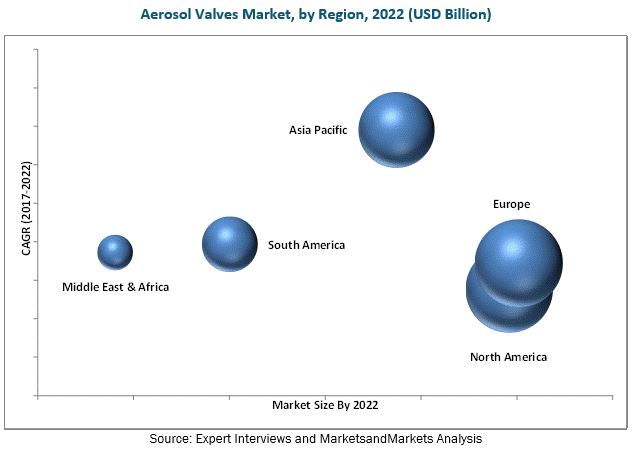
On the basis of key regions, the market for aerosol valves has been segmented into North America, Europe, Asia Pacific, Middle East & Africa, and South America. North America accounted for the largest share among all the regions in 2016. This is mainly due to the developed economies of the US and Canada, coupled with growth in applications of aerosol valves in the personal care, automotive, and healthcare industries.
Availability of alternatives in terms of packaging and price are the restraining factors for the growth of the aerosol valves market. Disposal of the aerosol valves and environmental concerns also pose a challenge to aerosol valves manufacturers.
Key Aerosol Valves Market Industry Players
Expansion & investments and partnerships were the key strategies adopted by most players in this market. Companies such as Aptar Group (US), Precision Valve Corporation (US), Coster Tecnologie Speciali (Italy), LINDAL Group Holding (Germany), Mitani valve (Japan), Summit Packaging Systems (UK), Clayton Corp. (US), Newman Green (US), and KOH-I-NOOR Mladá Vo�ice a.s. (Czech Republic) were the key players who adopted these strategies to increase the customer base in key markets. The leading aerosol valves manufacturers focus on emerging countries that are estimated to show potential for industrial development in the near future.
Frequently Asked Questions (FAQ):
How big is the Aerosol Valves Market industry?
The aerosol valves market size is projected to grow from USD 2.71 Billion in 2017 to reach USD 3.30 Billion by 2022, at a CAGR of 4.03%.
Who leading market players in Aerosol Valves industry?
The major players in Aerosol Valves Market are Aptar Group (US), Precision Valve Corporation (US), Coster Tecnologie Speciali (Italy), LINDAL Group Holding (Germany), Mitani Valve (Japan), Summit Packaging Systems (UK), Clayton Corp. (US), Newman Green (US), KOH-I-NOOR Mladá Vo�ice a.s. (Czech Republic), and SALVALCO (US).
To speak to our analyst for a discussion on the above findings, click Speak to Analyst
 Exclusive indicates content/data unique to MarketsandMarkets and not available with any competitors.
Table of Contents
1 Introduction (Page No. - 14)
1.1 Objectives of the Study
1.2 Market Definition
1.3 Study Scope
1.3.1 Regional Scope
1.3.2 Periodization Considered
1.4 Currency Considered
1.5 Units Considered
1.6 Stakeholders
2 Research Methodology (Page No. - 18)
2.1 Research Data
2.1.1 Secondary Data
2.1.1.1 Key Data From Secondary Sources
2.1.2 Primary Data
2.1.2.1 Key Data From Primary Sources
2.2 Factor Analysis
2.2.1 Introduction
2.2.2 Demand-Side Analysis
2.2.3 Supply-Side Analysis
2.3 Market Size Estimation
2.4 Data Triangulation
2.5 Market Share Estimation
2.6 Research Assumptions & Limitations
2.6.1 Assumptions Made for This Study
2.7 Limitations of the Research Study
3 Executive Summary (Page No. - 28)
4 Premium Insights (Page No. - 32)
4.1 Developing Economies to Witness Higher Demand for Aerosol Valves
4.2 Aerosol Valves Market, By Type
4.3 Aerosol Valves Market, By End-Use Sector
4.4 Aerosol Valves Market: Regional Snapshot
5 Market Overview (Page No. - 35)
5.1 Introduction
5.2 Market Dynamics
5.2.1 Drivers
5.2.1.1 Strong Demand From the Cosmetic & Personal Care Industry
5.2.1.2 Shift Towards Easy-To-Handle and Convenient Packaging
5.2.1.3 Concerns About Product Safety and Security
5.2.2 Restraints
5.2.2.1 Availability of Alternatives in Terms of Packaging and Price
5.2.3 Opportunities
5.2.3.1 Emerging Economies Offer High Growth Potential
5.2.4 Challenges
5.2.4.1 Stringent Government Regulations
6 Aerosol Valves Market, By Type (Page No. - 40)
6.1 Introduction
6.1.1 Continuous
6.1.2 Metered
7 Aerosol Valves Market, By End-Use Sector (Page No. - 43)
7.1 Introduction
7.1.1 Personal Care
7.1.2 Home Care
7.1.3 Healthcare
7.1.4 Automotive
7.1.5 Others
8 Aerosol Valves Market, By Region (Page No. - 48)
8.1 Introduction
8.2 North America
8.2.1 US
8.2.2 Canada
8.2.3 Mexico
8.3 Europe
8.3.1 Germany
8.3.2 UK
8.3.3 France
8.3.4 Italy
8.3.5 Spain
8.3.6 Rest of Europe
8.4 Asia Pacific
8.4.1 China
8.4.2 Japan
8.4.3 Australia
8.4.4 India
8.4.5 Indonesia
8.4.6 Rest of Asia Pacific
8.5 Middle East & Africa (MEA)
8.5.1 Turkey
8.5.2 UAE
8.5.3 South Africa
8.5.4 Saudi Arabia
8.5.5 Rest of the Middle East & Africa
8.6 South America
8.6.1 Brazil
8.6.2 Argentina
8.6.3 Rest of South America
9 Competitive Landscape (Page No. - 112)
9.1 Overview
9.2 Market Ranking of Key Players
9.2.1 Aptar Group (US)
9.2.2 Precision Valve Corporation (US)
9.2.3 Coster Tecnologie Speciali (Italy)
9.2.4 Lindal Group Holding (Germany)
9.2.5 Mitani Valve (Japan)
9.3 Competetive Scenario
9.3.1 Expansions & Investments
9.3.2 Partnerships
9.4 Production Capacity Analysis
10 Company Profiles (Page No. - 116)
(Business Overview, Products & Services, Key Insights, Recent Developments, SWOT Analysis, MnM View)*
10.1 Aptargroup
10.2 The Precision Valve Corporation
10.3 Coster Tecnologie Speciali
10.4 Lindal Group Holding GmbH
10.5 Mitani Valve
10.6 Summit Packaging Systems
10.7 Clayton Corp.
10.8 Newman Green
10.9 Koh-I-Noor Mladá Vo�ice A.S.
10.10 Salvalco
10.11 Majesty Packaging Systems Limited
10.12 Shanghai Sunhome Industrial Company
10.13 EC Pack Industrial Limited
10.14 C. Ehrensperger Ag.
10.15 Aroma Industries
10.16 Seugn Il Corporation
10.17 Yingbo Aerosol Valve (Zhongshan) Co., Ltd.
10.18 Guangzhou Zhongpin Aerosol Valves Co., Ltd
*Details on Business Overview, Products & Services, Key Insights, Recent Developments, SWOT Analysis, MnM View Might Not Be Captured in Case of Unlisted Companies.
11 Appendix (Page No. - 136)
11.1 Discussion Guide
11.2 Knowledge Store: Marketsandmarkets’ Subscription Portal
11.3 Introducing RT: Real-Time Market Intelligence
11.4 Available Customizations
11.5 Related Reports
11.6 Author Details
List of Tables (132 Tables)
Table 1 Aerosol Valves Market, By Type, 2015–2022 (USD Million)
Table 2 Aerosol Valves Market, By Type, 2015–2022 (Million Units)
Table 3 Aerosol Valves Market Size, By End-Use Sector, 2015–2022 (USD Million)
Table 4 Aerosol Valves Market Size, By End-Use Sector, 2015–2022 (Million Units)
Table 5 Aerosol Valves Market Size, By Region, 2015–2022 (USD Million)
Table 6 Aerosol Valves Market Size, By Region, 2015–2022 (Million Units)
Table 7 North America: By Market Size, By Country, 2015–2022 (USD Million)
Table 8 North America: By Market Size, By Country, 2015–2022 (Million Units)
Table 9 North America: By Market Size, By Type, 2015–2022 (USD Million)
Table 10 North America: By Market Size, By Type, 2015–2022 (Million Units)
Table 11 North America: By Market Size, By End-Use Sector, 2015–2022 (USD Million)
Table 12 North America: By Market Size, By End-Use Sector, 2015–2022 (Million Units)
Table 13 US: By Market Size, By Type, 2015–2022 (USD Million)
Table 14 US: By Market Size, By Type, 2015–2022 (Million Units)
Table 15 US: By Market Size, By End-Use Sector, 2015–2022 (USD Million)
Table 16 US: By Market Size, By End-Use Sector, 2015–2022 (Million Units)
Table 17 Canada: By Market Size, By Type, 2015–2022 (USD Million)
Table 18 Canada: By Market Size, By Type, 2015–2022 (Million Units)
Table 19 Canada: By Market Size, By End-Use Sector, 2015–2022 (USD Million)
Table 20 Canada: By Market Size, By End-Use Sector, 2015–2022 (Million Units)
Table 21 Mexico: By Market Size, By Type, 2015–2022 (USD Million)
Table 22 Mexico: By Market Size, By Type, 2015–2022 (Million Units)
Table 23 Mexico: By Market Size, By End-Use Sector, 2015–2022 (USD Million)
Table 24 Mexico: By Market Size, By End-Use Sector, 2015–2022 (Million Units)
Table 25 Europe: By Market Size, By Country, 2015–2022(USD Million)
Table 26 Europe: By Market Size, By Country, 2015–2022(Million Units)
Table 27 Europe: By Market Size, By Type, 2015–2022 (USD Million)
Table 28 Europe: By Market Size, By Type, 2015–2022 (Million Units)
Table 29 Europe: By Market Size, By End-Use Sector, 2015–2022 (USD Million)
Table 30 Europe: By Market Size, By End-Use Sector, 2015–2022 (Million Units)
Table 31 Germany: By Market Size, By Type, 2015–2022 (USD Million)
Table 32 Germany: By Market Size, By Type, 2015–2022 (Million Units)
Table 33 Germany: By Market Size, By End-Use Sector, 2015–2022 (USD Million)
Table 34 Germany: By Market Size, By End-Use Sector, 2015–2022 (Million Units)
Table 35 UK: Aerosol Valves Market Size, By Type, 2015–2022 (USD Million)
Table 36 UK: Aerosol Valves Market Size, By Type, 2015–2022 (Million Units)
Table 37 UK: Aerosol Valves Market Size, By End-Use Sector, 2015–2022 (USD Million)
Table 38 UK: Aerosol Valves Market Size, By End-Use Sector, 2015–2022 (Million Units)
Table 39 France: By Market Size, By Type, 2015–2022 (USD Million)
Table 40 France: By Market Size, By Type, 2015–2022 (Million Units)
Table 41 France: By Market Size, By End-Use Sector, 2015–2022 (USD Million)
Table 42 France: By Market Size, By End-Use Sector, 2015–2022 (Million Units)
Table 43 Italy: By Market Size, By Type, 2015–2022 (USD Million)
Table 44 Italy: By Market Size, By Type, 2015–2022 (Million Units)
Table 45 Italy: By Market Size, By End-Use Sector, 2015–2022 (USD Million)
Table 46 Italy: By Market Size, By End-Use Sector, 2015–2022 (Million Units)
Table 47 Spain: By Market Size, By Type, 2015–2022 (USD Million)
Table 48 Spain: By Market Size, By Type, 2015–2022 (Million Units)
Table 49 Spain: By Market Size, By End-Use Sector, 2015–2022 (USD Million)
Table 50 Spain: By Market Size, By End-Use Sector, 2015–2022 (Million Units)
Table 51 Rest of Europe: Aerosol Valves Market Size, By Type, 2015–2022 (USD Million)
Table 52 Rest of Europe: Aerosol Valves Market Size, By Type, 2015–2022 (Million Units)
Table 53 Rest of Europe: Aerosol Valves Market Size, By End-Use Sector, 2015–2022 (USD Million)
Table 54 Rest of Europe: Aerosol Valves Market Size, By End-Use Sector, 2015–2022 (Million Units)
Table 55 Asia Pacific: By Market Size, By Country, 2015–2022(USD Million)
Table 56 Asia Pacific: By Market Size, By Country, 2015–2022(Million Units)
Table 57 Asia Pacific: By Market Size, By Type, 2015–2022 (USD Million)
Table 58 Asia Pacific: By Market Size, By Type, 2015–2022 (Million Units)
Table 59 Asia Pacific: By Market Size, By End-Use Sector, 2015–2022 (USD Million)
Table 60 Asia Pacific: By Market Size, By End-Use Sector, 2015–2022 (Million Units)
Table 61 China: Aerosol Valves Market Size, By Type, 2015–2022 (USD Million)
Table 62 China: Aerosol Valves Market Size, By Type, 2015–2022 (Million Units)
Table 63 China: By Market Size, By End-Use Sector, 2015–2022 (USD Million)
Table 64 China: By Market Size, By End-Use Sector, 2015–2022 (Million Units)
Table 65 Japan: By Market Size, By Type, 2015–2022 (USD Million)
Table 66 Japan: By Market Size, By Type, 2015–2022 (Million Units)
Table 67 Japan: By Market Size, By End-Use Sector, 2015–2022 (USD Million)
Table 68 Japan: By Market Size, By End-Use Sector, 2015–2022 (Million Units)
Table 69 Australia: By Market Size, By Type, 2015–2022 (USD Million)
Table 70 Australia: By Market Size, By Type, 2015–2022 (Million Units)
Table 71 Australia: By Market Size, By End-Use Sector, 2015–2022 (USD Million)
Table 72 Australia: By Market Size, By End-Use Sector, 2015–2022 (Million Units)
Table 73 India: By Market Size, By Type, 2015–2022 (USD Million)
Table 74 India: By Market Size, By Type, 2015–2022 (Million Units)
Table 75 India: By Market Size, By End-Use Sector, 2015–2022 (USD Million)
Table 76 India: By Market Size, By End-Use Sector, 2015–2022 (Million Units)
Table 77 Indonesia: Aerosol Valves Market Size, By Type, 2015–2022 (USD Million)
Table 78 Indonesia: Aerosol Valves Market Size, By Type, 2015–2022 (Million Units)
Table 79 Indonesia: Aerosol Valves Market Size, By End-Use Sector, 2015–2022 (USD Million)
Table 80 Indonesia: Aerosol Valves Market Size, By End-Use Sector, 2015–2022 (Million Units)
Table 81 Rest of Asia Pacific: By Market Size, By Type, 2015–2022 (USD Million)
Table 82 Rest of Asia Pacific: By Market Size, By Type, 2015–2022 (Million Units)
Table 83 Rest of Asia Pacific: By Market Size, By End-Use Sector, 2015–2022 (USD Million)
Table 84 Rest of Asia Pacific: By Market Size, By End-Use Sector, 2015–2022 (Million Units)
Table 85 Middle East & Africa: By Market Size, By Country, 2015–2022(USD Million)
Table 86 Middle East & Africa: By Market Size, By Country, 2015–2022(Million Units)
Table 87 Middle East & Africa: By Market Size, By Type, 2015–2022 (USD Million)
Table 88 Middle East & Africa: By Market Size, By Type, 2015–2022 (Million Units)
Table 89 Middle East & Africa: By Market Size, By End-Use Sector, 2015–2022 (USD Million)
Table 90 Middle East & Africa: By Market Size, By End-Use Sector, 2015–2022 (Million Units)
Table 91 Turkey: Aerosol Valves Market Size, By Type, 2015–2022 (USD Million)
Table 92 Turkey: Aerosol Valves Market Size, By Type, 2015–2022 (Million Units)
Table 93 Turkey: Aerosol Valves Market Size, By End-Use Sector, 2015–2022 (USD Million)
Table 94 Turkey: Aerosol Valves Market Size, By End-Use Sector, 2015–2022 (Million Units)
Table 95 UAE: Aerosol Valves Market Size, By Type, 2015–2022 (USD Million)
Table 96 UAE: Aerosol Valves Market Size, By Type, 2015–2022 (Million Units)
Table 97 UAE: Aerosol Valves Market Size, By End-Use Sector, 2015–2022 (USD Million)
Table 98 UAE: Aerosol Valves Market Size, By End-Use Sector, 2015–2022 (Million Units)
Table 99 South Africa: Aerosol Valves Market Size, By Type, 2015–2022 (USD Million)
Table 100 South Africa: Aerosol Valves Market Size, By Type, 2015–2022 (Million Units)
Table 101 South Africa: Aerosol Valves Market Size, By End-Use Sector, 2015–2022 (USD Million)
Table 102 South Africa: Aerosol Valves Market Size, By End-Use Sector, 2015–2022 (Million Units)
Table 103 Saudi Arabia: Aerosol Valves Market Size, By Type, 2015–2022 (USD Million)
Table 104 Saudi Arabia: Aerosol Valves Market Size, By Type, 2015–2022 (Million Units)
Table 105 Saudi Arabia: Aerosol Valves Market Size, By End-Use Sector, 2015–2022 (USD Million)
Table 106 Saudi Arabia: Aerosol Valves Market Size, By End-Use Sector, 2015–2022 (Million Units)
Table 107 Rest of the Middle East & Africa: Aerosol Valves Market Size, By Type, 2015–2022 (USD Million)
Table 108 Rest of the Middle East & Africa: Aerosol Valves Market Size, By Type, 2015–2022 (Million Units)
Table 109 Rest of the Middle East & Africa: Aerosol Valves Market Size, By End-Use Sector, 2015–2022 (USD Million)
Table 110 Rest of the Middle East & Africa: Aerosol Valves Market Size, By End-Use Sector, 2015–2022 (Million Units)
Table 111 South America: Aerosol Valves Market Size, By Country, 2015–2022(USD Million)
Table 112 South America: Aerosol Valves Market Size, By Country, 2015–2022(Million Units)
Table 113 South America: Aerosol Valves Market Size, By Type, 2015–2022 (USD Million)
Table 114 South America: Aerosol Valves Market Size, By Type, 2015–2022 (Million Units)
Table 115 South America: Aerosol Valves Market Size, By End-Use Sector, 2015–2022 (USD Million)
Table 116 South America: Aerosol Valves Market Size, By End-Use Sector, 2015–2022 (Million Units)
Table 117 Brazil: Aerosol Valves Market Size, By Type, 2015–2022 (USD Million)
Table 118 Brazil: Aerosol Valves Market Size, By Type, 2015–2022 (Million Units)
Table 119 Brazil: Aerosol Valves Market Size, By End-Use Sector, 2015–2022 (USD Million)
Table 120 Brazil: Aerosol Valves Market Size, By End-Use Sector, 2015–2022 (Million Units)
Table 121 Argentina: Aerosol Valves Market Size, By Type, 2015–2022 (USD Million)
Table 122 Argentina: Aerosol Valves Market Size, By Type, 2015–2022 (Million Units)
Table 123 Argentina: Aerosol Valves Market Size, By End-Use Sector, 2015–2022 (USD Million)
Table 124 Argentina: Aerosol Valves Market Size, By End-Use Sector, 2015–2022 (Million Units)
Table 125 Rest of South America: Aerosol Valves Market Size, By Type, 2015–2022 (USD Million)
Table 126 Rest of South America: Aerosol Valves Market Size, By Type, 2015–2022 (Million Units)
Table 127 Rest of South America: Aerosol Valves Market Size, By End-Use Sector, 2015–2022 (USD Million)
Table 128 Rest of South America: Aerosol Valves Market Size, By End-Use Sector, 2015–2022 (Million Units)
Table 129 Market Ranking
Table 130 Expansions
Table 131 Partnerships
Table 132 Production Capacity of Top 10 Key Players (Million Units)
List of Figures (23 Figures)
Figure 1 Market Segmentation
Figure 2 Aerosol Valves Market, By Region
Figure 3 Aerosol Valve Market: Research Design
Figure 4 Breakdown of Primaries
Figure 5 Market Size Estimation Methodology: Bottom-Up Approach
Figure 6 Market Size Estimation Methodology: Top-Down Approach
Figure 7 Data Triangulation Methodology
Figure 8 Personal Care is Projected to Remain the Largest End-Use Sector Through 2022
Figure 9 Continuous Segment Projected to Account for the Largest Share Through 2022
Figure 10 North America Was the Largest Market for Aerosol Valves in 2016
Figure 11 Emerging Economies Offer Attractive Opportunities in the Aerosol Valves Market
Figure 12 Continuous Segment to Lead the Market Through 2022
Figure 13 Automotive Segment to Grow at the Highest Rate During the Forecast Period
Figure 14 Market in India is Projected to Grow at the Highest Rate From 2017 to 2022
Figure 15 Shift Towards Convenient Packaging is the Key Driver for the Growth of the Aerosol Valves Market
Figure 16 U.K.: Annual Expenditure on Personal Care, 2010–2014 (USD Billion).
Figure 17 Continuous Segment Accounted for the Largest Market Share in 2016
Figure 18 Aerosol Valves Market is Projected to Experience Higher Growth in the Personal Care Sector Through 2022
Figure 19 UK: Turnover From Retail Sale of Pharmaceutical Products, 2008–2015
Figure 20 Geographic Snapshot (2017–2022): Market in India is Projected to Grow at the Highest Rate, in Terms of Value
Figure 21 North American Aerosol Valves Market Snapshot: the US is Projected to Be the Fastest-Growing Market Between 2016 & 2021
Figure 22 Companies Adopted Expansio & Acquisation Growth Strategies in 2015 and 2016
Figure 23 Aptargroup : Company Snapshot


Growth opportunities and latent adjacency in Aerosol Valves Market