Project Portfolio Management (PPM) Market by Application (Project Planning & Management, Strategic Portfolio Management, Budget & Financial Management, Resource & Capacity Optimization, Reporting & Analytics) - Global Forecast to 2029
The global Project Portfolio Management (PPM) Market is projected to increase from USD 7.8 billion in 2024 to USD 13.7 billion by 2029 at a Compound Annual Growth Rate (CAGR) of 11.9% during the forecast period. Several developments are changing the PPM industry. Companies' increasing focus on digital transformation efforts propels market growth. This trend confirms that it is essential to have advanced PPM solutions for managing complex project portfolios. Enterprises largely depend on PPM solutions to meet maximum resource allocation, gain real-time insights into project performance, and align projects with strategic objectives. The growing acceptance of hybrid workplaces also increases the need for cloud-based PPM, facilitating remote collaboration features that allow teams spread across different geographic sites to work smoothly. This trend has seen a rise in areas of enterprise where inter-site collaboration forms the basis of success, such as manufacturing, construction, and information technology.
PPM's extensive breakthroughs in automation, ML, and AI are powered by innovations and developing technologies in these fields. With AI-driven analytics and predictive algorithms, everything from improved forecasting and risk management to better decision-making across project portfolios is easily accessible. This allows organizations to foresee problems and maximize project outputs while managing resources efficiently. Automation technologies enable project managers to think strategically by automating areas such as data entry and status reporting. Combining PPM solutions with enterprise resource planning and other business applications is expected to enable better data synchronization between all these entities and provide a 360-degree view of the organization's performance. These backroom advancements are expected to drive and revitalize the PPM market, enabling businesses with tools to help redefine how they manage their project portfolios in response to a changing business climate.
To know about the assumptions considered for the study, Request for Free Sample Report
To know about the assumptions considered for the study, download the pdf brochure
Project Portfolio Management Market Dynamics
Driver: Rapid surging demand for advanced PPM tools due to growing project complexities
With the increase in the complexity and variety of projects, organizations are confronted with the challenges of handling multiple tasks, resources, and timelines. The increasing complexity of cross-boundary cooperation is driven by globalization, the prevalence of geographically disbursed virtual teams, and the need to accomplish further by coordinating across divergent functions/silos and different locations. The complexity of these needs mandates that companies use advanced PPM tools with robust planning, execution, and oversight capabilities. These allow project managers to control complex workflows, optimally allocate resources, and mitigate risks. Organizations risk project delays, cost overruns, and quality problems without more purpose-built tools. Therefore, the growing need for advanced PPM solutions capable of managing the complexities of contemporary project management is a key factor driving market expansion.
Restraint: Data security and privacy concerns
Concerns about data confidentiality act as a significant obstacle to implementing PPM solutions. The risk of cyberattacks and data breaches is significant, with concerns focused on unauthorized entry, potential data spills, and the exposure of sensitive project data in PPM systems. Organizations may hesitate to fully adopt PPM solutions due to security threats, especially when dealing with sensitive data.
Another critical issue is the organizations' distrust of PPM vendors regarding their data security practices and storage locations. Organizations have difficulty assessing the risks of implementing specific PPM solutions due to a lack of clear disclosure, hindering their decision-making process. It is difficult to maintain regulatory compliance, especially in regulated industries. These rules demand serious considerations in terms of data privacy (e.g., data residency, secure access controls, and audit trails), which might be challenging to comply with. However, migration to cloud-based PPM solutions brings concerns about data security in the cloud. Organizations are wary of trusting third-party cloud providers with sensitive project data for fear of security flaws and breaches. These data privacy concerns should be resolved before trusting a PPM vendor with sensitive information and making their products compliant for organizations that are concerned with privacy while using or considering using the best project management software solutions.
Opportunity: Adoption of cloud-based solutions
Cloud-based solutions are expected to bring a new wave of opportunity to the PPM market. Cloud PPM tools offer more flexibility, scalability, and cost-effectiveness than traditional on-premises solutions. Hence, firms prefer to use these tools to make their project management systems available across various locations, which in return allows them to collaborate effectively. Moreover, cloud-based PPM solutions are primarily deployed at low initial cost and with up-front investments, as large hardware and software infrastructures do not need to be purchased. This makes them even more desirable for SMEs priced out of on-premises systems. Hence, cloud technology advancements in project management increase adoption, bringing new trends and opportunities to the PPM market as an increasing number of organizations try to exploit these benefits.
Challenge: Ensuring practical user training and adoption
PPM's significant advancements in automation, ML, and AI are driven by cutting-edge innovations and evolving technologies within these areas. AI-powered analysis and predictive algorithms make it simple to access enhanced forecasting, risk management, and improved decision-making within project portfolios. These advancements help predict issues, maximize project results, and make efficient use of resources. In addition, automation technologies enable project managers to concentrate on strategic planning by managing everyday tasks like data entry and status reporting. Moreover, when PPM solutions are integrated with enterprise resource planning and other business applications, they enhance data synchronization, providing a more comprehensive insight into the organization's performance. This progress will continue to propel the PPM industry, enabling businesses to reconfigure the handling of their project portfolios and respond to the evolving business environment.
Project Portfolio Management Market Ecosystem
Based on application, the project planning & management segment is projected to hold the largest market share during the forecast period.
The focus of project planning and management is on effectively coordinating and overseeing project activities, including scheduling, task monitoring, risk mitigation, and documentation. These components are crucial for arranging project timelines, assigning responsibilities, minimizing risks, and maintaining thorough records during the project's timeframe. The solutions offered by PPM assist the companies in enhancing processes, aligning the projects with strategic objectives, and ensuring that all of the projects are completed on time, within scope, and within budget. While project management tools provide a structure for organizations to operate through their resources, progress, and problems of the day, PPM provides defined processes and best practices to ensure projects are done successfully. By featuring all three, PPM solutions further enable organizations to leverage them for optimal performance—this means better decision-making and resource optimization, timely completion of projects, and managing costs and risks.
Based on vertical, the healthcare & life sciences segment is expected to grow at the highest CAGR during the forecast period.
The key target markets would be healthcare and life sciences, proposing solutions for facilities' development in clinical trials and health information technology initiatives. Clinical trials help establish the efficacy of novel treatments and interventions and are essential to medical research. In the facilities and construction domain, development and renovation focus on healthcare infrastructures to enhance and adapt them to dynamic patient needs. Health IT implementation and enhancement initiatives concern IT systems that will significantly enhance operational efficiency within healthcare institutions and, in general, improve patient service. PPM is crucial in both these areas to ensure projects meet the strategic goals, scope resources appropriately, and stay within time limits. PPM increases the ability to make headway in some medical research, upgrade healthcare services, and implement lean IT systems that would result in better patient outcomes and organizational success in the life sciences and healthcare industry.
Based on region, North America is expected to dominate the market during the forecast period.
The demand for effective project management in sectors like IT, healthcare, and finance is driving rapid growth in the US PPM market. Enhanced resource allocation needs, project alignment with organizational goals, and embracing cloud-based PPM solutions are the key drivers of revenue growth. Major companies such as Microsoft, Oracle, and SAP are continuously enhancing their PPM software by integrating artificial intelligence and machine learning capabilities to improve project predictions, mitigate risks, and allocate resources better. Firms like Smartsheet and monday.com have achieved great success by providing straightforward, expandable PPM solutions for small and medium-sized companies. AI in PPM, as investigated by pmo365, is transforming project management by using predictive analytics, automated workflows, and real-time insights to enhance decision-making and productivity.
Government and industry efforts are also strengthening the PPM market. For instance, the US government's Digital Transformation Strategy highlights the importance of using modern project management solutions to enhance the efficiency and transparency of federal IT projects. Regulation changes, like the MGT Act, push federal agencies to invest in advanced PPM tools, promoting improved project supervision and resource management. New advancements in PPM, such as AI-driven platforms and combined cloud options, are transforming project management methods. These innovations are predicted to increase efficiency significantly, simplify project processes, and stimulate overall market expansion by allowing companies to handle intricate project portfolios more efficiently and adjust to changing market needs.
Key Market Players
The PPM market is dominated by a few globally established players such as Oracle (US), Smartsheet (US), Microsoft (US), Asana (US), ServiceNow (US), Planview (US), SAP (Germany), Atlassian (Australia), Wrike (US), Monday.com (Israel), GFT Technologies (Germany), Adobe (US), Workday (US), OpenText (Canda), Hexagon (US), Broadcom (US), Upland Software (US), Sopheon (US), Planisware (US), Planforge (US), among others, are the major vendors that secured PPM contracts in a few recent years. Some of the major factors driving the PPM market are effective tracking and management of projects through advanced scheduling tools and task managing, improved collaboration with centralized dashboards and real-time updates, seamless integration with enterprise systems by means of APIs and software support, cloud-based flexible, scalable platforms, tight security using encryption and access controls, easy to use interfaces, mobile accessibility, powerful analytics, and reporting solutions, multi-project management capabilities reducing operational costs in resource utilization, optimal financial allocation for successful outcomes & compliance with industry standards enforced by audit trails. In addition to the aforementioned features, vendors enhance their market position by innovating around these and similar other capabilities, providing strong customer support and training, and ensuring compatibility with popular enterprise tools and cloud technologies for scalability yet trust security measures for project data.
Want to explore hidden markets that can drive new revenue in Project Portfolio Management (PPM) Market?
Scope of the Report
Want to explore hidden markets that can drive new revenue in Project Portfolio Management (PPM) Market?
Report Metrics |
Details |
Market Size Available For Years |
2019–2029 |
Base Year Considered |
2023 |
Forecast Period |
2024–2029 |
Forecast Units |
Value (USD Million/Billion) |
Segments Covered |
Offering, Application, Business Function, Deployment Mode, Organization Size, Vertical and Region |
Regions Covered |
North America, Europe, Asia Pacific, Middle East & Africa, and Latin America |
Companies Covered |
Oracle (US), Smartsheet (US), Microsoft (US), Asana (US), ServiceNow (US), Planview (US), SAP (Germany), Atlassian (Australia), Wrike (US), Monday.com (Israel), GFT Technologies (Germany), Adobe (US), Workday (US), OpenText (Canda), Hexagon (US), Broadcom (US), Upland Software (US), Sopheon (US), Planisware (US), Planforge (US), Bestoutcome (UK), Celoxis (India), Project Objects (Ireland), Worlotter (US), Ivanti (US), Corporator (US), Cora Systems (US), Teamwork (US), Sciforma (US), Cerri (Switzerland), Keydin (US), Meisterplan (Germany), ITM Platform (UK), Acuity PPM (US), Projectmanager (US), Uniphi (Australia), Proggio (Israel), Assessteam (US), Triskell Software (US), Primetric (Poland), Cplace (Germany), Apptivo (US). |
This research report categorizes the project portfolio management market to forecast revenue and analyze trends in each of the following submarkets:
By Offering:
- Solutions
- Services
- Professional Services
- Managed Services
By Application:
- Project Planning & Management
- Resource & Capacity Optimization
- Budget & Financial Management
- Reporting & Analytics
- Strategic Portfolio Management
- Idea & Demand Management
- Team delivery & Collaboration
By Business Function:
- IT & Software Development
- Operations
- Marketing & Sales
- Human Resources
- Finance & Accounting
- Research & Development
By Deployment:
- On-Premise
- Cloud
By Organization Size:
- Small Enterprises
- Medium Enterprises
- Large Enterprises
By Verticals:
- IT & Telecom
- BFSI
- Government & Defense
- Manufacturing
- Healthcare & Lifescience
- Retail & Consumer Goods
- Transportation & Logistics
- Construction and Heavy Industries
- Automotive
- Other Verticals
By Region:
-
North America
- United States
- Canada
-
Europe
- United Kingdom
- Germany
- France
- Italy
- Switzerland
- Spain
- Netherlands
- Poland
- Belgium
- Rest of Europe
-
Asia Pacific
- China
- India
- Japan
- Australia
- South Korea
- Rest of Asia Pacific
-
Middle East & Africa
- GCC
- South Africa
- Rest of the Middle East & Africa
-
Latin America
- Brazil
- Mexico
- Rest of Latin America
Recent Developments:
- In July 2024, Asana launched features to streamline project management, including AI-generated project creation, goal-setting support, and portfolio summaries. It was expected that users could manage custom fields directly within the project details panel and duplicate forms and sections across projects. Additional updates included data label visibility on charts, improved ID custom field prefixes, and more accessible text highlighting and formatting.
- In May 2024, Smartsheet introduced A1 functionality for real-time data analysis, allowing users to generate charts and metrics by simply querying data. It also introduced Timeline and Board views, enhancing visualization of projects and Agile workflows with autosave and real-time updates. Enhancements in Resource Management were intended to facilitate the seamless process of resourcing data reporting and provide detailed insights on project statuses, improving efficiency at business and enterprise levels.
- In April 2024, Workday acquired HiredScore, an AI-powered talent orchestration solutions provider, enhancing Workday's end-to-end talent acquisition and mobility solutions. This acquisition aimed to help HR leaders leverage responsible AI to efficiently match, rediscover, and coordinate talent, addressing evolving hiring and talent management needs.
- In October 2023, Oracle acquired Next Technik, enhancing NetSuite’s field service management capabilities. This strategic move was expected to integrate Next Technik’s expertise into Oracle’s portfolio, optimizing scheduling, dispatch, and asset management functions to increase productivity and customer satisfaction. Next, Technik’s team intended to operate within Oracle NetSuite.
- In June 2022, Planview acquired Enrich Analytics, now Planview Advisor, enhancing its portfolio with advanced analytics and optimization tools. Enrich, founded in 1998, specialized in scenario planning and risk analysis for R&D teams. The acquisition was expected to integrate Enrich’s expertise into Planview, enabling better portfolio management and decision-making, particularly for life sciences and complex product portfolios.
Frequently Asked Questions (FAQ):
What is project portfolio management?
Project portfolio management is a specific system designed to efficiently manage project activities, resources, and documentation. It offers a centralized platform for approved users to monitor and oversee project tasks, schedules, budgets, and related materials. PPM enables teamwork by enabling several team members to collaborate on projects concurrently, provides version control to guarantee the most recent project files are utilized, and connects with different enterprise software for efficient processes. It also guarantees project data security with encryption and access controls, provides scalability with cloud-based solutions, and presents advanced reporting and analytics features. Ultimately, PPM boosts efficiency and project results in companies by maximizing resource distribution, enhancing transparency, and ensuring coherence with strategic goals.
Which country was the early adopter of PPM solutions?
The US was the earliest adopter of PPM solutions.
Which are the key vendors exploring PPM solutions?
Some of the significant vendors offering PPM solutions across the globe include Oracle (US), Smartsheet (US), Microsoft (US), Asana (US), ServiceNow (US), Planview (US), SAP (Germany), Atlassian (Australia), Wrike (US), Monday.com (Israel), GFT Technologies (Germany), Adobe (US), Workday (US), OpenText (Canda), Hexagon (US), Broadcom (US), Upland Software (US), Sopheon (US), Planisware (US), and Planforge (US).
What is the projected CAGR for the PPM market from 2024 to 2029?
The PPM market is expected to register a CAGR of 11.9% during 2024–2029.
What is the projected market value of the PPM market?
The PPM market will grow from USD 7.8 billion in 2024 to USD 13.7 billion by 2029 at a CAGR of 11.9% during the forecast period.
What are the significant trends in the PPM market?
The current evolution of the PPM market is being influenced by various important trends. Cloud-based options are gaining popularity, offering adaptable storage and remote access capabilities for managing projects from anywhere. Merging AI with machine learning enhances predictive analytics, automates tasks, and optimizes resources, ultimately improving project efficiency and decision-making. The rising requirement for seamless communication and instant updates among spread-out teams is driving the increase in requests for innovative collaboration tools. Compatibility with various enterprise systems and software is necessary for integration and streamlined workflow between different business functions. The growing focus on implementing robust security measures such as encryption and access controls to protect confidential project data is expected to fuel market growth. User-friendly and mobile-compatible interfaces are essential for successful project management across all devices. .
To speak to our analyst for a discussion on the above findings, click Speak to Analyst
Exclusive indicates content/data unique to MarketsandMarkets and not available with any competitors.
- 5.1 INTRODUCTION
-
5.2 MARKET DYNAMICSDRIVERS- Surging demand for advanced PPM tools due to growing project complexities- Need for enhanced return on investment (ROI)- Increasing demand for holistic view of resource management and project operations- Rapidly increasing BYOD trend among organizations- Need for efficient workflow and transparencyRESTRAINTS- High implementation costs- Resistance to change within organizations- Data security and privacy concernsOPPORTUNITIES- Adoption of cloud-based solutions- Rising demand for digital transformation- Adoption of AI-driven tools- Increasing emphasis on sustainability and environmental, social, and governance (ESG) goalsCHALLENGES- Ensuring practical user training and adoption- Customization and integration complexities- Navigating diverse methodologies and practices
-
5.3 CASE STUDY ANALYSISAVEC STREAMLINED TIMESHEET USING PROJECT PORTFOLIO OFFICE'S SOLUTIONLENDLEASE CENTRALIZED DATA USING ORACLE SOLUTIONSPLANVIEW'S CLOUD-NATIVE PLATFORM HELPED COGNIZANT OVERCOME SECURITY BREACH CHALLENGESSAP EPPM HELPED STIHL STREAMLINE QUALITY MANAGEMENT PROCESSES AND IMPROVE PRODUCT QUALITYGEORGIA STATE UNIVERSITY'S PROJECT MANAGEMENT TRANSFORMATION WITH ECLIPSE PPM
- 5.4 ECOSYSTEM ANALYSIS
- 5.5 SUPPLY CHAIN ANALYSIS
-
5.6 TECHNOLOGY ANALYSISKEY TECHNOLOGIES- Cloud computing- AI/ML- Big data analyticsCOMPLEMENTARY TECHNOLOGIES- Collaboration and communication tools- Reporting and visualization tools- Risk and financial toolsADJACENT TECHNOLOGIES- Internet of Things- Blockchain- AR/VR- Process automation
-
5.7 PRICING ANALYSISAVERAGE SELLING PRICE, BY SOLUTION
- 5.8 PATENT ANALYSIS
-
5.9 PORTER'S FIVE FORCES ANALYSISTHREAT OF NEW ENTRANTSTHREAT OF SUBSTITUTESBARGAINING POWER OF BUYERSBARGAINING POWER OF SUPPLIERSINTENSITY OF COMPETITIVE RIVALRY
-
5.10 REGULATORY LANDSCAPEREGULATORY BODIES, GOVERNMENT AGENCIES, AND OTHER ORGANIZATIONSMARKET: REGULATIONS, BY REGION- North America- Europe- Asia Pacific- Middle East & South Africa- Latin AmericaREGULATORY IMPLICATIONS AND INDUSTRY STANDARDS- General Data Protection Regulation- SEC Rule 17a-4- ISO/IEC 27001- System and Organization Controls 2 Type II Compliance- Financial Industry Regulatory Authority- Freedom of Information Act- Health Insurance Portability and Accountability Act
- 5.11 TRENDS AND DISRUPTIONS IMPACTING CUSTOMERS' BUSINESSES
-
5.12 KEY STAKEHOLDERS AND BUYING CRITERIAKEY STAKEHOLDERS IN BUYING PROCESSBUYING CRITERIA
-
5.13 BUSINESS MODEL ANALYSISSUBSCRIPTION-BASED MODELLICENSE-BASED MODELFREEMIUM MODEL
- 5.14 KEY CONFERENCES AND EVENTS, 2024–2025
- 5.15 INVESTMENT AND FUNDING SCENARIO
-
5.16 IMPACT OF AI/GEN AI ON MARKETINDUSTRY TRENDS: USE CASES- IT & ITeS industry- Energy & utilities industryVENDOR INITIATIVES- Broadcom- Planview
-
6.1 INTRODUCTIONOFFERING: MARKET DRIVERS
- 6.2 SOLUTIONS
-
6.3 SERVICESPROFESSIONAL SERVICES- Consulting & advisory- Integration & implementation- Support & maintenance
- 6.4 MANAGED SERVICES
-
7.1 INTRODUCTIONAPPLICATION: MARKET DRIVERS
-
7.2 PROJECT PLANNING & MANAGEMENTPROJECT SCHEDULINGTASK MANAGEMENTPROJECT RISK MANAGEMENTPROJECT DOCUMENTATION
-
7.3 RESOURCE & CAPACITY OPTIMIZATIONRESOURCE MANAGEMENTCAPACITY PLANNINGTIME TRACKINGWORKLOAD BALANCING
-
7.4 BUDGET & FINANCIAL MANAGEMENTFINANCIAL PLANNING & FORECASTINGBUDGET TRACKINGEXPENSE MANAGEMENTBENEFIT REALIZATION
-
7.5 REPORTING & ANALYTICSDASHBOARDS & VISUALIZATIONSKPI TRACKINGDATA ANALYTICS & INSIGHTSCUSTOM REPORTING
-
7.6 STRATEGIC PORTFOLIO MANAGEMENTPORTFOLIO PRIORITIZATIONPORTFOLIO OPTIMIZATIONSTRATEGIC ALIGNMENTGOVERNANCE & COMPLIANCE
-
7.7 IDEA & DEMAND MANAGEMENTIDEA CAPTURE & MANAGEMENTDEMAND INTAKE & PRIORITIZATIONINNOVATION MANAGEMENTFEASIBILITY ASSESSMENT
-
7.8 TEAM DELIVERY & COLLABORATIONCOMMUNICATION & COLLABORATIONAGILE TEAM DELIVERYWORKFLOW MANAGEMENTAGILE INTEGRATION
-
8.1 INTRODUCTIONBUSINESS FUNCTION: MARKET DRIVERS
- 8.2 IT & SOFTWARE DEVELOPMENT
- 8.3 OPERATIONS
- 8.4 MARKETING & SALES
- 8.5 HUMAN RESOURCES
- 8.6 FINANCE & ACCOUNTING
- 8.7 RESEARCH & DEVELOPMENT
-
9.1 INTRODUCTIONDEPLOYMENT MODE: MARKET DRIVERS
- 9.2 ON-PREMISES
- 9.3 CLOUD
-
10.1 INTRODUCTIONORGANIZATION SIZE: MARKET DRIVERS
- 10.2 SMALL ENTERPRISES
- 10.3 MEDIUM ENTERPRISES
- 10.4 LARGE ENTERPRISES
-
11.1 INTRODUCTIONVERTICAL: MARKET DRIVERS
-
11.2 IT & TELECOMIT & TELECOM: USE CASES- Software development & delivery- Telcom projects- IT service management
-
11.3 BFSIBFSI: USE CASES- Regulatory compliance projects- Core systems upgrade- Risk management
-
11.4 GOVERNMENT & DEFENSEGOVERNMENT & DEFENSE: USE CASES- Public infrastructure projects- Defense procurement- Infrastructure modernization- Military weapons and equipment development- Military training
-
11.5 MANUFACTURINGMANUFACTURING: USE CASES- Supply chain management- Product development- Product line optimization
-
11.6 HEALTHCARE & LIFE SCIENCESHEALTHCARE & LIFE SCIENCES: USE CASES- Clinical trials- Facility construction & renovation- Health IT projects
-
11.7 ENERGY & UTILITIESENERGY & UTILITIES: USE CASES- Renewable energy projects- Energy infrastructure projects- Maintenance & operations
-
11.8 RETAIL & CONSUMER GOODSRETAIL & CONSUMER GOODS: USE CASES- Product development & innovation- Store operations- Customer experience enhancement
-
11.9 TRANSPORTATION & LOGISTICSTRANSPORTATION &LOGISTICS: USE CASES- Fleet management- Logistics optimization- Technology integration projects
-
11.10 CONSTRUCTION & HEAVY INDUSTRIESCONSTRUCTION & HEAVY INDUSTRIES: USE CASES- Design & engineering- Equipment & machinery procurement- Quality & compliance
-
11.11 AUTOMOTIVEAUTOMOTIVE: USE CASES- Product development & innovation- Production optimization- Technology & IT integration
- 11.12 OTHER VERTICALS
- 12.1 INTRODUCTION
-
12.2 NORTH AMERICANORTH AMERICA: MARKET DRIVERSNORTH AMERICA: MACROECONOMIC OUTLOOKUS- Increasing need for improved resource management and aligning projects with organizational objectives to drive marketCANADA- Focus on implementing innovative cloud-based solutions and AI-powered analytics to boost market
-
12.3 EUROPEEUROPE: PROJECT PORTFOLIO MANAGEMENT MARKET DRIVERSEUROPE: MACROECONOMIC OUTLOOKUK- Changes in regulations post-Brexit to impact market growthGERMANY- Increasing demand for advanced project portfolio management solutions that can handle complex data projects to foster market growthFRANCE- Rising need for simplification of intricate project processes and improvement of resource distribution to drive marketITALY- Local economic conditions and regulatory frameworks that encourage implementation to bolster market growthSWITZERLAND- Strong industry adoption and advanced data security practices to foster market growthSPAIN- Surging demand for leveraging PPM solutions and commitment to digital transformation to drive marketNETHERLANDS- Steady economy and supportive government policies to support market growthPOLAND- Progressive economy and substantial digital infrastructure investments to expand marketBELGIUM- Economic stability to create favorable environment for adoption of project portfolio management solutionsREST OF EUROPE
-
12.4 ASIA PACIFICASIA PACIFIC: PROJECT PORTFOLIO MANAGEMENT MARKET DRIVERSASIA PACIFIC: MACROECONOMIC OUTLOOKCHINA- Digital transformation initiatives in various industries to boost marketINDIA- Rising popularity of cloud-based platforms and thriving IT services sector to propel market growthJAPAN- Fusion of IoT and automation in project portfolio management procedures to support market’s growth trajectorySINGAPORE- Surging demand for improved project productivity and alignment with strategic goals to fuel market growthAUSTRALIA- Sophisticated digital infrastructure and regulatory frameworks promoting innovation to enhance market growthSOUTH KOREA- Promotion of smart city projects and enhancement of digital infrastructure to boost marketREST OF ASIA PACIFIC
-
12.5 MIDDLE EAST & AFRICAMIDDLE EAST & AFRICA: PROJECT PORTFOLIO MANAGEMENT MARKET DRIVERSMIDDLE EAST & AFRICA: MACROECONOMIC OUTLOOKGULF COOPERATION COUNCIL (GCC)- Saudi Arabia- UAE- REST OF GCC COUNTRIESSOUTH AFRICA- Local economic conditions and emerging regulatory frameworks to drive marketREST OF MIDDLE EAST & AFRICA
-
12.6 LATIN AMERICALATIN AMERICA: PROJECT PORTFOLIO MANAGEMENT MARKET DRIVERSLATIN AMERICA: MACROECONOMIC OUTLOOKBRAZIL- High adoption of cloud services by startups to drive market growthMEXICO- Rise in digital transformation efforts and incorporation of artificial intelligence into project management software to foster market growthREST OF LATIN AMERICA
- 13.1 INTRODUCTION
- 13.2 KEY PLAYER STRATEGIES/RIGHT TO WIN
- 13.3 MARKET SHARE ANALYSIS
- 13.4 PROJECT PORTFOLIO MANAGEMENT MARKET: VENDOR PRODUCTS/BRANDS COMPARISON
- 13.5 REVENUE ANALYSIS
-
13.6 COMPANY EVALUATION MATRIX: KEY PLAYERS, 2023STARSEMERGING LEADERSPERVASIVE PLAYERSPARTICIPANTSCOMPANY FOOTPRINT: KEY PLAYERS, 2023
-
13.7 COMPANY EVALUATION MATRIX: STARTUPS/SMES, 2023PROGRESSIVE COMPANIESRESPONSIVE COMPANIESDYNAMIC COMPANIESSTARTING BLOCKSCOMPETITIVE BENCHMARKING: STARTUP/SMES, 2023- Detailed list of key startups/SMEs- Competitive benchmarking of startups/SMEs
- 13.8 COMPANY VALUATION AND FINANCIAL METRICS OF KEY VENDORS
-
13.9 COMPETITIVE SCENARIO AND TRENDSPRODUCT LAUNCHESDEALS
- 14.1 INTRODUCTION
-
14.2 MAJOR PLAYERSORACLE- Business overview- Products/Solutions/Services offered- Recent developments- MnM viewSMARTSHEET- Business overview- Products/Solutions/Services offered- Recent developments- MnM viewMICROSOFT- Business overview- Products/Solutions/Services offered- Recent developments- MnM viewASANA- Business overview- Products/Solutions/Services offered- Recent developments- MnM viewSERVICENOW- Business overview- Products/Solutions/Services offered- Recent developments- MnM viewPLANVIEW- Business overview- Products/Solutions/Services offered- Recent developments- MnM viewSAP- Business overview- Products/Solutions/Services offered- Recent developmentsATLASSIAN- Business overview- Products/Solutions/Services offered- Recent developments- MnM viewADOBE- Business overview- Products/Solutions/Services offered- Recent developmentsWORKDAY- Business overview- Products/Solutions/Services offered- Recent developmentsGFT TECHNOLOGIES- Business overview- Products/Solutions/Services offered- Recent developmentsWRIKE- Business overview- Products/Solutions/Services offered- Recent developmentsMONDAY.COM- Business overview- Products/Solutions/Services offered- Recent developmentsOPENTEXT- Business overview- Products/Solutions/Services offered- Recent developmentsHEXAGONBROADCOMUPLAND SOFTWARESOPHEONPLANISWAREPLANFORGEBESTOUTCOMECELOXISCERRISCIFORMAPROJECT OBJECTSWORKOTTERIVANTICORPORATERCORA SYSTEMSTEAMWORK
-
14.3 OTHER PLAYERSKEYEDIN PROJECTSMEISTERPLANITM PLATFORMACUITY PPMPROJECTMANAGERUNIPHIPROGGIOASSESSTEAMTRISKELL SOFTWAREPRIMETRICCPLACEAPPTIVO
- 15.1 INTRODUCTION
-
15.2 RELATED MARKETSAI IN PROJECT MANAGEMENT MARKETENTERPRISE PERFORMANCE MANAGEMENT MARKET
- 16.1 DISCUSSION GUIDE
- 16.2 KNOWLEDGESTORE: MARKETSANDMARKETS’ SUBSCRIPTION PORTAL
- 16.3 CUSTOMIZATION OPTIONS
- 16.4 RELATED REPORTS
- 16.5 AUTHOR DETAILS
- TABLE 1 USD EXCHANGE RATES, 2018–2023
- TABLE 2 FACTOR ANALYSIS
- TABLE 3 INDICATIVE PRICING ANALYSIS, BY SOLUTION
- TABLE 4 TOP 10 PATENT APPLICANTS (US), 2013–2023
- TABLE 5 PROJECT PORTFOLIO MANAGEMENT MARKET: PORTER'S FIVE FORCES ANALYSIS
- TABLE 6 NORTH AMERICA: REGULATORY BODIES, GOVERNMENT AGENCIES, AND OTHER ORGANIZATIONS
- TABLE 7 EUROPE: REGULATORY BODIES, GOVERNMENT AGENCIES, AND OTHER ORGANIZATIONS
- TABLE 8 ASIA PACIFIC: REGULATORY BODIES, GOVERNMENT AGENCIES, AND OTHER ORGANIZATIONS
- TABLE 9 ROW: REGULATORY BODIES, GOVERNMENT AGENCIES, AND OTHER ORGANIZATIONS
- TABLE 10 INFLUENCE OF STAKEHOLDERS ON BUYING PROCESS FOR KEY VERTICALS (%)
- TABLE 11 KEY BUYING CRITERIA FOR TOP THREE BUSINESS FUNCTIONS
- TABLE 12 PROJECT PORTFOLIO MANAGEMENT MARKET: LIST OF KEY CONFERENCES AND EVENTS, 2024–2025
- TABLE 13 MARKET, BY OFFERING, 2019–2023 (USD MILLION)
- TABLE 14 MARKET, BY OFFERING, 2024–2029 (USD MILLION)
- TABLE 15 SOLUTIONS: MARKET, BY REGION, 2019–2023 (USD MILLION)
- TABLE 16 SOLUTIONS: MARKET, BY REGION, 2024–2029 (USD MILLION)
- TABLE 17 MARKET, BY SERVICE, 2019–2023 (USD MILLION)
- TABLE 18 MARKET, BY SERVICE, 2024–2029 (USD MILLION)
- TABLE 19 PROFESSIONAL SERVICES: MARKET, BY REGION, 2019–2023 (USD MILLION)
- TABLE 20 PROFESSIONAL SERVICES: MARKET, BY REGION, 2024–2029 (USD MILLION)
- TABLE 21 MANAGED SERVICES: PROJECT PORTFOLIO MANAGEMENT MARKET, BY REGION, 2019–2023 (USD MILLION)
- TABLE 22 MANAGED SERVICES: MARKET, BY REGION, 2024–2029 (USD MILLION)
- TABLE 23 MARKET, BY APPLICATION, 2019–2023 (USD MILLION)
- TABLE 24 MARKET, BY APPLICATION, 2024–2029 (USD MILLION)
- TABLE 25 PROJECT PLANNING & MANAGEMENT: MARKET, BY REGION, 2019–2023 (USD MILLION)
- TABLE 26 PROJECT PLANNING & MANAGEMENT: MARKET, BY REGION, 2024–2029 (USD MILLION)
- TABLE 27 RESOURCE & CAPACITY OPTIMIZATION: MARKET, BY REGION, 2019–2023 (USD MILLION)
- TABLE 28 RESOURCE & CAPACITY OPTIMIZATION: MARKET, BY REGION, 2024–2029 (USD MILLION)
- TABLE 29 BUDGET & FINANCIAL MANAGEMENT: MARKET, BY REGION, 2019–2023 (USD MILLION)
- TABLE 30 BUDGET & FINANCIAL MANAGEMENT: MARKET, BY REGION, 2024–2029 (USD MILLION)
- TABLE 31 REPORTING & ANALYTICS: MARKET, BY REGION, 2019–2023 (USD MILLION)
- TABLE 32 REPORTING & ANALYTICS: MARKET, BY REGION, 2024–2029 (USD MILLION)
- TABLE 33 STRATEGIC PORTFOLIO MANAGEMENT: MARKET, BY REGION, 2019–2023 (USD MILLION)
- TABLE 34 STRATEGIC PORTFOLIO MANAGEMENT: MARKET, BY REGION, 2024–2029 (USD MILLION)
- TABLE 35 IDEA & DEMAND MANAGEMENT: MARKET, BY REGION, 2019–2023 (USD MILLION)
- TABLE 36 IDEA & DEMAND MANAGEMENT: MARKET, BY REGION, 2024–2029 (USD MILLION)
- TABLE 37 TEAM DELIVERY & COLLABORATION: PROJECT PORTFOLIO MANAGEMENT MARKET, BY REGION, 2019–2023 (USD MILLION)
- TABLE 38 TEAM DELIVERY & COLLABORATION: MARKET, BY REGION, 2024–2029 (USD MILLION)
- TABLE 39 MARKET, BY BUSINESS FUNCTION, 2019–2023 (USD MILLION)
- TABLE 40 MARKET, BY BUSINESS FUNCTION, 2024–2029 (USD MILLION)
- TABLE 41 IT & SOFTWARE DEVELOPMENT: MARKET, BY REGION, 2019–2023 (USD MILLION)
- TABLE 42 IT & SOFTWARE DEVELOPMENT: MARKET, BY REGION, 2024–2029 (USD MILLION)
- TABLE 43 OPERATIONS: MARKET, BY REGION, 2019–2023 (USD MILLION)
- TABLE 44 OPERATIONS: MARKET, BY REGION, 2024–2029 (USD MILLION)
- TABLE 45 MARKETING & SALES: MARKET, BY REGION, 2019–2023 (USD MILLION)
- TABLE 46 MARKETING & SALES: MARKET, BY REGION, 2024–2029 (USD MILLION)
- TABLE 47 HUMAN RESOURCES: MARKET, BY REGION, 2019–2023 (USD MILLION)
- TABLE 48 HUMAN RESOURCES: MARKET, BY REGION, 2024–2029 (USD MILLION)
- TABLE 49 FINANCE & ACCOUNTING: MARKET, BY REGION, 2019–2023 (USD MILLION)
- TABLE 50 FINANCE & ACCOUNTING: MARKET, BY REGION, 2024–2029 (USD MILLION)
- TABLE 51 RESEARCH & DEVELOPMENT: MARKET, BY REGION, 2019–2023 (USD MILLION)
- TABLE 52 RESEARCH & DEVELOPMENT: MARKET, BY REGION, 2024–2029 (USD MILLION)
- TABLE 53 MARKET, BY DEPLOYMENT MODE, 2019–2023 (USD MILLION)
- TABLE 54 MARKET, BY DEPLOYMENT MODE, 2024–2029 (USD MILLION)
- TABLE 55 ON-PREMISES: PROJECT PORTFOLIO MANAGEMENT MARKET, BY REGION, 2019–2023 (USD MILLION)
- TABLE 56 ON-PREMISES: MARKET, BY REGION, 2024–2029 (USD MILLION)
- TABLE 57 CLOUD: MARKET, BY REGION, 2019–2023 (USD MILLION)
- TABLE 58 CLOUD: MARKET, BY REGION, 2024–2029 (USD MILLION)
- TABLE 59 MARKET, BY ORGANIZATION SIZE, 2019–2023 (USD MILLION)
- TABLE 60 MARKET, BY ORGANIZATION SIZE, 2024–2029 (USD MILLION)
- TABLE 61 SMALL ENTERPRISES: MARKET, BY REGION, 2019–2023 (USD MILLION)
- TABLE 62 SMALL ENTERPRISES: MARKET, BY REGION, 2024–2029 (USD MILLION)
- TABLE 63 MEDIUM ENTERPRISES: MARKET, BY REGION, 2019–2023 (USD MILLION)
- TABLE 64 MEDIUM ENTERPRISES: MARKET, BY REGION, 2024–2029 (USD MILLION)
- TABLE 65 LARGE ENTERPRISES: MARKET, BY REGION, 2019–2023 (USD MILLION)
- TABLE 66 LARGE ENTERPRISES: MARKET, BY REGION, 2024–2029 (USD MILLION)
- TABLE 67 MARKET, BY VERTICAL, 2019–2023 (USD MILLION)
- TABLE 68 MARKET, BY VERTICAL, 2024–2029 (USD MILLION)
- TABLE 69 IT & TELECOM: MARKET, BY REGION, 2019–2023 (USD MILLION)
- TABLE 70 IT & TELECOM: MARKET, BY REGION, 2024–2029 (USD MILLION)
- TABLE 71 BFSI: MARKET, BY REGION, 2019–2023 (USD MILLION)
- TABLE 72 BFSI: MARKET, BY REGION, 2024–2029 (USD MILLION)
- TABLE 73 GOVERNMENT & DEFENSE: MARKET, BY REGION, 2019–2023 (USD MILLION)
- TABLE 74 GOVERNMENT & DEFENSE: MARKET, BY REGION, 2024–2029 (USD MILLION)
- TABLE 75 MANUFACTURING: PROJECT PORTFOLIO MANAGEMENT MARKET, BY REGION, 2019–2023 (USD MILLION)
- TABLE 76 MANUFACTURING: MARKET, BY REGION, 2024–2029 (USD MILLION)
- TABLE 77 HEALTHCARE & LIFE SCIENCES: MARKET, BY REGION, 2019–2023 (USD MILLION)
- TABLE 78 HEALTHCARE & LIFE SCIENCES: MARKET, BY REGION, 2024–2029 (USD MILLION)
- TABLE 79 ENERGY & UTILITIES: MARKET, BY REGION, 2019–2023 (USD MILLION)
- TABLE 80 ENERGY & UTILITIES: MARKET, BY REGION, 2024–2029 (USD MILLION)
- TABLE 81 RETAIL & CONSUMER GOODS: MARKET, BY REGION, 2019–2023 (USD MILLION)
- TABLE 82 RETAIL & CONSUMER GOODS: MARKET, BY REGION, 2024–2029 (USD MILLION)
- TABLE 83 TRANSPORTATION & LOGISTICS: MARKET, BY REGION, 2019–2023 (USD MILLION)
- TABLE 84 TRANSPORTATION & LOGISTICS: MARKET, BY REGION, 2024–2029 (USD MILLION)
- TABLE 85 CONSTRUCTION & HEAVY INDUSTRIES: MARKET, BY REGION, 2019–2023 (USD MILLION)
- TABLE 86 CONSTRUCTION & HEAVY INDUSTRIES: MARKET, BY REGION, 2024–2029 (USD MILLION)
- TABLE 87 AUTOMOTIVE: MARKET, BY REGION, 2019–2023 (USD MILLION)
- TABLE 88 AUTOMOTIVE: MARKET, BY REGION, 2024–2029 (USD MILLION)
- TABLE 89 OTHER VERTICALS: MARKET, BY REGION, 2019–2023 (USD MILLION)
- TABLE 90 OTHER VERTICALS: MARKET, BY REGION, 2024–2029 (USD MILLION)
- TABLE 91 MARKET, BY REGION, 2019–2023 (USD MILLION)
- TABLE 92 MARKET, BY REGION, 2024–2029 (USD MILLION)
- TABLE 93 NORTH AMERICA: PROJECT PORTFOLIO MANAGEMENT MARKET, BY OFFERING, 2019–2023 (USD MILLION)
- TABLE 94 NORTH AMERICA: MARKET, BY OFFERING, 2024–2029 (USD MILLION)
- TABLE 95 NORTH AMERICA: MARKET, BY SERVICE, 2019–2023 (USD MILLION)
- TABLE 96 NORTH AMERICA: MARKET, BY SERVICE, 2024–2029 (USD MILLION)
- TABLE 97 NORTH AMERICA: MARKET, BY APPLICATION, 2019–2023 (USD MILLION)
- TABLE 98 NORTH AMERICA: MARKET, BY APPLICATION, 2024–2029 (USD MILLION)
- TABLE 99 NORTH AMERICA: MARKET, BY BUSINESS FUNCTION, 2019–2023 (USD MILLION)
- TABLE 100 NORTH AMERICA: MARKET, BY BUSINESS FUNCTION, 2024–2029 (USD MILLION)
- TABLE 101 NORTH AMERICA: MARKET, BY DEPLOYMENT MODE, 2019–2023 (USD MILLION)
- TABLE 102 NORTH AMERICA: MARKET, BY DEPLOYMENT MODE, 2024–2029 (USD MILLION)
- TABLE 103 NORTH AMERICA: MARKET, BY ORGANIZATION SIZE, 2019–2023 (USD MILLION)
- TABLE 104 NORTH AMERICA: MARKET, BY ORGANIZATION SIZE, 2024–2029 (USD MILLION)
- TABLE 105 NORTH AMERICA: MARKET, BY VERTICAL, 2019–2023 (USD MILLION)
- TABLE 106 NORTH AMERICA: MARKET, BY VERTICAL, 2024–2029 (USD MILLION)
- TABLE 107 NORTH AMERICA: MARKET, BY COUNTRY, 2019–2023 (USD MILLION)
- TABLE 108 NORTH AMERICA: MARKET, BY COUNTRY, 2024–2029 (USD MILLION)
- TABLE 109 US: MARKET, BY OFFERING, 2019–2023 (USD MILLION)
- TABLE 110 US: MARKET, BY OFFERING, 2024–2029 (USD MILLION)
- TABLE 111 US: MARKET, BY SERVICE, 2019–2023 (USD MILLION)
- TABLE 112 US: MARKET, BY SERVICE, 2024–2029 (USD MILLION)
- TABLE 113 CANADA: PROJECT PORTFOLIO MANAGEMENT MARKET, BY OFFERING, 2019–2023 (USD MILLION)
- TABLE 114 CANADA: MARKET, BY OFFERING, 2024–2029 (USD MILLION)
- TABLE 115 CANADA: MARKET, BY SERVICE, 2019–2023 (USD MILLION)
- TABLE 116 CANADA: MARKET, BY SERVICE, 2024–2029 (USD MILLION)
- TABLE 117 EUROPE: MARKET, BY OFFERING, 2019–2023 (USD MILLION)
- TABLE 118 EUROPE: MARKET, BY OFFERING, 2024–2029 (USD MILLION)
- TABLE 119 EUROPE: MARKET, BY SERVICE, 2019–2023 (USD MILLION)
- TABLE 120 EUROPE: MARKET, BY SERVICE, 2024–2029 (USD MILLION)
- TABLE 121 EUROPE: MARKET, BY APPLICATION, 2019–2023 (USD MILLION)
- TABLE 122 EUROPE: MARKET, BY APPLICATION, 2024–2029 (USD MILLION)
- TABLE 123 EUROPE: MARKET, BY BUSINESS FUNCTION, 2019–2023 (USD MILLION)
- TABLE 124 EUROPE: MARKET, BY BUSINESS FUNCTION, 2024–2029 (USD MILLION)
- TABLE 125 EUROPE: MARKET, BY DEPLOYMENT MODE, 2019–2023 (USD MILLION)
- TABLE 126 EUROPE: MARKET, BY DEPLOYMENT MODE, 2024–2029 (USD MILLION)
- TABLE 127 EUROPE: PROJECT PORTFOLIO MANAGEMENT MARKET, BY ORGANIZATION SIZE, 2019–2023 (USD MILLION)
- TABLE 128 EUROPE: TRAINING, MARKET, BY ORGANIZATION SIZE, 2024–2029 (USD MILLION)
- TABLE 129 EUROPE: MARKET, BY VERTICAL, 2019–2023 (USD MILLION)
- TABLE 130 EUROPE: MARKET, BY VERTICAL, 2024–2029 (USD MILLION)
- TABLE 131 EUROPE: MARKET, BY COUNTRY, 2019–2023 (USD MILLION)
- TABLE 132 EUROPE: MARKET, BY COUNTRY, 2024–2029 (USD MILLION)
- TABLE 133 UK: MARKET, BY OFFERING, 2019–2023 (USD MILLION)
- TABLE 134 UK: MARKET, BY OFFERING, 2024–2029 (USD MILLION)
- TABLE 135 UK: MARKET, BY SERVICE, 2019–2023 (USD MILLION)
- TABLE 136 UK: MARKET, BY SERVICE, 2024–2029 (USD MILLION)
- TABLE 137 GERMANY: MARKET, BY OFFERING, 2019–2023 (USD MILLION)
- TABLE 138 GERMANY: MARKET, BY OFFERING, 2024–2029 (USD MILLION)
- TABLE 139 GERMANY: MARKET, BY SERVICE, 2019–2023 (USD MILLION)
- TABLE 140 GERMANY: MARKET, BY SERVICE, 2024–2029 (USD MILLION)
- TABLE 141 FRANCE: PROJECT PORTFOLIO MANAGEMENT MARKET, BY OFFERING, 2019–2023 (USD MILLION)
- TABLE 142 FRANCE: MARKET, BY OFFERING, 2024–2029 (USD MILLION)
- TABLE 143 FRANCE: MARKET, BY SERVICE, 2019–2023 (USD MILLION)
- TABLE 144 FRANCE: MARKET, BY SERVICE, 2024–2029 (USD MILLION)
- TABLE 145 ITALY: MARKET, BY OFFERING, 2019–2023 (USD MILLION)
- TABLE 146 ITALY: MARKET, BY OFFERING, 2024–2029 (USD MILLION)
- TABLE 147 ITALY: MARKET, BY SERVICE, 2019–2023 (USD MILLION)
- TABLE 148 ITALY: MARKET, BY SERVICE, 2024–2029 (USD MILLION)
- TABLE 149 SWITZERLAND: MARKET, BY OFFERING, 2019–2023 (USD MILLION)
- TABLE 150 SWITZERLAND: MARKET, BY OFFERING, 2024–2029 (USD MILLION)
- TABLE 151 SWITZERLAND: MARKET, BY SERVICE, 2019–2023 (USD MILLION)
- TABLE 152 SWITZERLAND: MARKET, BY SERVICE, 2024–2029 (USD MILLION)
- TABLE 153 SPAIN: MARKET, BY OFFERING, 2019–2023 (USD MILLION)
- TABLE 154 SPAIN: MARKET, BY OFFERING, 2024–2029 (USD MILLION)
- TABLE 155 SPAIN: MARKET, BY SERVICE, 2019–2023 (USD MILLION)
- TABLE 156 SPAIN: MARKET, BY SERVICE, 2024–2029 (USD MILLION)
- TABLE 157 NETHERLANDS: PROJECT PORTFOLIO MANAGEMENT MARKET, BY OFFERING, 2019–2023 (USD MILLION)
- TABLE 158 NETHERLANDS: MARKET, BY OFFERING, 2024–2029 (USD MILLION)
- TABLE 159 NETHERLANDS: MARKET, BY SERVICE, 2019–2023 (USD MILLION)
- TABLE 160 NETHERLANDS: MARKET, BY SERVICE, 2024–2029 (USD MILLION)
- TABLE 161 POLAND: MARKET, BY OFFERING, 2019–2023 (USD MILLION)
- TABLE 162 POLAND: MARKET, BY OFFERING, 2024–2029 (USD MILLION)
- TABLE 163 POLAND: MARKET, BY SERVICE, 2019–2023 (USD MILLION)
- TABLE 164 POLAND: MARKET, BY SERVICE, 2024–2029 (USD MILLION)
- TABLE 165 BELGIUM: MARKET, BY OFFERING, 2019–2023 (USD MILLION)
- TABLE 166 BELGIUM: MARKET, BY OFFERING, 2024–2029 (USD MILLION)
- TABLE 167 BELGIUM: MARKET, BY SERVICE, 2019–2023 (USD MILLION)
- TABLE 168 BELGIUM: MARKET, BY SERVICE, 2024–2029 (USD MILLION)
- TABLE 169 REST OF EUROPE: MARKET, BY OFFERING, 2019–2023 (USD MILLION)
- TABLE 170 REST OF EUROPE: MARKET, BY OFFERING, 2024–2029 (USD MILLION)
- TABLE 171 REST OF EUROPE: MARKET, BY SERVICE, 2019–2023 (USD MILLION)
- TABLE 172 REST OF EUROPE: MARKET, BY SERVICE, 2024–2029 (USD MILLION)
- TABLE 173 ASIA PACIFIC: PROJECT PORTFOLIO MANAGEMENT MARKET, BY OFFERING, 2019–2023 (USD MILLION)
- TABLE 174 ASIA PACIFIC: MARKET, BY OFFERING, 2024–2029 (USD MILLION)
- TABLE 175 ASIA PACIFIC: MARKET, BY SERVICE, 2019–2023 (USD MILLION)
- TABLE 176 ASIA PACIFIC: MARKET, BY SERVICE, 2024–2029 (USD MILLION)
- TABLE 177 ASIA PACIFIC: MARKET, BY APPLICATION, 2019–2023 (USD MILLION)
- TABLE 178 ASIA PACIFIC: MARKET, BY APPLICATION, 2024–2029 (USD MILLION)
- TABLE 179 ASIA PACIFIC: MARKET, BY BUSINESS FUNCTION, 2019–2023 (USD MILLION)
- TABLE 180 ASIA PACIFIC: MARKET, BY BUSINESS FUNCTION, 2024–2029 (USD MILLION)
- TABLE 181 ASIA PACIFIC: MARKET, BY DEPLOYMENT MODE, 2019–2023 (USD MILLION)
- TABLE 182 ASIA PACIFIC: MARKET, BY DEPLOYMENT MODE, 2024–2029 (USD MILLION)
- TABLE 183 ASIA PACIFIC: MARKET, BY ORGANIZATION SIZE, 2019–2023 (USD MILLION)
- TABLE 184 ASIA PACIFIC: TRAINING, MARKET, BY ORGANIZATION SIZE, 2024–2029 (USD MILLION)
- TABLE 185 ASIA PACIFIC: MARKET, BY VERTICAL, 2019–2023 (USD MILLION)
- TABLE 186 ASIA PACIFIC: MARKET, BY VERTICAL, 2024–2029 (USD MILLION)
- TABLE 187 ASIA PACIFIC: MARKET, BY COUNTRY, 2019–2023 (USD MILLION)
- TABLE 188 ASIA PACIFIC: MARKET, BY COUNTRY, 2024–2029 (USD MILLION)
- TABLE 189 CHINA: PROJECT PORTFOLIO MANAGEMENT MARKET, BY OFFERING, 2019–2023 (USD MILLION)
- TABLE 190 CHINA: MARKET, BY OFFERING, 2024–2029 (USD MILLION)
- TABLE 191 CHINA: MARKET, BY SERVICE, 2019–2023 (USD MILLION)
- TABLE 192 CHINA: MARKET, BY SERVICE, 2024–2029 (USD MILLION)
- TABLE 193 INDIA: MARKET, BY OFFERING, 2019–2023 (USD MILLION)
- TABLE 194 INDIA: MARKET, BY OFFERING, 2024–2029 (USD MILLION)
- TABLE 195 INDIA: MARKET, BY SERVICE, 2019–2023 (USD MILLION)
- TABLE 196 INDIA: MARKET, BY SERVICE, 2024–2029 (USD MILLION)
- TABLE 197 JAPAN: MARKET, BY OFFERING, 2019–2023 (USD MILLION)
- TABLE 198 JAPAN: MARKET, BY OFFERING, 2024–2029 (USD MILLION)
- TABLE 199 JAPAN: MARKET, BY SERVICE, 2019–2023 (USD MILLION)
- TABLE 200 JAPAN: MARKET, BY SERVICE, 2024–2029 (USD MILLION)
- TABLE 201 SINGAPORE: PROJECT PORTFOLIO MANAGEMENT MARKET, BY OFFERING, 2019–2023 (USD MILLION)
- TABLE 202 SINGAPORE: MARKET, BY OFFERING, 2024–2029 (USD MILLION)
- TABLE 203 SINGAPORE: MARKET, BY SERVICE, 2019–2023 (USD MILLION)
- TABLE 204 SINGAPORE: MARKET, BY SERVICE, 2024–2029 (USD MILLION)
- TABLE 205 AUSTRALIA: MARKET, BY OFFERING, 2019–2023 (USD MILLION)
- TABLE 206 AUSTRALIA: MARKET, BY OFFERING, 2024–2029 (USD MILLION)
- TABLE 207 AUSTRALIA: MARKET, BY SERVICE, 2019–2023 (USD MILLION)
- TABLE 208 AUSTRALIA: MARKET, BY SERVICE, 2024–2029 (USD MILLION)
- TABLE 209 SOUTH KOREA: MARKET, BY OFFERING, 2019–2023 (USD MILLION)
- TABLE 210 SOUTH KOREA: MARKET, BY OFFERING, 2024–2029 (USD MILLION)
- TABLE 211 SOUTH KOREA: MARKET, BY SERVICE, 2019–2023 (USD MILLION)
- TABLE 212 SOUTH KOREA: MARKET, BY SERVICE, 2024–2029 (USD MILLION)
- TABLE 213 REST OF ASIA PACIFIC: MARKET, BY OFFERING, 2019–2023 (USD MILLION)
- TABLE 214 REST OF ASIA PACIFIC: MARKET, BY OFFERING, 2024–2029 (USD MILLION)
- TABLE 215 REST OF ASIA PACIFIC: MARKET, BY SERVICE, 2019–2023 (USD MILLION)
- TABLE 216 REST OF ASIA PACIFIC: MARKET, BY SERVICE, 2024–2029 (USD MILLION)
- TABLE 217 MIDDLE EAST & AFRICA: PROJECT PORTFOLIO MANAGEMENT MARKET, BY OFFERING, 2019–2023 (USD MILLION)
- TABLE 218 MIDDLE EAST & AFRICA: MARKET, BY OFFERING, 2024–2029 (USD MILLION)
- TABLE 219 MIDDLE EAST & AFRICA: MARKET, BY SERVICE, 2019–2023 (USD MILLION)
- TABLE 220 MIDDLE EAST & AFRICA: MARKET, BY SERVICE, 2024–2029 (USD MILLION)
- TABLE 221 MIDDLE EAST & AFRICA: MARKET, BY APPLICATION, 2019–2023 (USD MILLION)
- TABLE 222 MIDDLE EAST & AFRICA: MARKET, BY APPLICATION, 2024–2029 (USD MILLION)
- TABLE 223 MIDDLE EAST & AFRICA: MARKET, BY BUSINESS FUNCTION, 2019–2023 (USD MILLION)
- TABLE 224 MIDDLE EAST & AFRICA: MARKET, BY BUSINESS FUNCTION, 2024–2029 (USD MILLION)
- TABLE 225 MIDDLE EAST & AFRICA: MARKET, BY DEPLOYMENT MODE, 2019–2023 (USD MILLION)
- TABLE 226 MIDDLE EAST & AFRICA: MARKET, BY DEPLOYMENT MODE, 2024–2029 (USD MILLION)
- TABLE 227 MIDDLE EAST & AFRICA: MARKET, BY ORGANIZATION SIZE, 2019–2023 (USD MILLION)
- TABLE 228 MIDDLE EAST & AFRICA: MARKET, BY ORGANIZATION SIZE, 2024–2029 (USD MILLION)
- TABLE 229 MIDDLE EAST & AFRICA: MARKET, BY VERTICAL, 2019–2023 (USD MILLION)
- TABLE 230 MIDDLE EAST & AFRICA: MARKET, BY VERTICAL, 2024–2029 (USD MILLION)
- TABLE 231 MIDDLE EAST & AFRICA: MARKET, BY COUNTRY, 2019–2023 (USD MILLION)
- TABLE 232 MIDDLE EAST & AFRICA: MARKET, BY COUNTRY, 2024–2029 (USD MILLION)
- TABLE 233 GCC: MARKET, BY OFFERING, 2019–2023 (USD MILLION)
- TABLE 234 GCC: MARKET, BY OFFERING, 2024–2029 (USD MILLION)
- TABLE 235 GCC: MARKET, BY SERVICE, 2019–2023 (USD MILLION)
- TABLE 236 GCC: MARKET, BY SERVICE, 2024–2029 (USD MILLION)
- TABLE 237 REST OF GCC: PROJECT PORTFOLIO MANAGEMENT MARKET, BY COUNTRY, 2019–2023 (USD MILLION)
- TABLE 238 REST OF GCC: MARKET, BY COUNTRY, 2024–2029 (USD MILLION)
- TABLE 239 SOUTH AFRICA: MARKET, BY OFFERING, 2019–2023 (USD MILLION)
- TABLE 240 SOUTH AFRICA: MARKET, BY OFFERING, 2024–2029 (USD MILLION)
- TABLE 241 SOUTH AFRICA: MARKET, BY SERVICE, 2019–2023 (USD MILLION)
- TABLE 242 SOUTH AFRICA: MARKET, BY SERVICE, 2024–2029 (USD MILLION)
- TABLE 243 REST OF MIDDLE EAST & AFRICA: MARKET, BY OFFERING, 2019–2023 (USD MILLION)
- TABLE 244 REST OF MIDDLE EAST & AFRICA: MARKET, BY OFFERING, 2024–2029 (USD MILLION)
- TABLE 245 REST OF MIDDLE EAST & AFRICA: MARKET, BY SERVICE, 2019–2023 (USD MILLION)
- TABLE 246 REST OF MIDDLE EAST & AFRICA: MARKET, BY SERVICE, 2024–2029 (USD MILLION)
- TABLE 247 LATIN AMERICA: MARKET, BY OFFERING, 2019–2023 (USD MILLION)
- TABLE 248 LATIN AMERICA: MARKET, BY OFFERING, 2024–2029 (USD MILLION)
- TABLE 249 LATIN AMERICA: MARKET, BY SERVICE, 2019–2023 (USD MILLION)
- TABLE 250 LATIN AMERICA: MARKET, BY SERVICE, 2024–2029 (USD MILLION)
- TABLE 251 LATIN AMERICA: MARKET, BY APPLICATION, 2019–2023 (USD MILLION)
- TABLE 252 LATIN AMERICA: MARKET, BY APPLICATION, 2024–2029 (USD MILLION)
- TABLE 253 LATIN: MARKET, BY BUSINESS FUNCTION, 2019–2023 (USD MILLION)
- TABLE 254 LATIN AMERICA: PROJECT PORTFOLIO MANAGEMENT MARKET, BY BUSINESS FUNCTION, 2024–2029 (USD MILLION)
- TABLE 255 LATIN AMERICA: MARKET, BY DEPLOYMENT MODE, 2019–2023 (USD MILLION)
- TABLE 256 LATIN AMERICA: MARKET, BY DEPLOYMENT MODE, 2024–2029 (USD MILLION)
- TABLE 257 LATIN AMERICA: MARKET, BY ORGANIZATION SIZE, 2019–2023 (USD MILLION)
- TABLE 258 LATIN AMERICA: MARKET, BY ORGANIZATION SIZE, 2024–2029 (USD MILLION)
- TABLE 259 LATIN AMERICA: MARKET, BY VERTICAL, 2019–2023 (USD MILLION)
- TABLE 260 LATIN AMERICA: MARKET, BY VERTICAL, 2024–2029 (USD MILLION)
- TABLE 261 LATIN AMERICA: MARKET, BY COUNTRY, 2019–2023 (USD MILLION)
- TABLE 262 LATIN AMERICA: MARKET, BY COUNTRY, 2024–2029 (USD MILLION)
- TABLE 263 BRAZIL: MARKET, BY OFFERING, 2019–2023 (USD MILLION)
- TABLE 264 BRAZIL: MARKET, BY OFFERING, 2024–2029 (USD MILLION)
- TABLE 265 BRAZIL: MARKET, BY SERVICE, 2019–2023 (USD MILLION)
- TABLE 266 BRAZIL: MARKET, BY SERVICE, 2024–2029 (USD MILLION)
- TABLE 267 MEXICO: MARKET, BY OFFERING, 2019–2023 (USD MILLION)
- TABLE 268 MEXICO: MARKET, BY OFFERING, 2024–2029 (USD MILLION)
- TABLE 269 MEXICO: MARKET, BY SERVICE, 2019–2023 (USD MILLION)
- TABLE 270 MEXICO: MARKET, BY SERVICE, 2024–2029 (USD MILLION)
- TABLE 271 REST OF LATIN AMERICA: PROJECT PORTFOLIO MANAGEMENT MARKET, BY OFFERING, 2019–2023 (USD MILLION)
- TABLE 272 REST OF LATIN AMERICA: MARKET, BY OFFERING, 2024–2029 (USD MILLION)
- TABLE 273 REST OF LATIN AMERICA: MARKET, BY SERVICE, 2019–2023 (USD MILLION)
- TABLE 274 REST OF LATIN AMERICA: MARKET, BY SERVICE, 2024–2029 (USD MILLION)
- TABLE 275 OVERVIEW OF STRATEGIES ADOPTED BY KEY VENDORS
- TABLE 276 MARKET SHARE OF KEY VENDORS, 2023
- TABLE 277 MARKET: REGION FOOTPRINT
- TABLE 278 MARKET: OFFERING FOOTPRINT
- TABLE 279 MARKET: VERTICAL FOOTPRINT
- TABLE 280 OVERALL COMPANY FOOTPRINT FOR STARTUPS/SMES
- TABLE 281 MARKET: KEY STARTUPS/SMES
- TABLE 282 MARKET: PRODUCT LAUNCHES, FEBRUARY 2023–AUGUST 2024
- TABLE 283 PROJECT PORTFOLIO MANAGEMENT MARKET: DEALS, FEBRUARY 2021–OCTOBER 2023
- TABLE 284 ORACLE: COMPANY OVERVIEW
- TABLE 285 ORACLE: PRODUCTS/SOLUTIONS/SERVICES OFFERED
- TABLE 286 ORACLE: PRODUCT LAUNCHES AND ENHANCEMENTS
- TABLE 287 ORACLE: DEALS
- TABLE 288 SMARTSHEET: COMPANY OVERVIEW
- TABLE 289 SMARTSHEET: PRODUCTS/SOLUTIONS/SERVICES OFFERED
- TABLE 290 SMARTSHEET: PRODUCT LAUNCHES
- TABLE 291 MICROSOFT: COMPANY OVERVIEW
- TABLE 292 MICROSOFT: PRODUCTS/SOLUTIONS/SERVICES OFFERED
- TABLE 293 MICROSOFT: PRODUCT LAUNCHES
- TABLE 294 MICROSOFT: DEALS
- TABLE 295 ASANA: COMPANY OVERVIEW
- TABLE 296 ASANA: PRODUCTS/SOLUTIONS/SERVICES OFFERED
- TABLE 297 ASANA: PRODUCT LAUNCHES
- TABLE 298 ASANA: EXPANSIONS
- TABLE 299 SERVICENOW: COMPANY OVERVIEW
- TABLE 300 SERVICENOW: PRODUCTS/SOLUTIONS/SERVICES OFFERED
- TABLE 301 SERVICENOW: PRODUCT LAUNCHES
- TABLE 302 SERVICENOW: DEALS
- TABLE 303 PLANVIEW: COMPANY OVERVIEW
- TABLE 304 PLANVIEW: PRODUCTS/SOLUTIONS/SERVICES OFFERED
- TABLE 305 PLANVIEW: PRODUCT LAUNCHES
- TABLE 306 PLANVIEW: DEALS
- TABLE 307 SAP: COMPANY OVERVIEW
- TABLE 308 SAP: PRODUCTS/SOLUTIONS/SERVICES OFFERED
- TABLE 309 SAP: PRODUCT LAUNCHES AND ENHANCEMENTS
- TABLE 310 SAP: DEALS
- TABLE 311 ATLASSIAN: COMPANY OVERVIEW
- TABLE 312 ATLASSIAN: PRODUCTS/SOLUTIONS/SERVICES OFFERED
- TABLE 313 ATLASSIAN: PRODUCT LAUNCHES
- TABLE 314 ATLASSIAN: DEALS
- TABLE 315 ADOBE: COMPANY OVERVIEW
- TABLE 316 ADOBE: PRODUCTS/SOLUTIONS/SERVICES OFFERED
- TABLE 317 ADOBE: PRODUCT LAUNCHES AND ENHANCEMENTS
- TABLE 318 WORKDAY: COMPANY OVERVIEW
- TABLE 319 WORKDAY: PRODUCTS/SOLUTIONS/SERVICES OFFERED
- TABLE 320 WORKDAY: PRODUCT LAUNCHES AND ENHANCEMENTS
- TABLE 321 WORKDAY: DEALS
- TABLE 322 GFT TECHNOLOGIES: COMPANY OVERVIEW
- TABLE 323 GFT TECHNOLOGIES: PRODUCTS/SOLUTIONS/SERVICES OFFERED
- TABLE 324 GFT TECHNOLOGIES: PRODUCT LAUNCHES AND ENHANCEMENTS
- TABLE 325 GFT TECHNOLOGIES: DEALS
- TABLE 326 GFT TECHNOLOGIES: OTHER DEVELOPMENTS
- TABLE 327 WRIKE: COMPANY OVERVIEW
- TABLE 328 WRIKE: PRODUCTS/SOLUTIONS/SERVICES OFFERED
- TABLE 329 WRIKE: PRODUCT LAUNCHES AND ENHANCEMENTS
- TABLE 330 WRIKE: DEALS
- TABLE 331 MONDAY.COM: COMPANY OVERVIEW
- TABLE 332 MONDAY.COM: PRODUCTS/SOLUTIONS/SERVICES OFFERED
- TABLE 333 MONDAY.COM: PRODUCT LAUNCHES AND ENHANCEMENTS
- TABLE 334 OPENTEXT: COMPANY OVERVIEW
- TABLE 335 OPENTEXT: PRODUCTS/SOLUTIONS/SERVICES OFFERED
- TABLE 336 OPENTEXT: PRODUCT LAUNCHES AND ENHANCEMENTS
- TABLE 337 AI IN PROJECT MANAGEMENT MARKET, BY COMPONENT, 2017–2022 (USD MILLION)
- TABLE 338 AI IN PROJECT MANAGEMENT MARKET, BY COMPONENT, 2023–2028 (USD MILLION)
- TABLE 339 AI IN PROJECT MANAGEMENT MARKET, BY REGION, 2017–2022 (USD MILLION)
- TABLE 340 AI IN PROJECT MANAGEMENT MARKET, BY REGION, 2023–2028 (USD MILLION)
- TABLE 341 AI IN PROJECT MANAGEMENT MARKET, BY VERTICAL, 2017–2022 (USD MILLION)
- TABLE 342 AI IN PROJECT MANAGEMENT MARKET, BY VERTICAL, 2023–2028 (USD MILLION)
- TABLE 343 ENTERPRISE PERFORMANCE MANAGEMENT MARKET, BY COMPONENT, 2017–2021 (USD MILLION)
- TABLE 344 ENTERPRISE PERFORMANCE MANAGEMENT MARKET, BY COMPONENT, 2022–2027 (USD MILLION)
- TABLE 345 ENTERPRISE PERFORMANCE MANAGEMENT MARKET, BY VERTICAL, 2017–2021 (USD MILLION)
- TABLE 346 ENTERPRISE PERFORMANCE MANAGEMENT MARKET, BY VERTICAL, 2022–2027 (USD MILLION)
- TABLE 347 ENTERPRISE PERFORMANCE MANAGEMENT MARKET, BY REGION, 2017–2021 (USD MILLION)
- TABLE 348 ENTERPRISE PERFORMANCE MANAGEMENT MARKET, BY REGION, 2022–2027 (USD MILLION)
- FIGURE 1 PROJECT PORTFOLIO MANAGEMENT MARKET: RESEARCH DESIGN
- FIGURE 2 BREAKUP OF PRIMARY INTERVIEWS: BY COMPANY TYPE, DESIGNATION, AND REGION
- FIGURE 3 MARKET: TOP-DOWN AND BOTTOM-UP APPROACHES
- FIGURE 4 MARKET SIZE ESTIMATION METHODOLOGY: SUPPLY-SIDE ANALYSIS
- FIGURE 5 MARKET SIZE ESTIMATION METHODOLOGY - BOTTOM-UP APPROACH (SUPPLY SIDE): COLLECTIVE REVENUE OF PPM VENDORS
- FIGURE 6 MARKET SIZE ESTIMATION METHODOLOGY – (SUPPLY SIDE): ILLUSTRATION OF VENDOR REVENUE ESTIMATION
- FIGURE 7 MARKET SIZE ESTIMATION METHODOLOGY – APPROACH 2 (DEMAND SIDE): REVENUE GENERATED FROM OFFERINGS
- FIGURE 8 MARKET SIZE ESTIMATION METHODOLOGY – APPROACH 2 (DEMAND SIDE): MARKET
- FIGURE 9 PROJECT PORTFOLIO MANAGEMENT MARKET SNAPSHOT, 2021–2029
- FIGURE 10 TOP MARKET SEGMENTS IN TERMS OF GROWTH RATE
- FIGURE 11 NORTH AMERICA TO ACCOUNT FOR LARGEST SHARE DURING FORECAST PERIOD
- FIGURE 12 RISING DEMAND FOR EFFICIENT PROJECT EXECUTION AND INCREASING ADOPTION OF STRATEGIC PORTFOLIO MANAGEMENT TO DRIVE MARKET GLOBALLY
- FIGURE 13 SOLUTIONS SEGMENT TO ACCOUNT FOR LARGEST SHARE IN 2024
- FIGURE 14 PROFESSIONAL SERVICES SEGMENT TO ACCOUNT FOR LARGEST SHARE IN 2024
- FIGURE 15 PROJECT PLANNING & MANAGEMENT TO ACCOUNT FOR LARGEST SHARE IN 2024
- FIGURE 16 IT & SOFTWARE DEVELOPMENT TO ACCOUNT FOR LARGEST SHARE IN 2024
- FIGURE 17 CLOUD SEGMENT TO ACCOUNT FOR LARGEST SHARE IN 2024
- FIGURE 18 LARGE ENTERPRISES SEGMENT TO ACCOUNT FOR LARGEST SHARE IN 2024
- FIGURE 19 IT & TELECOM SEGMENT TO ACCOUNT FOR LARGEST SHARE IN 2024
- FIGURE 20 ASIA PACIFIC TO EMERGE AS BEST MARKET FOR INVESTMENTS IN NEXT FIVE YEARS
- FIGURE 21 MARKET: DRIVERS, RESTRAINTS, OPPORTUNITIES, AND CHALLENGES
- FIGURE 22 MARKET: ECOSYSTEM ANALYSIS
- FIGURE 23 MARKET: SUPPLY CHAIN
- FIGURE 24 NUMBER OF PATENTS PUBLISHED, 2013–2023
- FIGURE 25 TOP FIVE PATENT OWNERS (GLOBAL), 2013–2023
- FIGURE 26 MARKET: PORTER'S FIVE FORCES ANALYSIS
- FIGURE 27 PROJECT PORTFOLIO MANAGEMENT MARKET: TRENDS AND DISRUPTIONS IMPACTING CUSTOMERS' BUSINESSES
- FIGURE 28 INFLUENCE OF STAKEHOLDERS ON BUYING PROCESS FOR KEY VERTICALS
- FIGURE 29 KEY BUYING CRITERIA FOR TOP THREE VERTICALS
- FIGURE 30 INVESTMENT AND FUNDING SCENARIO OF MAJOR PROJECT PORTFOLIO MANAGEMENT COMPANIES
- FIGURE 31 IMPACT OF GEN AI ON MARKET, 2024
- FIGURE 32 SERVICES SEGMENT TO GROW AT HIGHER CAGR DURING FORECAST PERIOD
- FIGURE 33 MANAGED SERVICES TO GROW AT HIGHER RATE DURING FORECAST PERIOD
- FIGURE 34 PROJECT PLANNING & MANAGEMENT TO ACCOUNT FOR LARGEST SHARE DURING FORECAST PERIOD
- FIGURE 35 IT & SOFTWARE DEVELOPMENT SEGMENT TO GROW AT HIGHEST CAGR DURING FORECAST PERIOD
- FIGURE 36 CLOUD SEGMENT TO GROW AT HIGHER CAGR DURING FORECAST PERIOD
- FIGURE 37 SMALL ENTERPRISES TO GROW AT HIGHEST CAGR DURING FORECAST PERIOD
- FIGURE 38 IT & TELECOM TO ACCOUNT FOR LARGEST SHARE DURING FORECAST PERIOD
- FIGURE 39 NORTH AMERICA TO ACCOUNT FOR LARGEST MARKET BY 2029
- FIGURE 40 NORTH AMERICA: MARKET SNAPSHOT
- FIGURE 41 ASIA PACIFIC: MARKET SNAPSHOT
- FIGURE 42 MARKET: MARKET SHARE ANALYSIS
- FIGURE 43 VENDOR PRODUCTS/BRANDS COMPARISON
- FIGURE 44 HISTORICAL REVENUE ANALYSIS, 2019–2023 (USD MILLION)
- FIGURE 45 COMPANY EVALUATION MATRIX FOR KEY PLAYERS: CRITERIA WEIGHTAGE
- FIGURE 46 COMPANY EVALUATION MATRIX: KEY PLAYERS, 2023
- FIGURE 47 PROJECT PORTFOLIO MANAGEMENT MARKET: COMPANY FOOTPRINT
- FIGURE 48 EVALUATION MATRIX FOR STARTUPS/SMES: CRITERIA WEIGHTAGE
- FIGURE 49 COMPANY EVALUATION MATRIX: STARTUPS/SMES, 2023
- FIGURE 50 COMPANY VALUATION AND FINANCIAL METRICS OF KEY VENDORS
- FIGURE 51 YEAR-TO-DATE (YTD) PRICE TOTAL RETURN AND 5-YEAR STOCK BETA OF KEY VENDORS
- FIGURE 52 ORACLE: COMPANY SNAPSHOT
- FIGURE 53 SMARTSHEET: COMPANY SNAPSHOT
- FIGURE 54 MICROSOFT: COMPANY SNAPSHOT
- FIGURE 55 ASANA: COMPANY SNAPSHOT
- FIGURE 56 SERVICENOW: COMPANY SNAPSHOT
- FIGURE 57 SAP: COMPANY SNAPSHOT
- FIGURE 58 ATLASSIAN: COMPANY SNAPSHOT
- FIGURE 59 ADOBE: COMPANY SNAPSHOT
- FIGURE 60 WORKDAY: COMPANY SNAPSHOT
- FIGURE 61 GFT TECHNOLOGIES: COMPANY SNAPSHOT
- FIGURE 62 MONDAY.COM: COMPANY SNAPSHOT
- FIGURE 63 OPENTEXT: COMPANY SNAPSHOT
The study involved four major activities in estimating the project portfolio management market. We conducted secondary research to gather information on the market, competitors, and parent market. The next stage was to validate these findings and assumptions and size them with industry professionals across the value chain using primary research. Top-down and bottom-up methodologies were used to determine the total market size. We used the market breakup and data triangulation techniques to estimate the market size of the different segments in the project portfolio management market.
Secondary Research
Several sources were used to locate and collect information for this study during the secondary research process. Secondary sources included company annual reports, press announcements, investor presentations, white papers, journals, certified publications, and articles from well-known writers, directories, and databases. Data was also gathered from other secondary sources, such as journals, government websites, blogs, and vendor websites.
Primary Research
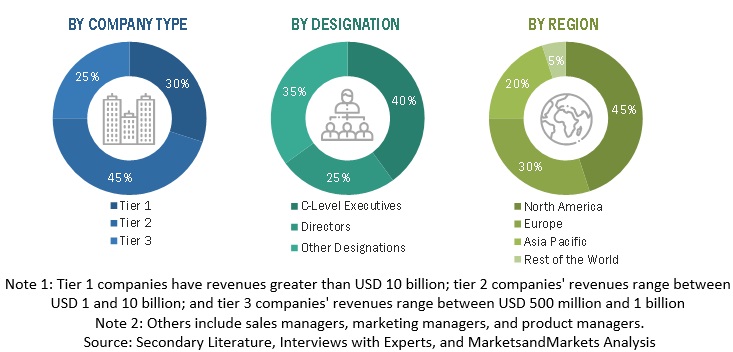
Primary sources included industry experts from the core and associated industries, preferred software suppliers, hardware manufacturers, distributors, service providers, technology developers, alliances, and organizations representing all parts of the industry's value chain. In-depth interviews were conducted with primary respondents, including major industry participants, subject-matter experts, C-level executives of important market companies, and industry consultants, to acquire and verify critical qualitative and quantitative data and analyze the market's potential.
We performed primary interviews to gain insights such as market statistics, the current trends disrupting the industry, new use cases applied, revenue data collected from products and services, market breakdowns, market size projections, market predictions, and data triangulation. Primary research also helped me grasp different technology trends, segmentation types, industry trends, and geographies. Demand-side stakeholders, such as Chief Information Officers (CIOs), Chief Technology Officers (CTOs), and Chief Security Officers (CSOs); installation teams of governments/end users using project portfolio management solutions and services; and digital initiatives project teams, were interviewed to understand the buyer's perspective on suppliers, products, service providers, and their current use of services, which will affect the overall project portfolio management market.
To know about the assumptions considered for the study, download the pdf brochure
Market Size Estimation
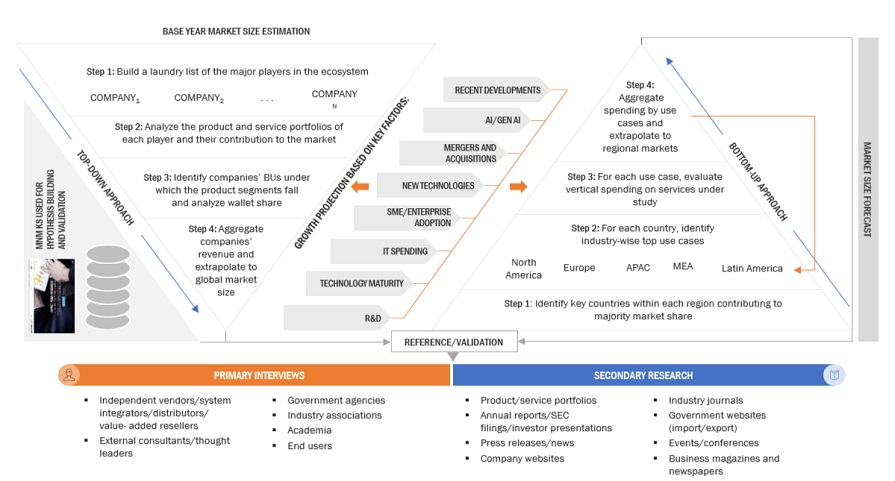
We estimated and forecasted project portfolio management and other related submarkets using top-down and bottom-up methodologies. We used a bottom-up approach to calculate the overall market size by analyzing the revenues and offerings of significant market players. This study used data triangulation methods and validation through primary interviews to determine and confirm the precise worth of the whole parent market. We used the overall market size in the top-down process to estimate the size of other particular markets using percentage splits of market segments.
We used top-down and bottom-up approaches to estimate and validate the project portfolio management market and other dependent subsegments.
The research methodology used to estimate the market size included the following details:
- We identified key players in the market through secondary research. We then determined their revenue contributions in the respective countries through primary and secondary research.
- This procedure included studying top market player’s annual and financial reports and extensive interviews for key insights from industry leaders, such as Chief Executive Officers (CEOs), VPs, directors, and marketing executives.
- All percentage splits and breakups were determined using secondary sources and verified through primary sources.
We estimated and forecasted the project portfolio management market and related submarkets using top-down and bottom-up methodologies. We used a bottom-up approach to calculate the overall market size by analyzing the revenues and offerings of significant market players. This study used data triangulation methods and validation through primary interviews to determine and confirm the precise worth of the whole parent market. We used the overall market size in the top-down process to estimate the size of other particular markets using percentage splits of market segments.
Project Portfolio Management market: Top-down and Bottom-up approaches
Data Triangulation
After determining the overall market size, the market was divided into segments and subsegments using the previously described market size estimating techniques. Where applicable, data triangulation and market breakup methods were used to complete the whole market engineering process and ascertain the exact numbers for each market segment and subsegment. The data was triangulated by evaluating many elements and trends on the demand and supply sides of the project portfolio management market.
Market Definition
“A strategic approach that organizations use to manage and align their portfolio of projects with their business goals. PPM involves the centralized management of multiple projects, often grouped into a portfolio, to optimize resource allocation, balance risks, and achieve the organization’s strategic objectives visualizations."
Source: Secondary Research and MarketsandMarkets Analysis
Key Stakeholders
- PPM solution providers
- Application solution providers
- Enterprise PPM solution providers
- Enterprise Resource Planning (ERP) solution providers
- Simulation and modeling solution providers
- Cloud service providers
- Business Intelligence (BI) solution providers
- Communication and collaboration solution providers
- Professional service providers
- System integrators
- Resellers and distributors
- Research organizations
- Government agencies
- Enterprise users
- Venture capitalists, private equity firms, and startup companies
Report Objectives
- To define, describe, and forecast the global project portfolio management (PPM) market based on offering, application, business function, deployment mode, organization size, vertical, and region
- To forecast the market size of the five major regional segments: North America, Europe, Asia Pacific, Middle East & Africa, and Latin America
- To strategically analyze the market subsegments concerning individual growth trends, prospects, and contributions to the total market
- To provide detailed information related to the significant factors influencing the growth of the market (drivers, restraints, opportunities, and challenges)
- To strategically analyze macro and micro markets for growth trends, prospects, and their contributions to the overall market
- To analyze industry trends, patents and innovations, and pricing data related to the PPM market
- To analyze the opportunities in the market for stakeholders and provide details of the competitive landscape for major players.
- To profile key players in the market and comprehensively analyze their market share/ranking and core competencies.
- To track and analyze competitive developments, such as mergers & acquisitions, product developments, and partnerships & collaborations in the market.
Available customizations
With the given market data, MarketsandMarkets offers customizations per the company's specific needs. The following customization options are available for the report:
Product analysis
- The product matrix provides a detailed comparison of each company's product portfolio.
Geographic analysis
- Further breakup of the Asia Pacific market into countries contributing 75% to the regional market size
- Further breakup of the North American market into countries contributing 75% to the regional market size
- Further breakup of the Latin American market into countries contributing 75% to the regional market size
- Further breakup of the Middle Eastern & African market into countries contributing 75% to the regional market size
- Further breakup of the European market into countries contributing 75% to the regional market size
Company information
- Detailed analysis and profiling of additional market players (up to 5)
Growth opportunities and latent adjacency in Project Portfolio Management (PPM) Market