Warranty Management System Market by Types (Claim & Transaction Management, Warranty Analytics, Billing & Administration Management, Warranty Tracking) by Deployment (On Premise, Cloud), by Verticals, by Regions - Global Forecast to 2020


[138 Pages Report] The warranty management system market size is estimated to grow from USD 1.7 Billion in 2015 to USD 3.4 Billion by 2020, at a CAGR of 14.4% from 2015 to 2020.
Warranty management system redefines the contract and warranty management processes by providing integrated software to automate and standardize the warranty allied processes. The report aims at estimating the market size and future growth potential of the market across different segments such as software, service, deployment type, vertical, region. The base year considered for the study is 2014 and the forecast period is from 2015 to 2020. With the rise in claims cost and strained supplier-OEM relationship, the market is expected to play a key role in fuelling the growth of the market during the forecast period.
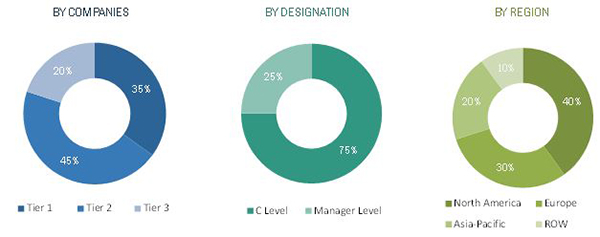
The research methodology used to estimate and forecast the warranty management system market begins with capturing data on key vendor revenues through secondary research. The vendor offerings are also taken into consideration to determine the market segmentation. The bottom-up procedure was employed to arrive at the overall market size of the global market from the revenue of the key players in the market. After arriving at the overall market size, the total market was split into several segments and sub-segments which are then verified through primary research by conducting extensive interviews with key people such as CEOs, VPs, Directors, and executives. This data triangulation and market breakdown procedures were employed to complete the overall market engineering process and arrive at the exact statistics for all segments and sub-segments. The breakdown of profiles of primary is depicted in the below figure:
The warranty management system ecosystem comprises of warranty management system vendors such as International Business Machines (IBM) Corporation, Oracle Corporation, Pegasystems, Inc., PTC Incorporated, SAP SE, Astea International, Inc., Industrial and Financial Systems (IFS) AB, Infosys Limited, Tavant Technologies, Inc., Tech Mahindra Limited, and Wipro Limited which sell warranty management software solutions to end users to cater to their unique business requirements and warranty needs.
Target audience
- System Design and Development Vendors
- System Integrators Service Providers
- Consultants/Consultancies/Advisory Firms
- Training and Education Service Providers
- Support and Maintenance Service Providers
- Warranty and Insurance Management Firms
- Original Equipment Manufacturer (OEM)
Scope of the Report
The research report segments the warranty management system market to following submarkets:
By Software:
- Claim Management
- Service Contract
- Contract Management
- Warranty and Contract Tracking
- Warranty Transaction Management
- Warranty Intelligence
- Warranty Analytics
- Interactive Dashboards and Reporting
- Administration Management
- Campaign And Product Registration
- Billing Management
- Customer Experience
By Service:
- Professional Service
- Deployment & System Integration Service
- Customization Service
By Deployment type:
- On-Demand
- On-Premise
By Vertical:
- Manufacturing
- Automotive
- Healthcare
- Supply Chain & Logistics
- Food & Beverages
- Others
By Region:
- North America
- Europe
- Asia-Pacific
- Middle East and Africa
- Latin America
Available Customizations
With the given market data, MarketsandMarkets offers customizations as per the company�s specific needs. The following customization options are available for the report:
Product Analysis
- Product matrix which gives a detailed comparison of product portfolio of each company
Geographic Analysis
- Further breakdown of the North America market
- Further breakdown of the Europe market
- Further breakdown of the APAC market
- Further breakdown of the MEA market
- Further breakdown of the Latin America market
Company Information
- Detailed analysis and profiling of additional market players
The warranty management system market size is estimated to grow from USD 1.7 Billion in 2015 to USD 3.4 Billion by 2020, at a Compound Annual Growth Rate (CAGR) of 14.4% from 2015 to 2020. In the milieu of automating all service management processes, ineffective claim processing and valuation of warranties lead to the increasing need for warranty management systems. Most organizations are unaware about the impact of insufficient and lagging product criticism, ineffective repair management, hampered customer brand loyalty, and increased dissatisfaction among customers. With the convergence of analytics and warranty intelligence, the market has a huge opportunity to grow during the forecast period.
The warranty management software solutions effectively automate the warranty management process which includes warranty coverage, administrating campaigns and product registrations, contract management, warranty and contract tracking, part return and supplier cost recovery. The service contract software segment is expected to hold the largest market share and dominate the market from 2015 to 2020. The main driver encouraging organizations to install service contract are the revenue leakages due to the use of paper documents, unstructured files, and singular systems. Warranty intelligence software is expected to grow at the highest rate in the warranty management system market during the forecast period. The software helps to track error patterns and project accurate warranty trends, thereby saving 2-3% of the claims cost that the company spends in claims settlements. Claim management software is also one of the software solutions holding a major market share, as it develops a seamless claim processing infrastructure, which automates the process of claim processing and reduces duplication and fraud.
On-premises is the fastest-growing deployment model in the market as it benefits organizations with increased scalability, speed, and 24/7 service. On-premises deployment is popular mostly in large enterprises where information is very critical for business operations.
The warranty management systems are being increasingly adopted in various verticals, such as manufacturing, automotive, and healthcare, which have led to the growth of the market across the globe. The manufacturing sector is expected to dominate the warranty management system market, and hold the largest market share during the forecast period. The market is also projected to witness growth in the automotive, supply chain and logistics, and healthcare sectors during the forecast period.
North America is expected to hold the largest market share and dominate the market from 2015 to 2020. Factors such as competitive manufacturing industry, need of strategic differentiators in the market, large domestic demand, and focus on improving customer relationships, improved cash flow, and reduction in claims cost have led the development of warranty management solutions in Asia-Pacific.
However, due to the lack of qualified and skilled workforce and lack of awareness among the end users, the organizations are exposed to revenue leakages and are restraining the growth of the market. The major vendors in this market include IBM Corporation, Oracle Corporation, Pegasystems, Inc., PTC, Inc., SAP SE, and others. These players adopted various strategies such as new product developments, mergers, partnerships, collaborations and business expansion to cater to the needs of the warranty management system market.
 Exclusive indicates content/data unique to MarketsandMarkets and not available with any competitors.
Table of Contents
1 Introduction (Page No. - 15)
1.1 Objectives of the Report
1.2 Market Definition
1.3 Market Scope
1.3.1 Markets Covered
1.3.2 Years Considered in the Report
1.4 Currency and Pricing
1.5 Limitations
1.6 Stakeholders
2 Research Methodology (Page No. - 18)
2.1 Research Data
2.1.1 Secondary Data
2.1.1.1 Key Data From Secondary Sources
2.1.2 Primary Data
2.1.2.1 Key Data From Primary Sources
2.1.3 Key Industry Insights
2.1.3.1 Breakdown of Primaries
2.2 Market Size Estimation
2.2.1 Bottom-Up Approach
2.2.2 Top-Down Approach
2.3 Market Breakdown and Data Triangulation
2.4 Research Assumptions and Limitations
2.4.1 Assumptions
2.4.2 Limitations
3 Executive Summary (Page No. - 28)
4 Warranty Management System Market: Premium Insight (Page No. - 32)
4.1 Attractive Market Opportunities in the WMS Market
4.2 WMS Market, Geographic Analysis
4.3 WMS Market Lifecycle Analysis (2015)
4.4 WMS Software Market Snapshot
4.5 WMS Service Market Snapshot
4.6 WMS Deployment Market Snapshot
4.7 WMS Vertical Market Snapshot
5 Warranty Management System Market: Overview (Page No. - 36)
5.1 Introduction
5.2 Market Segmentation
5.2.1 By Software
5.2.2 By Service
5.2.3 By Deployment
5.2.4 By Vertical
5.2.5 By Region
5.3 Market Dynamics
5.3.1 Drivers
5.3.1.1 Increasing Competition in Automotive and Manufacturing Industries
5.3.1.2 Rising Need of Automation
5.3.1.3 Rising Warranty Expenditure
5.3.2 Restraints
5.3.2.1 Lack of Qualified and Skilled Workforce
5.3.2.2 Lack of Awareness Among End-Users
5.3.3 Opportunities
5.3.3.1 Accelerating Manufacturing Sector in Apac
5.3.3.2 Need of Cross-Platform Solution
5.3.3.3 Evolving Warranty Intelligence Players
5.3.4 Challenges
5.3.4.1 Technology Integration
5.3.4.2 Inconsistent Business Semantics
5.4 Warranty Management Framework
6 Warranty Management System Market: Industry Trends (Page No. - 45)
6.1 Introduction
6.2 Value Chain Analysis
6.3 Strategic Benchmarking
6.4 Porter�s Five Forces Analysis
6.4.1 Threat of New Entrants
6.4.2 Threat of Substitutes
6.4.3 Bargaining Power of Suppliers
6.4.4 Bargaining Power of Buyers
6.4.5 Intensity of Rivalry
6.5 Pain Point Analysis
6.5.1 Identifying the Cause of Product Failure
6.5.2 Struggle in Recovering the Liability Cost From Supplier
6.5.3 Repair Management
6.5.4 Lengthy Claim Process Methodology
6.5.5 Lack of Technology Deployment and Integration
7 Warranty Management System Market Analysis, By Software (Page No. - 52)
7.1 Introduction
7.2 Claim Management
7.3 Service Contract
7.3.1 Contract Management
7.3.2 Warranty and Contract Tracking
7.3.3 Warranty Transaction Management
7.4 Warranty Intelligence
7.4.1 Warranty Analytics
7.4.2 Interactive Dashboards and Reporting
7.5 Administration Management
7.5.1 Campaign and Product Registration
7.5.2 Billing Management
7.5.3 Customer Experience
8 Warranty Management System Market Analysis, By Service (Page No. - 64)
8.1 Introduction
8.2 Professional Service
8.3 Deployment and System Integration Services
8.4 Customization Service
9 Warranty Management System Market Analysis, By Deployment (Page No. - 68)
9.1 Introduction
9.2 On-Premise
9.3 On-Demand
10 Warranty Management System Market Analysis, By Vertical (Page No. - 72)
10.1 Introduction
10.2 Manufacturing
10.3 Automotive
10.4 Healthcare
10.5 Supply Chain and Logistics
10.6 Food and Beverages
10.7 Others
11 Geographic Analysis (Page No. - 79)
11.1 Introduction
11.2 North America
11.3 Europe
11.4 Asia-Pacific
11.5 Latin America
11.6 Middle-East and Africa
12 Competitive Landscape (Page No. - 98)
12.1 Overview
12.2 Competitive Situation and Trends
12.3 Business Expansions
12.4 New Product Developments
12.5 Mergers and Acquisitions
12.6 Partnerships, Agreements, Joint Ventures, and Collaborations
12.7 Venture Funding
13 Company Profiles (Page No. - 104)
(Overview, Products & Services, Strategies & Insights, Developments and MnM View)*
13.1 International Business Machines (IBM) Corporation
13.2 Oracle Corporation
13.3 Pegasystems Inc.
13.4 PTC Inc.
13.5 SAP SE
13.6 Astea International, Inc.
13.7 Industrial and Financial Systems (IFS) AB
13.8 Infosys Limited
13.9 Tavant Technologies, Inc.
13.10 Tech Mahindra Limited
13.11 Wipro Limited
*Details on Overview, Products & Services, Strategies & Insights, Developments and MnM View Might Not Be Captured in Case of Unlisted Companies.
14 Appendix (Page No. - 133)
14.1 Discussion Guide
14.2 Introducing RT : Real-Time Market Intelligence
14.3 Available Customizations
14.4 Related Reports
List of Tables (82 Tables)
Table 1 Warranty Management System Market Size and Growth Rate, 2013�2020 (USD Million, Y-O-Y %)
Table 2 Drivers: Impact Analysis
Table 3 Restraints: Impact Analysis
Table 4 Opportunities: Impact Analysis
Table 5 Challenges: Impact Analysis
Table 6 Warranty Management System Market Size, By Software, 2013-2020 ( USD Million)
Table 7 WMS : Software Market Size By Region, 2013�2020 (USD Million)
Table 8 Claim Management Market : Market Size, By Region, 2013�2020 (USD Million)
Table 9 Service Contract Market : Market Size, By Type, 2013�2020 (USD Million)
Table 10 Service Contract Market : Market Size, By Regions, 2013�2020 (USD Million)
Table 11 Contract Management Market: Market Size, By Region, 2013�2020 (USD Million)
Table 12 Warranty and Contract Tracking Market : Market Size, By Region, 2013�2020 (USD Million)
Table 13 Warranty Transaction Management Market: Market Size, By Region, 2013�2020 (USD Million)
Table 14 Warranty Intelligence Market : Market Size, By Type, 2013�2020 (USD Million)
Table 15 Warranty Intelligence Market : Market Size, By Regions, 2013�2020 (USD Million)
Table 16 Warranty Analytics Market : Market Size, By Region, 2013�2020 (USD Million)
Table 17 Interactive Dashboards and Reporting Market : Market Size, By Region, 2013�2020 (USD Million)
Table 18 Administration Management Market : Market Size, By Types, 2013�2020 (USD Million)
Table 19 Administration Management Market : Market Size, By Regions, 2013�2020 (USD Million)
Table 20 Campaign and Product Registration Market : Market Size, By Region, 2013�2020 (USD Million)
Table 21 Billing Management Market : Market Size, By Region, 2013�2020 (USD Million)
Table 22 Customer Experience Market : Market Size, By Region, 2013�2020 (USD Million)
Table 23 Warranty Management System Market Size, By Services, 2013-2020 (USD Million)
Table 24 Professional Service : Market Size, By Region, 2013�2020 (USD Million)
Table 25 Deployment and System Integration Service : Market Size, By Region, 2013�2020 (USD Million)
Table 26 Customization Services : Market Size, By Region, 2013�2020 (USD Million)
Table 27 Market Size, By Deployment, 2013�2020 (USD Million)
Table 28 On-Premise Deployment : Market Size, By Region, 2013�2020 ( USD Million)
Table 29 On-Demand Deployment : Market Size, By Region, 2013�2020 ( USD Million)
Table 30 Market Size, By Vertical, 2013�2020 (USD Million)
Table 31 Manufacturing: Market Size, By Region, 2013�2020 (USD Million)
Table 32 Automotive: Market Size, By Region, 2013�2020 (USD Million)
Table 33 Automotive: Market Size, By Region, 2013�2020 (USD Million)
Table 34 Supply Chain and Logistics: Market Size, By Region, 2013�2020 (USD Million)
Table 35 Food and Beverages: Market Size, By Region, 2013�2020 (USD Million)
Table 36 Others : Market Size, By Region, 2013�2020 (USD Million)
Table 37 Warranty Management System Market Size, By Region, 2013�2020 (USD Million)
Table 38 North America: Market Size, By Type, 2013�2020 (USD Million)
Table 39 North America: Warranty Management Solution Software Market Size, By Type, 2013�2020 (USD Million)
Table 40 North America: Service Contract Market Size, By Type, 2013�2020 (USD Million)
Table 41 North America: Warranty Intelligence Market Size, By Type, 2013�2020 (USD Million)
Table 42 North America: Administration Management Market Size, By Type, 2013�2020 (USD Million)
Table 43 North America: Warranty Management Solution Service Market Size, By Type, 2013�2020 (USD Million)
Table 44 North America: Warranty Management Solution Deployment Market Size, By Type, 2013�2020 (USD Million)
Table 45 North America: Warranty Management Solution Vertical Market Size, By Type, 2015�2020 (USD Million)
Table 46 Europe: Warranty Management System Market Size, By Type, 2013�2020 (USD Million)
Table 47 Europe: Software Market Size, By Type, 2013�2020 (USD Million)
Table 48 Europe: Service Contract Market Size, By Type, 2013�2020 (USD Million)
Table 49 Europe: Warranty Intelligence Market Size, By Type, 2013�2020 (USD Million)
Table 50 Europe: Administration Management Market Size, By Type, 2013�2020 (USD Million)
Table 51 Europe: Service Market Size, By Type, 2013�2020 (USD Million)
Table 52 Europe: Deployment Market Size, By Type, 2013�2020 (USD Million)
Table 53 Europe: Vertical Market Size, By Type, 2013�2020 (USD Million)
Table 54 Asia-Pacific : Warranty Management System Market Size, By Type, 2013�2020 (USD Million)
Table 55 Asia-Pacific : Software Market Size, By Type, 2013�2020 (USD Million)
Table 56 Asia-Pacific : Service Contract Market Size, By Type, 2013�2020 (USD Million)
Table 57 Asia-Pacific : Warranty Intelligence Market Size, By Type, 2013�2020 (USD Million)
Table 58 Asia-Pacific: Administration Management Market Size, By Type, 2013�2020 (USD Million)
Table 59 Asia-Pacific: WMS Service Market Size, By Type, 2013�2020 (USD Million)
Table 60 Asia-Pacific : Market Size, Deployment 2013�2020 (USD Million)
Table 61 Asia-Pacific : Vertical Market Size, By Type, 2013�2020 (USD Million)
Table 62 Latin America: Market Size, By Type, 2013�2020 (USD Million)
Table 63 Latin America: WMS Software Market Size, By Type, 2013�2020 (USD Million)
Table 64 Latin America: Service Contract Software Market Size, By Type, 2013�2020 (USD Million)
Table 65 Latin America: Warranty Intelligence Market Size, By Type, 2013�2020 (USD Million)
Table 66 Latin America: Administration Management Market Size, By Type, 2013�2020 (USD Million)
Table 67 Latin America: Service Market Size, By Type, 2013�2020 (USD Million)
Table 68 Latin America: Market Size, By Deployment, 2013�2020 (USD Million)
Table 69 Latin America: WMS Vertical Market Size, By Type, 2013�2020 (USD Million)
Table 70 Middle-East and Africa: Market Size, By Type, 2013�2020 (USD Million)
Table 71 Middle-East and Africa: WMS Software Market Size, By Type, 2013�2020 (USD Million)
Table 72 Middle-East and Africa: Service Contract Market Size, By Type, 2013�2020 (USD Million)
Table 73 Middle-East and Africa: Warranty Intelligence Market Size, By Type, 2013�2020 (USD Million)
Table 74 Middle-East and Africa: Administration Management Market Size, By Type, 2013�2020 (USD Million)
Table 75 Middle-East and Africa: Warranty Management Solution Service Market Size, By Type, 2013�2020 (USD Million)
Table 76 Middle-East and Africa: Warranty Management Solution Deployment Market Size, By Type, 2013�2020 (USD Million)
Table 77 Middle-East and Africa: Warranty Management Solution Vertical Market Size, By Type, 2013�2020 (USD Million)
Table 78 Business Expansions, 2014�2015
Table 79 New Product Launches, 2013�2015
Table 80 Mergers and Acquisitions, 2014�2015
Table 81 Partnerships, Agreements, Joint Ventures, and Collaborations, 2014�2015
Table 82 Venture Funding, 2012�2015
List of Figures (49 Figures)
Figure 1 Warranty Management System Market: Research Design
Figure 2 Research Methodology
Figure 3 Market Size Estimation Methodology: Bottom-Up Approach
Figure 4 Market Size Estimation Methodology: Top-Down Approach
Figure 5 Market Breakdown and Data Triangulation
Figure 6 Warranty Management System Market Size and Growth Rate, 2015�2020 (USD Million, Y-O-Y %)
Figure 7 North America Holds the Largest Market Share for 2015
Figure 8 Top Four Segments of the Market
Figure 9 Growing Inclination Toward Achieving Business Process Integrity Efficiency is Driving the Market Growth
Figure 10 Asia-Pacific is Growing With the Highest CAGR During the Forecast Period
Figure 11 Warranty Management System Regional Lifecycle: Asia-Pacific is Expected to Exhibit Growth Potential During the Forecast Period
Figure 12 Service Warranty Segment Holds the Largest Market Share in 2015
Figure 13 Professional Service is the Most Adopted Service in the Market
Figure 14 On-Premise Deployment Market is Leading the Market in 2015
Figure 15 Manufacturing Market is Expected to Lead the Market From 2015 to 2020
Figure 16 Warranty Management System Market Segmentation: By Software
Figure 17 Market Segmentation By Service
Figure 18 Market Segmentation By Deployment
Figure 19 Market Segmentation By Vertical
Figure 20 Market Segmentation By Region
Figure 21 Market Drivers, Restraints, Opportunities, and Challenges
Figure 22 Management Framework Model
Figure 23 Value Chain Analysis
Figure 24 Organic and Inorganic Developments in Market During the Forecast Period
Figure 25 Porter�S Five Forces Analysis
Figure 26 Service Contact is Leading the Overall Market in Terms of Market Size During the Forecast Period
Figure 27 Majority of the Market is Dominated By Professional Services During the Forecast Period
Figure 28 On-Demand Deployment is Expected to Grow at the Highest Growth Rate During the Forecast Period
Figure 29 Manufacturing Vertical Dominates the Market During the Forecast Period
Figure 30 Asia-Pacific is Growing With the Highest CAGR During the Forecast Period
Figure 31 Companies Adopted Business Expansion Growth Strategy From 2013-2015
Figure 32 Market Evaluation Framework
Figure 33 Battle for Market Share: Venture Funding is the Key Strategy Adopted By Companies in the Market 2013-2015
Figure 34 IBM Corporation : Company Snapshot
Figure 35 IBM Corporation : SWOT Analysis
Figure 36 Oracle Corporation : Company Snapshot
Figure 37 Oracle Corporation : SWOT Analysis
Figure 38 Pegasystems Inc. : Company Snapshot
Figure 39 Pegasystems Inc.: SWOT Analysis
Figure 40 PTC Inc. : Company Snapshot
Figure 41 PTC Inc. : SWOT Analysis
Figure 42 SAP SE : Company Snapshot
Figure 43 SAP SE : SWOT Analysis
Figure 44 Astea International Inc. : Company Snapshot
Figure 45 Astea International Inc. : SWOT Analysis
Figure 46 IFS AB : Company Snapshot
Figure 47 Infosys Limited : Company Snapshot
Figure 48 Tech Mahindra Limited : Company Snapshot
Figure 49 Wipro Limited: Company Snapshot


Growth opportunities and latent adjacency in Warranty Management System Market
Gather insights into warranty management software for the Manufacturing industry segment in North America.