Visual Computing Market by Component (Hardware & Software), Display Platform (Interactive Whiteboards, Monitors, & Others), Industry Gaming, Media & Entertainment, Healthcare, & Others), & Geography - Global Forecast to 2020


Visual computing interacts with the disciplines of computer science such as image processing, computer graphics, visualization, video processing, and augmented and virtual reality. Over the period, the computer graphics has evolved into a mainstream area in the computer science domain. Currently, with the ever-increasing graphics hardware and software capabilities, this market is growing at a high pace. GPU (Graphics Processing Unit) is the core of modern technology and propelled the computer graphics to be implemented in various application areas such as gaming, media & entertainment, healthcare, and automotive among others.
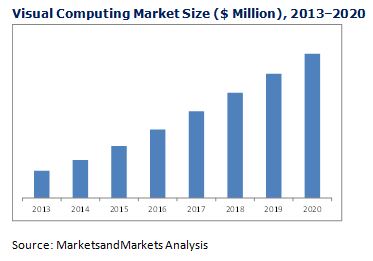
The visual computing market is expected to reach $22.02 Billion by 2020, at a CAGR of 22.59% between 2015 and 2020.
Visual computing interacts with the disciplines of computer science such as image processing, computer graphics, visualization, video processing, and augmented and virtual reality. Over the period, the computer graphics has evolved into a mainstream area in the computer science domain. Currently, with the ever-increasing graphics hardware and software capabilities, this market is growing at a high pace. Visual Computing Market exhibits a huge potential in terms of industries such as gaming, media & entertainment, healthcare, automotive, defense & intelligence, and manufacturing among others. E-learning and scientific research applications are also considered as a major field, where visual computing will be significantly used in the near future. Due to integration of this technology, efficiency can be enhanced to a larger extent. The life-like appearance and real-world experience would create better visualization.
The value chain of the visual computing market is from the broad and complex network. The entire chain is an inter-connection between various players related to the complete market, and the flow of technology & services. The prime building blocks of the value chain of the market comprise component manufacturers, software solution providers, technology integrators, and the end-users.
In this report, drivers, restraints, opportunities, and challenges for the visual computing market have been covered. The growth of this market is propelled by the industries such as gaming, entertainment, healthcare, and so on. The market is further driven by an enhanced user experience due to an efficient interface and visualization. Factors such as emerging applications and high investments on the R&D are creating opportunities for this market. However, due to usage of high-end GPUs and other processors, the power consumption is too high, but the companies are working out on the same.
In the visual computing market, gaming and media & entertainment accounted for a large market share. However, healthcare and automotive industries are expected to grow respectively at the highest rate during the forecast period. Some of the major companies in the market include Nvidia Corp. (U.S.), Intel Corp. (U.S.), Advanced Micro Devices, Inc. (U.S.), ARM Holdings plc. (U.K.), Imagination Technologies Group Plc. (U.K.), and so on. Geographically, this market covers the Americas, Europe, APAC, and Rest of the World (RoW).
 Exclusive indicates content/data unique to MarketsandMarkets and not available with any competitors.
Table of Contents
1 Introduction (Page No. - 14)
1.1 Objectives of the Study
1.2 Market Definition
1.3 Markets Covered
1.3.1 Geographic Scope
1.3.2 Years Considered for the Study
1.4 Currency
1.5 Limitations
1.6 Stakeholders
2 Research Methodology (Page No. - 18)
2.1 Research Data
2.1.1 Secondary Data
2.1.1.1 Key Data From Secondary Sources
2.1.2 Primary Data
2.1.2.1 Key Data From Primary Sources
2.1.2.2 Key Industry Insights
2.1.2.3 Breakdown of Primaries
2.2 Factor Analysis of Market
2.2.1 Introduction
2.2.2 Demand-Side Analysis
2.2.2.1 Rise of 3d Usage in Education, Healthcare, and Other Applications
2.2.2.2 Growth of 3d Animated Movies Using Visual Computing Technology
2.3 Market Size Estimation
2.4 Market Breakdown & Data Triangulation
2.5 Research Assumptions
3 Executive Summary (Page No. - 27)
4 Premium Insights (Page No. - 32)
4.1 Attractive Opportunities in the Market
4.2 Market, By Component
4.3 Market in APAC
4.4 The U.S. Held the Largest Share of the Global Market
4.5 Market, By Display Platform
4.6 The Life Cycle Analysis, By Region
5 Market Overview (Page No. - 36)
5.1 Introduction
5.2 Evolution
5.3 Market Segmentation
5.4 Market Dynamics
5.4.1 Drivers
5.4.1.1 Enhanced User Experience in Most Applications
5.4.1.2 Demand From the Industries Such as Gaming, Animation, Healthcare Would Drive the Market
5.4.2 Restraints
5.4.2.1 Requirement of Hardware
5.4.2.2 High Power Consumption
5.4.3 Opportunities
5.4.3.1 Emerging Applications
5.4.3.2 Increase in R&D Initiatives
5.4.4 Challenge
5.4.4.1 The Lack of Awareness About the Concept
6 Industry Trends (Page No. - 44)
6.1 Introduction
6.2 Value Chain Analysis
6.3 Key Industry Trends
6.4 Porter’s Five Forces Analysis
6.4.1 Bargaining Power of Buyers
6.4.2 Bargaining Power of Suppliers
6.4.3 Threat of Substitutes
6.4.4 Threat of New Entrants
6.4.5 Intensity of Rivalry
7 Visual Computing Market, By Component (Page No. - 54)
7.1 Introduction
7.2 Hardware Component
7.3 Software Component
8 Visual Computing Market, By Display Platform (Page No. - 61)
8.1 Introduction
8.2 Interactive Whiteboard
8.3 Interactive Kiosk
8.4 Interactive Table
8.5 Interactive Video Wall
8.6 Monitor
8.7 Others
9 Market, By Industry (Page No. - 76)
9.1 Introduction
9.2 Gaming
9.3 Media & Entertainment
9.4 Healthcare
9.5 Automotive
9.6 Manufacturing
9.7 Defense & Intelligence
9.8 Others
10 Geographic Analysis (Page No. - 94)
10.1 Introduction
10.2 Americas
10.2.1 U.S.
10.2.2 Canada
10.2.3 Mexico
10.2.4 Rest of the Americas
10.3 Europe
10.3.1 U.K.
10.3.2 Germany
10.3.3 France
10.3.4 Rest of Europe
10.4 Asia-Pacific
10.4.1 China
10.4.2 Japan
10.4.3 India
10.4.4 South Korea
10.4.5 Rest of APAC
10.5 RoW
11 Competitive Landscape (Page No. - 111)
11.1 Overview
11.2 Market Ranking for the Visual Computing Market, 2014
11.3 Competitive Situations & Trends
11.3.1 New Product Launches and Developments
11.3.2 Partnerships & Agreements
11.3.3 Mergers & Acquisitions
11.3.4 Contracts
12 Company Profiles (Page No. - 117)
(Overview, Products and Services, Financials, Strategy & Development)*
12.1 Introduction
12.2 Nvidia Corporation
12.3 Intel Corporation
12.4 Advanced Micro Devices, Inc.
12.5 ARM Ltd.
12.6 Imagination Technologies Limited
12.7 Matrox
12.8 Biodigital, Inc.
12.9 Exxact Corporation
12.10 Cubix Corporation
12.11 Softkinetic
*Details on Overview, Products and Services, Financials, Strategy & Development Might Not Be Captured in Case of Unlisted Companies.
13 Appendix (Page No. - 137)
13.1 Insights of Industry Experts
13.2 Discussion Guide
13.3 Introducing RT: Real Time Market Intelligence
13.4 Available Customizations
13.5 Related Reports
List of Tables (65 Tables)
Table 1 Number of 3d Movies Released Per Year
Table 2 Visual Computing Market, By Component, 2013–2020 (USD Billion)
Table 3 Hardware Market for Visual Computing, By Processing Unit, 2013–2020 (USD Million)
Table 4 Hardware Market by Display Platform, 2013–2020 (USD Million)
Table 5 Hardware Market by Industry, 2013–2020 (USD Million)
Table 6 Software Market in Visual Computing, By Display Platform, 2013–2020 (USD Million)
Table 7 Software Market by Industry, 2013–2020 (USD Million)
Table 8 Visual Computing Market, By Display Platform, 2013–2020 (USD Billion)
Table 9 Interactive Whiteboard Market for Visual Computing, By Industry, 2013–2020 (USD Million)
Table 10 Interactive Whiteboard Market for Visual Computing, By Component, 2013–2020 (USD Million)
Table 11 Interactive Whiteboard Market by Region, 2013–2020 (USD Million)
Table 12 Interactive Kiosk Market by Industry, 2013–2020 (USD Million)
Table 13 Interactive Kiosk Market by Component, 2013–2020 (USD Million)
Table 14 Interactive Kiosk Market by Region, 2013–2020 (USD Million)
Table 15 Interactive Table Market for Visual Computing, By Industry, 2013–2020 (USD Million)
Table 16 Interactive Table Market for Visual Computing, By Component, 2013–2020 (USD Million)
Table 17 Interactive Table Market by Region, 2013–2020 (USD Million)
Table 18 Interactive Video Wall Market by Industry, 2013–2020 (USD Million)
Table 19 Interactive Video Wall Market for Visual Computing, By Component, 2013–2020 (USD Million)
Table 20 Interactive Video Wall Market for Visual Computing, By Region, 2013–2020 (USD Million)
Table 21 Monitor Market for Visual Computing, By Industry, 2013–2020 (USD Million)
Table 22 Monitor Market by Component, 2013–2020 (USD Million)
Table 23 Monitor Market for Visual Computing, By Region, 2013–2020 (USD Million)
Table 24 Others Market by Industry, 2013–2020 (USD Million)
Table 25 Others Market by Component, 2013–2020 (USD Million)
Table 26 Others Market by Region, 2013–2020 (USD Million)
Table 27 Market, By Industry, 2013–2020 (USD Billion)
Table 28 Gaming Market by Region, 2013–2020 (USD Million)
Table 29 Gaming Market by Display Platform, 2013–2020 (USD Million)
Table 30 Gaming Market for Visual Computing, By Component, 2013–2020 (USD Million)
Table 31 Media & Entertainment Market for Visual Computing, By Region, 2013–2020 (USD Million)
Table 32 Media & Entertainment Market by Display Platform, 2013–2020 (USD Million)
Table 33 Media & Entertainment Market by Component, 2013–2020 (USD Million)
Table 34 Healthcare Market for Visual Computing, By Region, 2013–2020 (USD Million)
Table 35 Healthcare Market by Display Platform, 2013–2020 (USD Million)
Table 36 Healthcare Market by Component, 2013–2020 (USD Million)
Table 37 Automotive Market by Region, 2013–2020 (USD Million)
Table 38 Automotive Market by Display Platform, 2013–2020 (USD Million)
Table 39 Automotive Market for Visual Computing, By Component, 2013–2020 (USD Million)
Table 40 Manufacturing Market by Region, 2013–2020 (USD Million)
Table 41 Manufacturing Market by Display Platform, 2013–2020 (USD Million)
Table 42 Manufacturing Market by Component, 2013–2020 (USD Million)
Table 43 Defense & Intelligence Market by Region, 2013–2020 (USD Million)
Table 44 Defense & Intelligence Market by Display Platform, 2013–2020 (USD Million)
Table 45 Defense & Intelligence Market by Component, 2013–2020 (USD Million)
Table 46 Others Market by Region, 2013–2020 (USD Million)
Table 47 Others Market by Display Platform, 2013–2020 (USD Million)
Table 48 Others Market by Component, 2013–2020 (USD Million)
Table 49 Visual Computing Market, By Region, 2013–2020 (USD Billion)
Table 50 Market in the Americas, By Country, 2013–2020 (USD Million)
Table 51 Market in the Americas, By Industry, 2013–2020 (USD Million)
Table 52 Market in the Americas, By Display Platform, 2013–2020 (USD Million)
Table 53 Market in Europe, By Country, 2013–2020 (USD Million)
Table 54 Market in Europe, By Industry, 2013–2020 (USD Million)
Table 55 Market in Europe, By Display Platform, 2013–2020 (USD Million)
Table 56 Market in APAC, By Country, 2013–2020 (USD Million)
Table 57 Market in APAC, By Industry, 2013–2020 (USD Million)
Table 58 Market in APAC, By Display Platform, 2013–2020 (USD Million)
Table 59 Market in RoW, By Region, 2013–2020 (USD Million)
Table 60 Market in RoW, By Industry, 2013–2020 (USD Million)
Table 61 Market in RoW, By Display Platform, 2013–2020 (USD Million)
Table 62 New Product Launches and Developments, 2014–2015
Table 63 Partnerships & Agreements, 2014–2015
Table 64 Mergers & Acquisitions, 2013–2014
Table 65 Contracts, 2014-2015
List of Figures (66 Figures)
Figure 1 Research Design
Figure 2 Visual Computing Market Size Estimation Methodology: Bottom-Up Approach
Figure 3 Market Size Estimation Methodology: Top-Down Approach
Figure 4 Market Breakdown & Data Triangulation
Figure 5 Assumptions of the Research Study
Figure 6 Software Components are Expected to Hold the Largest Market Size of the Market During the Forecast Period
Figure 7 Healthcare Industry is Expected to Grow at the Highest CAGR During the Forecast Period
Figure 8 Monitor Market is Estimated to Grow at the Highest Rate During the Forecast Period
Figure 9 The Americas Held the Largest Market Share in the Market, in 2014
Figure 10 Increasing Adoption of Visual Computing Technology is Expected in the APAC Region Between 2015 and 2020
Figure 11 The Software Component is Expected to Hold the Maximum Market Share During the Forecast Period
Figure 12 Healthcare Industry is Expected to Grow at the Highest CAGR During the Forecast Period
Figure 13 The U.S. Dominated the Global Market in 2014
Figure 14 Monitors are Likely to Dominate the Market During the Forecast Period
Figure 15 APAC has the Highest Growth Rate, Followed By Europe and the Americas During the Forecast Period
Figure 16 Evolution of the Market
Figure 17 Market, By Component
Figure 18 Market, By Display Platform
Figure 19 Market, By Industry
Figure 20 Market, By Geography
Figure 21 Demand From the Industries Such as Gaming, Animation, Healthcare Would Drive the Market
Figure 22 The Component Manufacturers and Software Solution Providers Integration Enables Visual Computing Technology
Figure 23 Increasing Research & Development is A Leading Trend Among the Key Market Players
Figure 24 Porter’s Five Forces Analysis for the Market
Figure 25 Porter’s Five Forces Analysis - Impact Analysis, 2014
Figure 26 Bargaining Power of Buyers in the Market, 2014
Figure 27 Bargaining Power of Suppliers in the Market, 2014
Figure 28 Threat of Substitutes in the Market, 2014
Figure 29 Threat of New Entrants in the Market, 2014
Figure 30 Intensity of Rivalry in the Market, 2014
Figure 31 Market, By Component
Figure 32 Software Component in the Market is Likely to Hold the Largest Market Size During the Forecast Period
Figure 33 The Market for Interactive Monitors is Expected to Grow at the Highest Rate During the Forecast Period
Figure 34 Gaming Industry is Likely to Hold the Largest Share in the Market During the Forecast Period
Figure 35 Market, By Display Platform
Figure 36 Monitors are Estimated to Grow at the Fastest Rate in the Market During the Forecast Period
Figure 37 Interactive Whiteboard Integrated With Visual Computing Technology Likely to Have Highest Growth Rate in the Healthcare Industry During the Forecast Period
Figure 38 The Software Component Holds the Maximum Share of the Interactive Kiosk Market With Visual Computing Technology
Figure 39 Asia Pacific Market is Expected to Grow at the Highest Rate in the Interactive Table Market With Visual Computing Technology Between 2015 and 2020
Figure 40 The Monitor Market in the Healthcare Industry is Expected to Grow at the Highest Rate During the Forecast Period
Figure 41 Market, By Industry
Figure 42 The Application of Visual Computing Technology in Healthcare is Expected to Grow at the Highest Rate During the Forecast Period
Figure 43 The Monitor Market in the Gaming Industry is Expected to Grow at the Highest Rate During the Forecast Period
Figure 44 The Healthcare Industry in Asia-Pacific is Expected to Grow at the Highest CAGR During the Forecast Period
Figure 45 Market Share for Interactive Kiosks With Visual Computing Technology in the Automotive Industry is Estimated to Be the Highest in 2015
Figure 46 The Growth Rate of Monitors is Expected to Be the Highest in the Manufacturing Industry Between 2015 and 2020
Figure 47 The Software Component is Likely to Hold the Maximum Share in the Defense & Intelligence Industry in 2015
Figure 48 Market, By Geography
Figure 49 Geographic Snapshot for Market (2015–2020)
Figure 50 Segmentation: Americas
Figure 51 Americas Market Snapshot
Figure 52 Segmentation: Europe
Figure 53 Europe Market Snapshot
Figure 54 Segmentation: Asia-Pacific
Figure 55 Asia-Pacific Market Snapshot
Figure 56 Segmentation: RoW
Figure 57 RoW Market Snapshot
Figure 58 New Product Development Was the Major Strategy Adopted By the Key Players, 2012–2015
Figure 59 Market Evaluation Framework
Figure 60 Battle for Market Share: New Product Development Was the Key Strategy, 2013–2015
Figure 61 Geographic Revenue Mix of Top Players
Figure 62 Nvidia Corporation: Company Snapshot
Figure 63 Intel Corporation: Company Snapshot
Figure 64 Advanced Micro Devices, Inc.: Company Snapshot
Figure 65 ARM Ltd.: Company Snapshot
Figure 66 Imagination Technologies Limited: Company Snapshot
The total visual computing market is expected to grow from USD 4.19 Billion in 2013 to USD 22.02 Billion by 2020 at a CAGR of 22.59% between 2015 and 2020. The gaming market was accounted for the largest market share in the market in 2014 while healthcare industry is expected to grow at a highest CAGR of 28.16% during the forecast period.
The report focuses on an in-depth segmentation of this market by different components, display platforms, and applications. The geographic segmentation of the report covers four major regions of the world namely, the Americas, Europe, Asia-Pacific, and Rest of the World (RoW). The regional market has been further broken down by the country.
This report analyzes the findings by considering the market dynamics. These dynamics are categorized under three headers: drivers, restraints, and opportunities. The market estimation and forecasts have been done based on the market dynamics. The report also provides a detailed profiles of various companies those are currently active in the market. In addition to the company profiles, the report also provides a competitive landscape (CL) of key players for the visual computing market.
The report also provides a detailed Porter’s five force analysis for the visual computing market. The analysis gives insights into all factors affecting the market and their impact on its growth.
Please visit 360Quadrants to see the vendor listing of Best Game Development Software Quadrant
Scope of the report:
The report covers the visual computing market on the basis of components, display platforms, industries, and regions.
Visual Computing Market, by Component:
On the basis of the components, the report has been segmented into hardware and software components.
Visual Computing Market, by Display Platform:
On the basis of the display platforms, the report has been segmented into interactive whiteboard, interactive kiosk, interactive table, interactive video wall, and monitor among others.
Visual Computing Market, by Industry:
On the basis of the industries, the report has been categorized into gaming, media & entertainment, healthcare, automotive, manufacturing, and defense & intelligence among others.
Visual Computing Market, by Region:
The geographic analysis covers the Americas, Europe, Asia-Pacific, and Rest of the World (RoW). The cross segmentation data included in the report gives a deep insight about regional markets.
The following customization options are available for the report:
- Country-wise breakdown of all the regions by industry
- Detailed analysis and profiling of five additional market players


Growth opportunities and latent adjacency in Visual Computing Market