Video Wall Market by Product (Video Wall Displays, Housing, Installation, & Content Management), Application (Indoor, Outdoor, Menu Board, & Billboard), Vertical (Retail, Hospitality, Transportation, Healthcare) & Geography - Forecast to 2020


Video walls provide various features, one of them being high-brightness screens; they are designed to release more light than the normal commercial-grade digital signs in the market, which are capable of surviving harsh external usage conditions. These screens are much more robust than the consumer-grade televisions that are commonly supplied to withstand these harsh environments. The video wall technology is emerging in both the developed and developing countries; it has a relatively lower turnaround time in the developing countries as this technology is available at higher prices with respect to the concerned economy.
As far as the strategic focus areas for key players are considered, the most important area to focus on would be technology innovations and new product developments rather than the existing product developments. This is because striving for product differentiation would boost a player ahead in the competition in the current scenario. The key to survival in the video wall ecosystem is to focus on the industry relations with the OEM giants, pure technology solution providers, and software providers; whereas, relations with the government or private legislative & regulatory bodies are a must in the display industry.
The scope of this report consists of the total video wall market including the products and services segment. As such, the term “video wall market” and its statistics, wherever mentioned, refers to the markets for the products and services segment in four major applications such as indoor advertisement, outdoor advertisement, menu board advertisement, and billboard advertisement across verticals such as retail, retail banking, quick service restaurants, corporate, government, entertainment, hospitality, healthcare, transportation, and education.
The video wall market size is expected to grow from $4,118.03 million in 2013 to $17,956.26 million by 2020 at a CAGR of 23.44% (2014-2020). Newer applications and uses are continuously being devised for this technology, which would further propel the market in the coming five years. This growth is heralded by the growing hospitality segment for the video wall market.
Some of the major players included in this market are Adflow Networks (Canada), AU Optronics Corp (Taiwan), Philips N.V. (The Netherlands), LG Display Co. Ltd. (South Korea), Navori SA (Switzerland), NEC Display Solutions (U.S.), Omnivex Corporation (Canada), Panasonic Corporation (Japan), Samsung Electronics Co. Ltd. (South Korea), and Sony Corporation (Japan).
Market segments and aspects covered:
The figure below entails the aspects covered in the video wall market report. This diagram depicts the total scope of the report.
Video Wall Market Aspects Covered
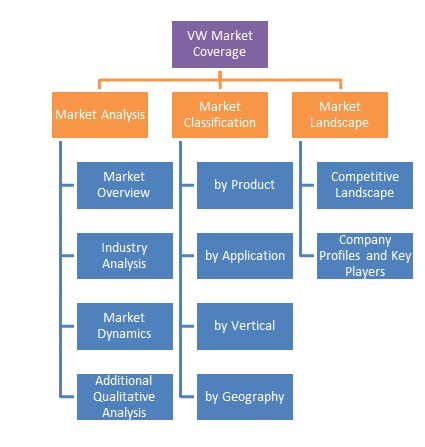
The figure above shows the various aspects covered in this research study on the video wall market. Three major aspects of the complete market are covered in this report. They are the Market Analysis, Market Classification, and Market Landscape. Market Overview and Industry Analysis, along with Market Dynamics and additional qualitative analysis account for the Market Analysis section. On the other hand, the Market Classification section encompasses the segmentation & sub-segmentation of the market by end-users, types, applications, and geography. Lastly, the Market Landscape section covers the detailed competitive landscape and company profiles of all the key players across the ecosystem.
Video wall is the next generation technology in the display industry, which helps in improving customers’ reach with multi-monitor setups. The quality of video wall is determined by measures such as brightness as well as contrast of the displays. This report, has been defined as the technology which is implemented with different types of products and services available for various applications such as indoor, outdoor, menu board, and billboard advertisements.
The report segments the video wall market on the basis of different products, applications, verticals, and geographies. Furthermore, it contains revenue forecasting and analyses trends of the market. The segments and sub-segments in the report contain the drivers, restraints, opportunities, current market trends, and technologies expected to revolutionize the video wall domain. An explosive growth in the number of players, mainly among the product and service providers and vast developments, is expected to take place over the next five years with the migration of established players to this ecosystem, owing to the huge revenue potential offered and the success of video walls.
The report describes the market trends, drivers, and challenges of the video wall market and forecasts the market till 2020, based on the products, applications, verticals, and geographies. It covers the future of the global market & industry from both the technical- and market-oriented perspectives with the techno-market oriented roadmaps till 2020. It also provides a detailed competitive landscape with the identification of the key players with respect to each type of market, in-depth market share analysis with individual revenue, market shares, and market share rankings. It covers geographies such as North America, Europe, APAC, and RoW (Rest of the World).
Some of the major players in this market include Adflow Networks (Canada), AU Optronics Corp (Taiwan), Philips N.V. (The Netherlands), LG Display Co. Ltd. (South Korea), Navori SA (Switzerland), NEC Display Solutions (U.S.), Omnivex Corporation (Canada), Panasonic Corporation (Japan), Samsung Electronics Co. Ltd. (South Korea), and Sony Corporation (Japan).
Figure 1 Video Wall Market (2013–2020)
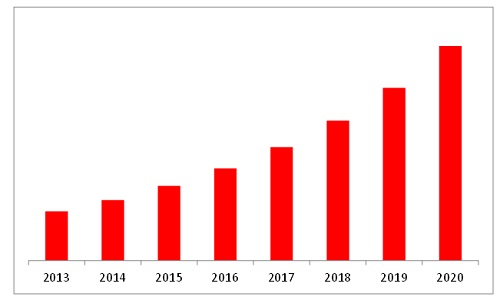
The overall video wall market is growing at a CAGR of 23.44% from 2014 to 2020. In this market, transportation is the major vertical, which is followed by the hospitality and healthcare verticals. In the geographic analysis, North America is the market leader, which is followed by Europe and APAC.
 Exclusive indicates content/data unique to MarketsandMarkets and not available with any competitors.
Table of Contents
1 Introduction (Page No. - 16)
1.1 Objectives of the Study
1.1 Market Definition
1.2 Market Scope
1.2.1 Markets Covered
1.2.2 Year Consideration
1.3 Currency
1.4 Limitation
1.5 Stakeholders
2 Research Methodology (Page No. - 19)
2.1 Introduction
2.1.1 Secondary Data
2.1.1.1 Key Data From Secondary Sources
2.1.2 Primary Data
2.1.2.1 Key Data From Primary Sources
2.1.2.2 Key Industry Insights
2.2 Demand analysis
2.2.1 Introduction
2.2.2 Demand-Side analysis
2.2.2.1 Growth in the Digital Signage Market
2.2.2.2 Digital Signage and Professional Displays’ Shipments to Grow in the Retail Market
2.3 Market Size Estimation
2.3.1 Bottom-Up Approach
2.3.2 top-Down Approach
2.4 Market Breakdown & Data Triangulation
2.5 Research assumptions and Limitations
2.5.1 assumptions
3 Executive Summary (Page No. - 28)
4 Premium Insights (Page No. - 33)
4.1 attractive Market Opportunities in the Video Wall Market
4.2 Growth of Different Applications In the Video Wall Market
4.3 Video Wall Market in North America
4.4 North America Accounts for one-Third of the Market Share In 2014
4.5 Market: Technologies (2014)
4.6 Market: Developed vs. Developing Nations
5 Market Overview (Page No. - 39)
5.1 Introduction
5.2 Evolution
5.3 Market Segmentation
5.3.1 By Product & Service
5.3.2 By Application
5.3.3 By Vertical
5.4 Market Dynamics
5.4.1 Drivers
5.4.1.1 Advanced User-Friendly Video Walls
5.4.1.2 Progression in the Educational & Government Sectors
5.4.1.3 Abridgment of the Prices In Displays
5.4.1.4 Adoption of Innovative Technologies at Airports
5.4.2 Restraints
5.4.2.1 Higher Initial Investments
5.4.2.2 Poor Quality of Video Walls
5.4.2.3 Variable Power Supplies
5.4.3 Opportunities
5.4.3.1 A Surging Demand for the High Interactive Digital Signage Systems — Video Walls
5.4.3.2 Emerging 3d Video Walls
5.4.4 Challenges
5.4.4.1 Burn-In issue Complications
5.4.4.2 Restricted Advertisement Space
6 Industry Trends (Page No. - 49)
6.1 Introduction
6.2 Value Chain analysis
6.3 Porter’s Five forces analysis
6.3.1 Threat of New Entrants
6.3.2 Threat of Substitutes
6.3.3 Bargaining Power of Suppliers
6.3.4 Bargaining Power of Buyers
6.3.5 Intensity of Competitive Rivalry
6.4 Strategic Benchmarking
6.4.1 Technology Integration & Product Enhancement
7 Video Wall Market By Product & Service (Page No. - 58)
7.1 Introduction
7.2 Video Wall Displays
7.2.1 Market By Technology
7.2.1.1 Led Video Wall Display Modules
7.2.1.2 Lcd Video Wall Display Modules
7.3 Housing
7.4 Installation
7.5 Content Management
8 Video Wall Market By Application (Page No. - 77)
8.1 Introduction
8.2 Indoor Advertisement
8.3 Outdoor Advertisement
8.4 Menu Board Advertisement
8.5 Billboard Advertisement
9 Video Wall Market By Vertical (Page No. - 95)
9.1 Introduction
9.2 Retail
9.3 Retail Banking
9.4 Quick Service Restaurants (QSR)
9.5 Corporate
9.6 Government
9.7 Entertainment
9.8 Hospitality
9.9 Healthcare
9.1 Transportation
9.11 Education
10 Market, By Geography (Page No. - 118)
10.1 Introduction
10.2 North America
10.3 Europe
10.3.1 Drivers
10.3.1.1 Increasing Adoption of Dooh in the Region
10.3.1.2 Shrinking Prices of the Flat Panel Devices
10.3.2 Restraints
10.3.2.1 Looming Financial Uncertainty
10.3.2.2 High Cost of Labor
10.4 APAC
10.4.1 Drivers
10.4.1.1 Retail Boom in APAC
10.4.1.2 Low Cost of Labor
10.4.1.3 High Untapped Growth Opportunity
10.4.1.4 Increasing Demand in the Retail Sector
10.4.2 Restraints
10.4.2.1 Less Awareness
10.4.2.2 The Average Per Capita Income is Low
10.5 ROW
10.5.1 Drivers
10.5.1.1 Investment-Friendly Ecosystem
10.5.1.2 Lesser Competition
10.5.1.3 Simplified Taxes
11 Competitive Landscape (Page No. - 139)
11.1 Overview
11.2 Market Share analysis—Video Wall Market
11.2.1 Other Market Share analysis Based on Segments, 2013
11.2.1.1 Housing—Market Share analysis, 2013
11.2.1.2 Content Management—Market Share analysis
11.3 Competitive Situation and Trends
11.3.1 New Product Launches
11.3.2 Agreements, Partnerships, Collaborations & Joint Ventures
11.3.3 Mergers & Acquisitions
11.3.4 Expansions
11.3.5 Others
12 Company Profiles (Page No. - 148)
12.1 Introduction
12.2 Adflow Networks
12.3 AU Optronics Corp.
12.4 Koninklijke Philips N.V.
12.5 LG Display Co. Ltd.
12.6 Navori SA
12.7 NEC Display Solutions
12.8 Omnivex Corporation
12.9 Panasonic Corporation
12.1 SAmsung Electronics Co. Ltd.
12.11 Sony Corporation
13 Appendix (Page No. - 175)
13.1 Insights of Industry Experts
13.2 Discussion Guide
13.3 Introducing Rt: Real-Time Market Intelligence
13.4 Available Customizations
13.5 Related Reports
List of Tables (74 Tables)
Table 1 The Decreasing Prices of Displays is Propelling the Growth of the Digital Signage Market
Table 2 The Lack of Standardization is Hampering the Growth of the Digital Signage Display Market
Table 3 The Exploration of the Interactive Capabilities of Dss is A Huge Opportunity for the Future Growth of the Digital Signage Market
Table 4 Video Wall Market Size for Digital Signage, 2014–2020 ($ Million)
Table 5 Market Size, By Product & Service, 2013–2020 ($ Million)
Table 6 Video Wall Display Market Size for Digital Signage, By Application,2013–2020 ($ Million)
Table 7 Video Wall Display Market Size for Digital Signage, By Application,2013–2020 (Thousand Units)
Table 8 Market Size for Digital Signage, By Vertical,2013–2020 ($ Million)
Table 9 Market Size for Digital Signage, By Vertical,2013–2020 (Thousand Units)
Table 10 Video Wall Market Size for Housing, By Application,2013–2020 ($ Million)
Table 11 Market Size for Housing, By Vertical, 2013–2020 ($ Million)
Table 12 Video Wall Market Size for Installation, By Application,2013–2020 ($ Million)
Table 13 Market Size for Installation, By Vertical,2013–2020 ($ Million)
Table 14 Video Wall Market Size for Content Management, By Application,2013–2020 ($ Million)
Table 15 Market Size for Content Management, By Vertical,2013–2020 ($ Million)
Table 16 Video Wall Market Size for Digital Signage, By Application,2013–2020 ($ Million)
Table 17 Market Size for Digital Signage, By Application,2013–2020 (Thousand Units)
Table 18 Video Wall Market Size for Indoor Advertising, By Product Type,2013–2020 ($ Million)
Table 19 Market Size for Indoor Advertising, By Vertical,2013–2020 ($ Million)
Table 20 Market Size for Indoor Advertising, By Vertical,2013–2020 (Thousand Units)
Table 21 Video Wall Market Size for Outdoor Advertising, By Product Type,2013–2020 ($ Million)
Table 22 Market Size for Outdoor Advertising, By Vertical,2013–2020 ($ Million)
Table 23 Market Size for Outdoor Advertising, By Vertical,2013–2020 (Thousand Units)
Table 24 Video Wall Market Size for Menu Board Advertising, By Product Type, 2013–2020 ($ Million)
Table 25 Market Size for Menu Board Advertising, By Vertical,2013–2020 ($ Million)
Table 26 Market Size for Menu Board Advertising, By Vertical,2013–2020 (Thousand Units)
Table 27 Video Wall Market Size for Billboard Advertising, By Product Type, 2013–2020 ($ Million)
Table 28 Market Size for Billboard Advertising, By Vertical,2013–2020 ($ Million)
Table 29 Market Size for Billboard Advertising, By Vertical,2013–2020 (Thousand Units)
Table 30 Video Wall Market Size for Digital Signage, By Vertical,2013–2020 ($ Million)
Table 31 Market Size for Digital Signage, By Vertical,2013–2020 (Thousand Units)
Table 32 Video Wall Market Size for Retail, By Application, 2013–2020 ($ Million)
Table 33 Market Size for Retail, By Application,2013–2020 (Thousand Units)
Table 34 Market Size for Retail, By Application, 2013–2020 ($ Million)
Table 35 Market Size for Retail, By Application,2013–2020 (Thousand Units)
Table 36 Video Wall Market Size for Quick Service Restaurants, By Application, 2013–2020 ($ Million)
Table 37 Market Size for Quick Service Restaurants, By Application, 2013–2020 (Thousand Units)
Table 38 Video Wall Market Size for the Corporate Sector, By Application,2013–2020 ($ Million)
Table 39 Market Size for the Corporate Sector, By Application,2013–2020 (Thousand Units)
Table 40 Video Wall Market Size for Government, By Application,2013–2020 ($ Million)
Table 41 Market Size for Government, By Application,2013–2020 (Thousand Units)
Table 42 Video Wall Market Size for Entertainment, By Application,2013–2020 ($ Million)
Table 43 Market Size for Entertainment, By Application,2013–2020 (Thousand Units)
Table 44 Video Wall Market Size for Hospitality, By Application,2013–2020 ($ Million)
Table 45 Market Size for Hospitality, By Application,2013–2020 (Thousand Units)
Table 46 Video Wall Market Size for Healthcare, By Application,2013–2020 ($ Million)
Table 47 Market Size for Healthcare, By Application, 2013–2020 (Thousand Units)
Table 48 Video Wall Market Size for Transportation, By Application, 2013–2020 ($ Million)
Table 49 Market Size for Transportation, By Application, 2013–2020 (Thousand Units)
Table 50 Video Wall Market Size for Education, By Application, 2013–2020 ($ Million)
Table 51 Market Size for Education, By Application, 2013–2020 (Thousand Units)
Table 52 Video Wall Market Size, By Region, 2013–2020 ($ Million)
Table 53 Market Size, By Region, 2013–2020 (Million Units)
Table 54 Video Wall Market Size for Indoor Advertising, By Region, 2013–2020 ($ Million)
Table 55 Market Size for Outdoor Advertising, By Region, 2013–2020 ($ Million)
Table 56 Market Size for Menu Board Advertising, By Region, 2013–2020 ($ Million)
Table 57 Market Size for Billboard Advertising, By Region, 2013–2020 ($ Million)
Table 58 North America: Video Wall Market Size, By Region, 2013–2020 ($ Million)
Table 59 North America: Market Size, By Country, 2013–2020 (Million Units)
Table 60 North America: Market Size, By Application, 2013–2020 ($ Million)
Table 61 Europe: Video Wall Market Size, By Country, 2013–2020 ($ Million)
Table 62 Europe: Market Size, By Country,2013–2020 (Million Units)
Table 63 Europe: Market Size, By Application, 2013–2020 ($ Million)
Table 64 APAC: Video Wall Market Size, By Country, 2013–2020 ($ Million)
Table 65 APAC: Market Size, By Country, 2013–2020 (Million Units)
Table 66 APAC: Market Size, By Application, 2013–2020 ($ Million)
Table 67 ROW: Video Wall Market Size, By Country, 2013–2020 ($ Million)
Table 68 ROW: Market Size, By Country, 2013–2020 (Million Units)
Table 69 ROW: Market Size, By Application, 2013–2020 ($ Million)
Table 70 New Product Launches, 2014
Table 71 Agreements, Partnerships, Collaborations & Joint Ventures, 2013–2014
Table 72 Mergers and Acquisitions, 2011–2014
Table 73 Expansions, 2012 and 2013
Table 74 Awards, 2014
List of Figures (102 Figures)
Figure 1 Video Wall Market, By Vertical
Figure 2 Research Design
Figure 3 Breakdown of Primary Interviews: By Company Type, Designation & Region
Figure 4 Growing Digital Signage Market
Figure 5 Digital Signage and Display Shipments forecast, 2012–2018
Figure 6 Market Size Estimation Methodology: Bottom-Up Approach
Figure 7 Market Size Estimation Methodology: top-Down Approach
Figure 8 Market Size For Digital Signage, By Vertical,2013–2020 ($ Million)
Figure 9 Market Snapshot (2014 vs 2020): the Market for Transportation is Expected to Double During forecast Period
Figure 10 Market, By Application, 2014
Figure 11 Market Share, 2014
Figure 12 Emerging Market Opportunities in the Video Wall Market
Figure 13 The Outdoor Application to Grow at A Faster Rate in the Video Wall Market
Figure 14 The Outdoor Advertisement Application Captures the Largest Share in the Emerging North Amrican Market in 2014
Figure 15 North America Commands Over one-Third of the Market Share
Figure 16 The North American Region to Dominate the Video Wall Market for All the Segments
Figure 17 The Developing Markets to Grow Two Times Faster Than the Developed ones
Figure 18 Evolution of the Video Walls
Figure 19 Market Segmentation: By Product & Service
Figure 20 Market: By Application
Figure 21 Market: By Vertical
Figure 22 The Video Wall Market to Exhibit A Lucrative Growth Potential By 2020
Figure 23 Value Chain analysis: Major Value is Added During the Development and Integration Phases of the Video Wall Systems
Figure 24 Porter’s Five forces analysis for the Digital Signage Market
Figure 25 Threat of New Entrants
Figure 26 Threat of Substitutes
Figure 27 Bargaining Power of Suppliers
Figure 28 Bargaining Power of Buyers
Figure 29 Intensity of Rivalry
Figure 30 Products & Services of the Video Wall Market
Figure 31 The Services Market is Expected to Grow Highly in the Video Wall Market Till 2020
Figure 32 Market Size for the Video Wall Products & Services, 2013–2020
Figure 33 Key Measurements of High Brightness — Video Wall Digital Displays
Figure 34 The Indoor Advertisment Application is Expected to Grow Highly in Video Wall Display Market till 2020. Figure 35 The Indoor Advertisment Application is Expected to Grow Rapidly in the Video Wall Display Market By 2020
Figure 36 The Retail Vertical is Expected to Grow Highly in the Video Wall Displays Between 2013 and 2020
Figure 37 The Led Technology is Expected to Be the Alternative Technology By 2020
Figure 38 The Indoor Advertisement Application is Expected to Grow Highly in the Housing Products Between 2013 and 2020
Figure 39 The Transportation Vertical is Expected to Grow Highly in the Housing Products Between 2013 and 2020
Figure 40 Factors to Be Considered for the Proper Installation of Displays
Figure 41 The Indoor Advertisement Application is Expected to Grow Rapidly in the Installation Service Between 2013 and 2020
Figure 42 Tasks Under Content Management Services
Figure 43 The Indoor Advertisement Application is Expected to Grow Highly
in the Content Management Service Between 2013 and 2020
Figure 44 Different Applications for the Video Wall Displays
Figure 45 The Indoor Advertising Application is Expected to Grow Rapidly Between 2014 and 2020
Figure 46 Menu Board Advertising Application Market Size in Terms of Volumeis Expected to Grow Rapidly Between 2014 and 2020
Figure 47 The Hospitality Vertical Would Dominate the Market for the Indoor Advertisement Application By 2020
Figure 48 Content Management is Expected to Grow Rapidly in the Outdoor Advertisement Till 2020
Figure 49 The Indoor Advertisement Application Has A High Growth Rate in the Video Wall Market
Figure 50 The Housing Products Are Expected to Grow at A Fast Pace in the Menu Board Advertisement Market Between 2014 and 2020
Figure 51 The Installation Service is Expected to Grow Faster in the Service Segment for the Menu Board Advertisement Market
Between 2014 and 2020
Figure 52 The Market for the Menu Board Advertisement Application is Expected to Grow Fast in the Qsr Industry Between 2014 and 2020
Figure 53 The Housing Products Are Expected to Grow Faster in the Market for the Billboard Application Between 2014 and 2020
Figure 54 The Content Management Service is Expected to Grow Fast in the Service Segment for the Billboard Application Market Between 2014 and 2020
Figure 55 The Transportation Vertical is Expected to Dominate the Video Wall Display Market for Digital Signage By 2020
Figure 56 The Indoor Application is Expected to Grow Faster in the Retail Industry Between 2014 and 2020
Figure 57 The Outdoor Application is Expected to Dominate the Retail Banking Industry By 2020
Figure 58 The Indoor Application is Expected to Grow Fast in the Qsr Industry Between 2014 and 2020
Figure 59 The Outdoor Application is Expected to Dominate the Corporate Industry By 2020
Figure 60 The Outdoor Application is Expected to Dominate the Government Industry By 2020
Figure 61 The Menu Board Advertisement Application is Expected to Grow Fast in the Entertainment Industry Between 2014 and 2020
Figure 62 The Outdoor Advertisement Application is Expected to Dominate the Hospitality Sector By 2020
Figure 63 The Outdoor Advertisement Application is Expected to Dominate the Healthcare Sector By 2020
Figure 64 The Outdoor Advertisement Application is Expected to Grow Fast in the Transportation Sector Between 2014 and 2020
Figure 65 The Indoor Advertisement Application is Expected to Grow Fast in the Education Sector Between 2014 and 2020
Figure 66 Market, By Geography
Figure 67 Geographic Snapshot (2014)—the Rapidly Growing Markets Are Emerging as the New Hotspots
Figure 68 APAC is an attractive Region for All the Applications to Grow
Figure 69 APAC Region Expected to Grow at the Fastest Rate During the forecast Period
Figure 70 APAC to Show A Favorable Growth in the Video Wall Market for the Indoor Advertisement
Figure 71 North America Occupies A Major Market of the Outdoor Advertisement in 2014
Figure 72 The Menu Board Advertisement is Expected to Show an Exponential Growth in North America By 2020
Figure 73 Billboard Advertisement to Grow at the Highest Cagr in the APAC Region
Figure 74 North American Market Snapshot: the Demand Would Be Driven By the Outdoor Advertisement Application
Figure 75 The U.S. to Drive the North American Video Wall Market
Figure 76 Canada to Grow at the Highest Cagr By 2020
Figure 77 Germany to Show an Exponential Growth in Europe By 2020
Figure 78 APAC Video Wall Market Snapshot—China Holds the Most attractive Video Wall Market in This Region
Figure 79 The Chinese Video Wall Market to Grow By 2020
Figure 80 the Middle East Would Show an Exponential Growth By 2020
Figure 81 Companies Adopted Product Innovation, Ts, and Collaborations as the Key Growth Strategy Between 2011 and 2014
Figure 82 LG Display Co., Ltd. Accounted for the Largest Share Between 2010 and 2013
Figure 83 Market Share, By Key Player, 2013
Figure 84 Housing Market Share analysis
Figure 85 Content Management Share analysis, 2013
Figure 86 Battle for Market Share: New Product Launches Was the Key Strategy Adopted Between 2011 and 2014
Figure 87 Battle for the Market Share: New Product Launches Was the Key Strategy
Figure 88 Geographic Revenue Mix of the top Five Market Players
Figure 89 Competitive Benchmarking of the Key Market Players: Smasung Electronics as the Dark Horse in Terms of CAGR for 2011-2013
Figure 90 Adflow Networks: Company Snapshot
Figure 91 AU Optronics Corp.: Company Snapshot
Figure 92 AU Optronics Corp: SWOT analysis
Figure 93 Koninklijke Philips N. V.: Company Snapshot
Figure 94 LG Display Co. Ltd.: Company Snapshot
Figure 95 LG Display Co. Ltd.: SWOT analysis
Figure 96 Navori SA: Company Snapshot
Figure 97 NEC Display Solutions: Company Snapshot
Figure 98 Omnivex Corporation: Company Snapshot
Figure 99 Panasonic Corporation.: Company Snapshot
Figure 100 Panasonic Corporation: SWOT analysis
Figure 101 SAmsung Electronics Co. Ltd.: Company Snapshot
Figure 102 Sony Corporation: Company Snapshot
This market research report on the global video wall market employs a hybrid approach that combines both primary and secondary research methods to ensure comprehensive and accurate insights. Primary research was conducted through in-depth interviews and surveys with key industry participants, including manufacturers, distributors, system integrators, and end users across various sectors such as retail, transportation, entertainment, and corporate environments.
Secondary research involved the systematic review of credible sources such as annual reports, industry white papers, government publications, international trade data, and reputable databases including Statista, IDC, and MarketsandMarkets. This secondary data helped validate and triangulate findings from primary research and provided historical and contextual insights into market dynamics and trends.
The market sizing and forecasting were carried out using a bottom-up approach, taking into account the revenue and unit shipment data of key players in the market. These figures were aggregated to estimate the overall market value and volume, followed by segmentation analysis by type (LCD, LED, OLED, etc.), application, end-use industry, and region. Forecasts were generated for the period from 2025 to 2030 using time-series modeling and demand-supply gap analysis.
To ensure robustness, the data was cross-verified through multiple validation steps and scenario-based modeling. Sensitivity analysis was applied to assess the impact of fluctuating macroeconomic indicators, technological advancements, and regulatory changes on market projections. Assumptions used in the models were based on current industry conditions, historical data trends, and expert interviews.
Furthermore, Porter’s Five Forces framework and SWOT analysis were used to evaluate the competitive landscape, market structure, and strategic positioning of key market players. The report also integrates qualitative insights into consumer behavior, purchasing patterns, and technological adoption to contextualize quantitative findings.
This multi-dimensional methodology ensures that the final report offers actionable insights and reliable forecasts, supporting stakeholders in strategic planning, investment decisions, and market entry or expansion strategies within the video wall industry.


Growth opportunities and latent adjacency in Video Wall Market