The study involved four major activities in estimating the current size of the FSO & VLC/Li-Fi market —exhaustive secondary research collected information on the market and its peer and parent markets. The next step was to validate these findings, assumptions, and sizing with industry experts across the value chain through primary research. Both top-down and bottom-up approaches were employed to estimate the total market size. After that, market breakdown and data triangulation were used to estimate the market size of segments and subsegments.
Secondary Research
Various secondary sources have been referred to in the secondary research process for identifying and collecting information important for this study. These secondary sources include FSO & VLC/Li-Fi technology journals and magazines, annual reports, press releases, investor presentations of companies, white papers, certified publications and articles from recognized authors, and directories and databases such as Factiva, Hoovers, and OneSource.
Primary Research
Various primary sources from both supply and demand sides have been interviewed in the primary research process to obtain qualitative and quantitative information important for this report. The primary sources from the supply side included industry experts such as CEOs, VPs, marketing directors, technology and innovation directors, and related executives from key companies and organizations operating in the FSO & VLC/Li-Fi market. After complete market engineering (including calculations regarding market statistics, market breakdown, market size estimations, market forecasting, and data triangulation), extensive primary research was conducted to gather information as well as to verify and validate the critical numbers arrived at.
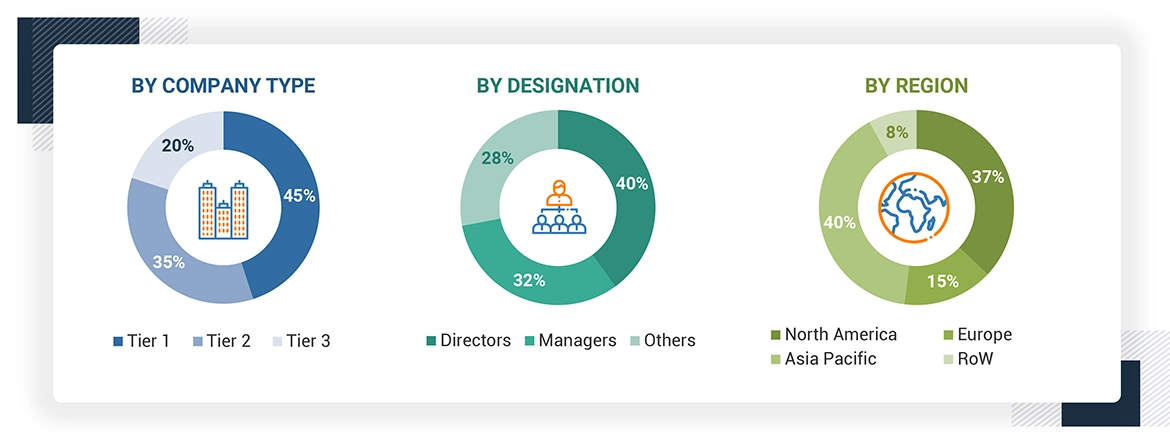
Note: Other designations include sales, marketing, and product managers. Tier 1 = USD 1 billion, Tier 2 = USD 0.5–1.0 billion, and Tier 3 = USD 0.5 billion.
About the assumptions considered for the study, To know download the pdf brochure
Market Size Estimation
In the complete market engineering process, both top-down and bottom-up approaches have been implemented, along with several data triangulation methods, to estimate and validate the size of the FSO & VLC/Li-Fi market and other dependent submarkets listed in this report.
-
Extensive secondary research has identified key players in the industry and market.
-
In terms of value, the industry’s supply chain and market size have been determined through primary and secondary research processes.
-
All percentage shares, splits, and breakdowns have been determined using secondary sources and verified through primary sources.
FSO & VLC / Li-Fi Market : Top-Down and Bottom-Up Approach
Data Triangulation
After arriving at the overall market size from the estimation process explained above, the global market has been split into several segments and subsegments. Market breakdown and data triangulation procedures have been employed wherever applicable to complete the overall market engineering process and arrive at exact statistics for all segments and subsegments. The data has been triangulated by studying various factors and trends identified from both the demand and supply sides.


 HIGHEST CAGR MARKET IN 2024-2030
 SOUTH KOREA FASTEST-GROWING MARKET IN THE REGION


Kes
Oct, 2017
Does this FSO report include data by the country? I have seen some report aggregator/reseller has similar report for different regions by country. But I prefer to buy from the original publisher. Also, the number of companies included seems to be a subset in the market (as compared and mentioned by those other reports). Is this the most up to date version?.
tien
Sep, 2014
I am interested in the below mentioned report: Visible Light Communication (VLC)/Light Fidelity (Li-Fi) & Free Space Optics (FSO) Market by Component, Applications (Terrestrial, Mobile, & Satellite for FSO & Communication, Automotive, Healthcare, Aerospace, & Underwater for VLC/Li-Fi), & Geography - Analysis & Forecast to 2014 - 2020.
Varun
Jun, 2017
Want to learn about the global FSO market. Particularly, who are the key players? How much are they charging? Where is the max opportunity?.
Jean-Philippe
Feb, 2016
I am writing a news article about LIFI. Can you share the VLC market research report please ? Do you update it yearly ?.
Jonas
Mar, 2016
I am a young online marketer and happen to be curious about Life. Do you have some cheaper option for learning more about Life? ($4k is way above my budget).
Josane
Feb, 2019
I want more information about consumer electronics application of FSO market report..
Chien-Ta
Dec, 2013
I am interested in the following sections of the report Visible light communication, wavelength dividing multiplexing, interference rejection, algorithm development..
Manoj
Nov, 2016
We would be interested in the Global report of FSO added by in depth study in Asia & India Market. I am and individual (Senior Citizen) doing Free Social Service in the Education sector and humbly request you to offer me the best commercial terms for my perusal. Your kind co-operation in the matter shall be highly appreciated. Awaiting your early reply per return and oblige..
RAFAEL
May, 2015
We are researching on VLC from 2004 and we have created a spin-off company working on wireless optics..
Rita
Mar, 2019
I would like to get some information of the FSO market breakdown by applications..
David
Feb, 2013
My interest is in the FSO Communications market outlook. Any/all information focused around this would be great..
Mathew
Dec, 2014
Seeking to obtain as much information as possible on Light fidelity, home automation, and Visible Light Communications; along with any other related information..
abdelmoula
Nov, 2019
I need this catalogue: VISIBLE LIGHT COMMUNICATION (VLC)/Li-Fi TECHNOLOGY & FREE SPACE OPTICS (FSO) MARKET (2013 � 2018)..
Jason
Oct, 2015
I want a more detailed explanation as to what have you added in the component section..
Gwen
Oct, 2015
We are interested in the following: Visible Light Communication (VLC) Market by Component, Application (Smart Store, Consumer Electronics, Defense, Transportation, Aviation, Hospital, Underwater, and Hazardous Environment), and by Geography - Global forecast to 2020.
Amit
Oct, 2015
My final year seminar topic is based on Li-Fi Technology and thinking of doing project on this topic. Can you please provide free sample of report?.
Najibu
Aug, 2019
Do you provide only the information related to applications of FSO market?.
Marwa
Jun, 2016
I am interested in the report: Free Space Optics (FSO) and Visible Light Communication (Li Fi) Market by Component, Application (Smart Store, Consumer Electronics, Defense, Transportation, Aviation, Hospital, Underwater, and Hazardous Environment), and by Geography - Global forecast .
Sameer
Jun, 2015
VLC Communication in USA & France. Want to know the list of companies profiled specifically for US & France Market..
Sahar
Jun, 2016
We need to make a network using FSO in some desert area for new investments..
Wojciech
Jan, 2015
I would like to get access to the FSO & VLC report because I am writing a report about VLC for studies..