Virtual Power Plant Market

Virtual Power Plant Market by Technology (Demand Response, Supply Side, Mixed Asset), Vertical (Commercial, Industrial, Residential), Source (Renewable Energy, Storage, Cogeneration), Offering, & Region- Global Forecast to 2029

Report Code: EP 5131 Jan, 2024, by marketsandmarkets.com

[200 Pages Report] The global virtual power plant market in terms of revenue was estimated to be worth $1.9 billion in 2024 and is poised to reach $5.5 billion by 2029, growing at a CAGR of 23.4% from 2024 to 2029. Growth in the smart grid directly influences the virtual power plant market. Additionally, factors such as an increasing share of renewable energy, declining costs of solar generation and energy storage, and a shift from centralized to distributed generation drive market expansion. However, concerns about health safety related to electromagnetic field (EMF) and radiofrequency (RF) exposure may limit growth, and cybersecurity issues pose significant challenges. Despite these constraints, the rising demand for electric vehicles presents promising opportunities for the virtual power plants market.

Virtual Power Plant Market

To know about the assumptions considered for the study, Request for Free Sample Report

Virtual Power Plant Market

To know about the assumptions considered for the study, download the pdf brochure

Virtual Power Plant Market Dynamics

Driver: Seamless integration with renewable sources such as solar and wind

The demand for virtual power plants (VPPs) is increasing rapidly owing to their ability in reducing carbon emissions by optimizing decentralized energy resources. As there is a shift toward sustainable energy, VPPs have emerged as a vital solution. They can seamlessly integrate diverse renewable sources such as solar and wind, which aligns with the need to move away from fossil fuels. Governments, utilities, and industries are investing in VPPs to meet carbon reduction goals. This investment comes as distributed energy resources become more popular and awareness about climate change grows. Economic factors also contribute to the rise of VPPs. In the changing energy landscape characterized by decentralization, the demand for VPPs is likely to grow. This growth will result in a cleaner and more sustainable energy future.

Restraint: Requirement of high investments to deploy monitoring and control systems and predictive analysis

The establishment and operation of VPPs face complexities and high initial investments that can act as significant obstacles to wider adoption. They integrate different distributed energy resources, like solar panels, wind turbines, and energy storage systems, into a unified and coordinated network. The complexity arises from the need to manage these heterogeneous assets efficiently, considering their variable outputs and diverse technical characteristics. Coordinating the operation of these resources to meet demand in real-time requires advanced control systems and sophisticated algorithms, causing hindrance in VPP deployment. Moreover, the upfront investment required for the infrastructure, technology, and software needed to establish a VPP can be a significant restraint for the market growth.

Opportunities: Growing deployment of smart grids

The growing deployment of smart grids provides opportunities for the virtual power plant market by enabling the integration of distributed energy resources (DERs) and the optimization of their use. Smart grids are defined as the integration of power, communications, and information technologies for an improved electric power infrastructure serving loads while enabling the integration of DERs. DERs present more modular, scalable, and flexible generation of energy, and the smart grid allows for their seamless integration at the transmission and distribution levels.

Challenges: Integration of different hardware and software components in VPP

The integration of different hardware and software components in VPPs poses a complex set of technical challenges. VPPs aggregate various DERs, including solar panels, wind turbines, and energy storage systems, often from various manufacturers and operating on different communication protocols. Coordinating these elements to work effectively in unison is challenging.

Ensuring interoperability with existing grid control systems adds another layer of complexity since these systems might use different standards and protocols. Bridging the gap between different communication languages and technologies is crucial for the efficient exchange of data and control signals. Additionally, the real-time nature of VPP operations requires rapid data processing, demanding sophisticated algorithms and optimized computing resources to maintain responsiveness. The security of sensitive energy-related data, compliance with privacy regulations, and the scalable expansion of the VPP further contribute to the challenges. Overcoming these challenges requires a comprehensive approach, including standardized communication frameworks, robust cybersecurity measures, and collaboration with regulatory bodies and grid operators to establish interoperable and compliant VPP systems.

Virtual Power Plant Market Ecosystem

Leading companies in this market include well-established, financially secure producers of virtual power plant. These corporations have been long operating in the market and have a differentiated product portfolio, modern manufacturing technologies, and robust sales and marketing networks. Major companies in this market include Siemens (Germany), Schneider Electric (France), General Electric (US), Shell (UK), Tesla (US).

Virtual Power Plant Market

The mixed asset segment is expected to be the largest market by technologies during the forecast period.

By technologies, the virtual power plant market is divided into demand response, supply side, and mixed assets. The mixed asset segment is expected to be the largest in the virtual power plants market because Mixed asset VPPs can comprise different types of distributed energy resources (DERs), such as renewable generation, battery storage, and power consumers. As DER costs continue to decline, more DERs are being connected to the grid, and VPP platforms are being employed to ensure that interconnected devices remain stable.

By source, the renewable energy segment is expected to be the largest segment during the forecast period.

This report segments the virtual power plant market based on sources into renewable energy, storage, cogeneration, automotive, manufacturing, medical devices, and others. The renewable energy segment is expected to be the largest in the market. Integrating renewable energy sources into the VPP market significantly advances the transition toward a more sustainable energy ecosystem. With the incorporation of renewables such as solar and wind, VPPs diversify the energy mix and contribute to decentralization, thereby reducing dependence on traditional centralized power generation. This shift toward a cleaner and more distributed model enhances grid stability by leveraging the inherent flexibility of renewable resources.

“North America”: The largest in the virtual power plant market.

North America emerges as the largest region in the virtual power plant market. The North American power distribution sector is poised to experience significant growth opportunities due to the increasing shift toward renewable energy sources for power generation. The target of Clean Power Plan of reducing carbon pollution from the power sector by 32% below 2005 levels by 2030 has prompted utilities in the US and Canada to upgrade and replace aging power infrastructure to improve reliability and capacity.

Virtual Power Plant Market Size, and Share

Key Market Players

The market is dominated by a few major players that have a wide regional presence. The major players in the virtual power plant market are Siemens AG (Germany), Shell plc (UK),  Schneider Electric SE (France), Tesla (US). Between 2020 and 2023, strategies such as product launches, contracts, agreements, partnerships, collaborations, alliances, acquisitions, and expansions are followed by these companies to capture a larger share of the market.

Get online access to the report on the World's First Market Intelligence Cloud

  • Easy to Download Historical Data & Forecast Numbers
  • Company Analysis Dashboard for high growth potential opportunities
  • Research Analyst Access for customization & queries
  • Competitor Analysis with Interactive dashboard
  • Latest News, Updates & Trend analysis
Request Sample

Scope of the Report

Report Metric

Details

Market size available for years

2019–2029

Base year considered

2023

Forecast period

2024–2029

Forecast units

Value (USD)

Segments Covered

Vertical, offering, technology, source, and region

Geographies covered

Asia Pacific, North America, Europe, Middle East & Africa, and South America

Companies covered

Siemens (Germany), Schneider Electric (France), General Electric (US), Shell (UK), Tesla (US), ABB (Switzerland), CPower (US), IBM (US), Sonnen (Germany), Generac Power Systems (US), Flexitricity (UK), Olivine Inc. (US), Lumenaza GmbH (Germany), Stem Inc. (US), Open Access Technology International (US), Spirae (US), Argand Solutions (UK), Krakenflex Limited (UK), Haven Energy (US), energy & meteo systems GmbH (Germany)

This research report categorizes the market by vertical, offering, technology, source, and region

On the basis of technology, the Virtual power plant market has been segmented as follows:
  • Demand Response
  • Supply Side
  • Mixed Asset
On the basis of offering, the market has been segmented as follows:
  • Hardware
  • Software
  • Services
On the basis of vertical, the market has been segmented as follows:
  • Commercial
  • Industrial
  • Residential
On the basis of source, the market has been segmented as follows:
  • Renewable Energy
  • Storage
  • Cogeneration
On the basis of region, the market has been segmented as follows:
  • Asia Pacific
  • Europe
  • North America
  • Middle East & Africa
  • South America

Recent Developments

  • In November 2020, Siemens expanded its VPP to an industry with a new contract with Sinebrychoff, a beverage company, serving as a showcase for Siemens' VPP solution, which runs on a software platform.
  • VPP4Islands is a 4-year project aiming to smoothen the integration of renewable generation systems, promote the transition to smarter and cleaner energy, and help islands exploit different approaches to energy efficiency and innovative storage.
  • Schneider Electric is working with Puget Sound Energy and AutoGrid to develop a 100-MW virtual power plant by 2025. This VPP would provide centralized applications for enrolling, dispatching, and assessing the performance of individual and combined programs across PSE's portfolio.
  • Portland General Electric, in partnership with GE, is launching a pilot program to transform 525 homes into a virtual power plant, which will incentivize the installation and connection of residential energy storage batteries to create a virtual power plant made up of small units that can be operated to add flexibility supporting the transition to a clean energy future.

Frequently Asked Questions (FAQ):

To speak to our analyst for a discussion on the above findings, click Speak to Analyst

TABLE OF CONTENTS
 
1 INTRODUCTION (Page No. - 30)
    1.1 STUDY OBJECTIVES 
    1.2 MARKET DEFINITION 
           1.2.1 INCLUSIONS AND EXCLUSIONS
    1.3 STUDY SCOPE 
           1.3.1 MARKETS COVERED
           1.3.2 REGIONAL SCOPE
           1.3.3 YEARS CONSIDERED
    1.4 UNITS CONSIDERED 
    1.5 CURRENCY CONSIDERED 
    1.6 LIMITATIONS 
    1.7 STAKEHOLDERS 
    1.8 SUMMARY OF CHANGES 
    1.9 IMPACT OF RECESSION 
 
2 RESEARCH METHODOLOGY (Page No. - 35)
    2.1 RESEARCH DATA 
           FIGURE 1 VIRTUAL POWER PLANT MARKET: RESEARCH DESIGN
    2.2 DATA TRIANGULATION 
           FIGURE 2 DATA TRIANGULATION
           2.2.1 SECONDARY DATA
                    2.2.1.1 List of major secondary sources
                    2.2.1.2 Key data from secondary sources
           2.2.2 PRIMARY DATA
                    2.2.2.1 Key data from primary sources
                    2.2.2.2 Key industry insights
                    2.2.2.3 Breakdown of primaries
    2.3 MARKET SIZE ESTIMATION 
           2.3.1 BOTTOM-UP APPROACH
                    2.3.1.1 Approach to estimate market size using bottom-up analysis
                               FIGURE 3 MARKET SIZE ESTIMATION METHODOLOGY: BOTTOM-UP APPROACH
           2.3.2 TOP-DOWN APPROACH
                    2.3.2.1 Approach to estimate market size using top-down analysis
                               FIGURE 4 MARKET SIZE ESTIMATION METHODOLOGY: TOP-DOWN APPROACH
           2.3.3 DEMAND-SIDE ANALYSIS
                    2.3.3.1 Calculations for demand-side analysis
                    2.3.3.2 Assumptions for demand-side analysis
           2.3.4 SUPPLY-SIDE ANALYSIS
                    FIGURE 5 KEY STEPS CONSIDERED TO ASSESS SUPPLY OF VIRTUAL POWER PLANTS
                    FIGURE 6 VIRTUAL POWER PLANTS MARKET: SUPPLY-SIDE ANALYSIS
                    2.3.4.1 Calculations for supply-side analysis
                    2.3.4.2 Assumptions for supply-side analysis
    2.4 RESEARCH ASSUMPTIONS 
    2.5 RESEARCH LIMITATIONS 
    2.6 RISK ASSESSMENT 
           2.6.1 PARAMETERS CONSIDERED TO ANALYZE RECESSION IMPACT ON MARKET
    2.7 RECESSION IMPACT 
 
3 EXECUTIVE SUMMARY (Page No. - 47)
    TABLE 1 VIRTUAL POWER PLANT MARKET SNAPSHOT 
    FIGURE 7 DEMAND RESPONSE SEGMENT TO HOLD LARGEST MARKET SHARE IN 2024 
    FIGURE 8 SOFTWARE SEGMENT TO EXHIBIT HIGHEST CAGR DURING FORECAST PERIOD 
    FIGURE 9 RENEWABLE ENERGY SEGMENT TO LEAD MARKET IN 2029 
    FIGURE 10 COMMERCIAL SEGMENT TO DISPLAY HIGHEST GROWTH RATE DURING FORECAST PERIOD 
    FIGURE 11 NORTH AMERICA ACCOUNTED FOR LARGEST SHARE OF GLOBAL MARKET IN 2023 
 
4 PREMIUM INSIGHTS (Page No. - 51)
    4.1 ATTRACTIVE OPPORTUNITIES FOR PLAYERS IN VIRTUAL POWER PLANT MARKET 
           FIGURE 12 INCREASING INVESTMENTS IN RENEWABLE ENERGY TO REDUCE CARBON EMISSIONS TO DRIVE MARKET
    4.2 VIRTUAL POWER PLANT (VPP) MARKET IN NORTH AMERICA,  BY VERTICAL AND COUNTRY 
           FIGURE 13 INDUSTRIAL SEGMENT AND US HELD LARGEST SHARES OF NORTH AMERICAN MARKET IN 2023
    4.3 VIRTUAL POWER PLANT (VPP) MARKET, BY TECHNOLOGY 
           FIGURE 14 MIXED ASSET SEGMENT TO ACCOUNT FOR LARGEST MARKET SHARE IN 2029
    4.4 MARKET, BY OFFERING 
           FIGURE 15 HARDWARE SEGMENT TO DOMINATE MARKET IN 2029
    4.5 MARKET, BY SOURCE 
           FIGURE 16 RENEWABLE ENERGY SEGMENT TO COMMAND MARKET IN 2029
    4.6 MARKET, BY VERTICAL 
           FIGURE 17 INDUSTRIAL SEGMENT TO CAPTURE LARGEST MARKET SHARE IN 2029
 
5 MARKET OVERVIEW (Page No. - 54)
    5.1 INTRODUCTION 
    5.2 MARKET DYNAMICS 
           FIGURE 18 VIRTUAL POWER PLANT MARKET: DRIVERS, RESTRAINTS, OPPORTUNITIES, AND CHALLENGES
           5.2.1 DRIVERS
                    5.2.1.1 Seamless integration of virtual power plants with renewable sources
                               FIGURE 19 GLOBAL GREENHOUSE GAS EMISSIONS, 2018–2022
                    5.2.1.2 Pressing need to mitigate impact of intermittent renewable sources on stability and reliability of power grids
                    5.2.1.3 Decarbonization of power distribution systems
                               FIGURE 20 INVESTMENTS IN CLEAN ENERGY, 2017–2022
           5.2.2 RESTRAINTS
                    5.2.2.1 Requirement to deploy highly expensive monitoring & control predictive analytics solutions
           5.2.3 OPPORTUNITIES
                    5.2.3.1 Increasing installation of smart grids
                               FIGURE 21 INVESTMENTS IN ELECTRICITY GRIDS, 2015–2022
           5.2.4 CHALLENGES
                    5.2.4.1 Integration of different hardware and software components in VPPs
                    5.2.4.2 Cybersecurity threats due to use of digital infrastructure and communication networks
    5.3 TRENDS/DISRUPTIONS IMPACTING CUSTOMERS’ BUSINESSES 
           FIGURE 22 TRENDS/DISRUPTIONS IMPACTING CUSTOMERS’ BUSINESSES
    5.4 VALUE CHAIN ANALYSIS 
           FIGURE 23 VIRTUAL POWER PLANT (VPP) MARKET: VALUE CHAIN ANALYSIS
           5.4.1 RAW MATERIAL/COMPONENT PROVIDERS
           5.4.2 VIRTUAL POWER PLANT SYSTEM PROVIDERS/INSTALLATION AND MAINTENANCE SERVICE PROVIDERS
           5.4.3 END USERS/OPERATORS
    5.5 ECOSYSTEM ANALYSIS 
           TABLE 2 COMPANIES AND THEIR ROLES IN VIRTUAL POWER PLANT ECOSYSTEM
           FIGURE 24 ECOSYSTEM/MARKET MAP
    5.6 TECHNOLOGY ANALYSIS 
           5.6.1 AI OPTIMIZATION AND BLOCKCHAIN TRANSPARENCY
    5.7 PRICING ANALYSIS 
           TABLE 3 INDICATIVE PRICING TREND OF VIRTUAL POWER PLANTS, BY OFFERING (USD/KW)
           FIGURE 25 INDICATIVE PRICING ANALYSIS OF VIRTUAL POWER PLANT (USD/KW)
           TABLE 4 AVERAGE SELLING PRICE (ASP) TREND OF VIRTUAL POWER PLANTS, BY REGION (USD/KW)
           FIGURE 26 AVERAGE SELLING PRICE (ASP) OF VIRTUAL POWER PLANTS, BY REGION (USD/KW)
    5.8 TARIFFS, HS CODES, AND REGULATORY LANDSCAPE 
           5.8.1 TARIFFS RELATED TO VIRTUAL POWER PLANTS
                    TABLE 5 IMPORT TARIFFS FOR HS 8507-COMPLIANT PRODUCTS, 2022
           5.8.2 REGULATORY LANDSCAPE
                    TABLE 6 NORTH AMERICA: LIST OF REGULATORY BODIES, GOVERNMENT AGENCIES,  AND OTHER ORGANIZATIONS
                    TABLE 7 EUROPE: LIST OF REGULATORY BODIES, GOVERNMENT AGENCIES, AND OTHER ORGANIZATIONS
                    TABLE 8 ASIA PACIFIC: LIST OF REGULATORY BODIES, GOVERNMENT AGENCIES, AND OTHER ORGANIZATIONS
                    TABLE 9 ROW: LIST OF REGULATORY BODIES, GOVERNMENT AGENCIES,  AND OTHER ORGANIZATIONS
           5.8.3 CODES AND REGULATIONS
                    TABLE 10 VIRTUAL POWER PLANTS MARKET: HS CODES AND REGULATIONS
                    5.9 PATENT ANALYSIS, 2020–2023
                               TABLE 11 MARKET: LIST OF PATENTS, 2020–2023
    5.10 TRADE ANALYSIS 
           FIGURE 27 IMPORT AND EXPORT SCENARIO FOR HS CODE 8544-COMPLIANT PRODUCTS, 2018–2022 (USD THOUSAND)
           TABLE 12 TRADE DATA FOR HS CODE 8507-COMPLIANT PRODUCTS,  2018–2022 (USD THOUSAND)
           5.10.1 IMPORT SCENARIO
                    TABLE 13 IMPORT SCENARIO FOR HS CODE 8507-COMPLIANT PRODUCTS, BY COUNTRY,  2020–2022 (USD THOUSAND)
           5.10.2 EXPORT SCENARIO
                    TABLE 14 EXPORT SCENARIO FOR HS CODE 8507-COMPLIANT PRODUCTS, BY COUNTRY,  2020–2022 (USD THOUSAND)
    5.11 PORTER’S FIVE FORCES ANALYSIS 
                    TABLE 15 VIRTUAL POWER PLANT MARKET: PORTER’S FIVE FORCES ANALYSIS
                    FIGURE 28 MARKET: PORTER’S FIVE FORCES ANALYSIS
           5.11.1 THREAT OF SUBSTITUTES
           5.11.2 BARGAINING POWER OF SUPPLIERS
           5.11.3 BARGAINING POWER OF BUYERS
           5.11.4 THREAT OF NEW ENTRANTS
           5.11.5 INTENSITY OF COMPETITIVE RIVALRY
    5.12 KEY CONFERENCES AND EVENTS, 2024 
                    TABLE 16 MARKET: LIST OF CONFERENCES AND EVENTS, 2024
    5.13 KEY STAKEHOLDERS AND BUYING CRITERIA 
           5.13.1 KEY STAKEHOLDERS IN BUYING PROCESS
                    FIGURE 29 KEY STAKEHOLDERS IN BUYING PROCESS FOR TOP THREE VERTICALS
                    TABLE 17 INFLUENCE OF STAKEHOLDERS ON BUYING PROCESS FOR TOP THREE VERTICALS
           5.13.2 BUYING CRITERIA
                    FIGURE 30 KEY BUYING CRITERIA FOR TOP THREE VERTICALS
                    TABLE 18 KEY BUYING CRITERIA FOR TOP THREE VERTICALS
    5.14 CASE STUDY ANALYSIS 
           5.14.1 OATI DEPLOYS WEB DISTRIBUTION ASSIST EPB TO IMPLEMENT COMPREHENSIVE DEMAND RESPONSE MANAGEMENT SYSTEM TO MONITOR THEIR DISTRIBUTED ENERGY RESOURCES EFFECTIVELY
           5.14.2 VIRTUAL POWER STATION TECHNOLOGY HELPS OVERCOME RELIABILITY CHALLENGES ASSOCIATED WITH RENEWABLE ENERGY SUPPLY
           5.14.3 AUSGRID AND EVERGEN PARTNERED TO ADDRESS CHALLENGES OF INTEGRATING RENEWABLES AND MAXIMIZING USE OF CUSTOMER-OWNED BATTERIES
 
6 VIRTUAL POWER PLANT MARKET, BY TECHNOLOGY (Page No. - 77)
    6.1 INTRODUCTION 
           FIGURE 31 DEMAND RESPONSE SEGMENT ACCOUNTED FOR LARGEST MARKET SHARE IN 2023
           TABLE 19 MARKET, BY TECHNOLOGY, 2019–2022 (USD MILLION)
           TABLE 20 VIRTUAL POWER PLANTS MARKET, BY TECHNOLOGY, 2023–2029 (USD MILLION)
    6.2 DEMAND RESPONSE 
           6.2.1 EFFECTIVE OPTIMIZATION OF ENERGY USAGE DURING GRID STRESS TO ACCELERATE DEMAND
                    TABLE 21 DEMAND RESPONSE: MARKET, BY REGION,  2019–2022 (USD MILLION)
                    TABLE 22 DEMAND RESPONSE: MARKET, BY REGION,  2023–2029 (USD MILLION)
    6.3 SUPPLY SIDE 
           6.3.1 ABILITY TO INTEGRATE VARIOUS DISTRIBUTED ENERGY SOURCES TO BOOST DEMAND
                    TABLE 23 SUPPLY SIDE: MARKET, BY REGION, 2019–2022 (USD MILLION)
                    TABLE 24 SUPPLY SIDE: MARKET, BY REGION, 2023–2029 (USD MILLION)
    6.4 MIXED ASSET 
           6.4.1 DECLINING COSTS OF DISTRIBUTED ENERGY SOURCES TO DRIVE MARKET
                    TABLE 25 MIXED ASSET: MARKET, BY REGION, 2019–2022 (USD MILLION)
                    TABLE 26 MIXED ASSET: MARKET, BY REGION, 2023–2029 (USD MILLION)
 
7 VIRTUAL POWER PLANT MARKET, BY VERTICAL (Page No. - 83)
    7.1 INTRODUCTION 
           FIGURE 32 INDUSTRIAL SEGMENT SECURED LARGEST MARKET SHARE IN 2023
           TABLE 27 MARKET, BY VERTICAL, 2019–2022 (USD MILLION)
           TABLE 28 VIRTUAL POWER PLANT (VPP) MARKET, BY VERTICAL, 2023–2029 (USD MILLION)
    7.2 COMMERCIAL 
           7.2.1 REDUCED WORKLOAD AND COST OPTIMIZATION TO FOSTER SEGMENTAL GROWTH
                    TABLE 29 COMMERCIAL: MARKET, BY REGION 2019–2022 (USD MILLION)
                    TABLE 30 COMMERCIAL: MARKET, BY REGION, 2023–2029 (USD MILLION)
    7.3 INDUSTRIAL 
           7.3.1 SIGNIFICANT CONTRIBUTION IN REDUCING SCOPE 2 EMISSIONS TO BOOST DEMAND
                    TABLE 31 INDUSTRIAL: MARKET, BY REGION, 2019–2022 (USD MILLION)
                    TABLE 32 INDUSTRIAL: MARKET, BY REGION, 2023–2029 (USD MILLION)
    7.4 RESIDENTIAL 
           7.4.1 INCREASING ADOPTION OF EVS AND ROOFTOP PVS TO FUEL DEMAND
                    TABLE 33 RESIDENTIAL: MARKET, BY REGION 2019–2022 (USD MILLION)
                    TABLE 34 RESIDENTIAL: MARKET, BY REGION, 2023–2029 (USD MILLION)
 
8 VIRTUAL POWER PLANT MARKET, BY OFFERING (Page No. - 89)
    8.1 INTRODUCTION 
           FIGURE 33 HARDWARE SEGMENT DOMINATED MARKET IN 2023
           TABLE 35 MARKET, BY COMPONENT, 2019–2022 (USD MILLION)
           TABLE 36 VIRTUAL POWER PLANT (VPP) MARKET, BY COMPONENT, 2023–2029 (USD MILLION)
    8.2 HARDWARE 
           8.2.1 NEED FOR REAL-TIME MONITORING AND OPTIMIZATION OF DERS TO BOOST DEMAND
                    TABLE 37 HARDWARE: MARKET, BY REGION, 2019–2022 (USD MILLION)
                    TABLE 38 HARDWARE: MARKET, BY REGION, 2023–2029 (USD MILLION)
    8.3 SOFTWARE 
           8.3.1 USE OF ADVANCED ALGORITHMS TO FACILITATE INFORMED DECISION-MAKING TO DRIVE MARKET
                    TABLE 39 SOFTWARE: MARKET, BY REGION, 2019–2022 (USD MILLION)
                    TABLE 40 SOFTWARE: MARKET, BY REGION, 2023–2029 (USD MILLION)
    8.4 SERVICES 
           8.4.1 REQUIREMENT OF OPERATIONAL SUPPORT AND STRATEGIC GUIDANCE WHILE VPP DEPLOYMENT TO FOSTER SEGMENTAL GROWTH
                    TABLE 41 SERVICES: MARKET, BY REGION, 2019–2022 (USD MILLION)
                    TABLE 42 SERVICES: MARKET, BY REGION, 2023–2029 (USD MILLION)
 
9 VIRTUAL POWER PLANT MARKET, BY SOURCE (Page No. - 95)
    9.1 INTRODUCTION 
           FIGURE 34 RENEWABLE ENERGY SECURED LARGEST MARKET SHARE IN 2023
           TABLE 43 MARKET, BY SOURCE, 2019–2022 (USD MILLION)
           TABLE 44 VIRTUAL POWER PLANTS MARKET, BY SOURCE, 2023–2029 (USD MILLION)
    9.2 RENEWABLE ENERGY 
           9.2.1 DIVERSIFICATION OF ENERGY MIX AND DECENTRALIZATION OF POWER GENERATION TO BOOST DEMAND
                    TABLE 45 RENEWABLE ENERGY: VIRTUAL POWER PLANT MARKET, BY REGION,  2019–2022 (USD MILLION)
                    TABLE 46 RENEWABLE ENERGY: MARKET, BY REGION,  2023–2029 (USD MILLION)
    9.3 STORAGE 
           9.3.1 ENERGY OPTIMIZATION WITH INTEGRATION OF DIVERSE ENERGY STORAGE SYSTEMS TO DRIVE MARKET
                    TABLE 47 STORAGE: VIRTUAL POWER PLANT (VPP) MARKET, BY REGION, 2019–2022 (USD MILLION)
                    TABLE 48 STORAGE: MARKET, BY REGION, 2023–2029 (USD MILLION)
    9.4 COGENERATION 
           9.4.1 ENHANCED ENERGY EFFICIENCY BY UTILIZING WASTE HEAT TO OFFER LUCRATIVE GROWTH OPPORTUNITIES TO PLAYERS
                    TABLE 49 COGENERATION: MARKET, BY REGION,  2019–2022 (USD MILLION)
                    TABLE 50 COGENERATION: MARKET, BY REGION,  2023–2029 (USD MILLION)
 
10 VIRTUAL POWER PLANT MARKET, BY REGION (Page No. - 101)
     10.1 INTRODUCTION 
               FIGURE 35 ASIA PACIFIC TO EXHIBIT HIGHEST CAGR IN GLOBAL VIRTUAL POWER PLANT MARKET DURING FORECAST PERIOD
               FIGURE 36 NORTH AMERICA SECURED LARGEST MARKET SHARE IN 2023
               TABLE 51 MARKET, BY REGION, 2019–2022 (USD MILLION)
               TABLE 52 VIRTUAL POWER PLANT (VPP) MARKET, BY REGION, 2023–2029 (USD MILLION)
     10.2 NORTH AMERICA 
             10.2.1 RECESSION IMPACT ON MARKET IN NORTH AMERICA
                       TABLE 53 NORTH AMERICA: VIRTUAL POWER PLANT MARKET, BY TECHNOLOGY,  2019–2022 (USD MILLION)
                       TABLE 54 NORTH AMERICA: MARKET, BY TECHNOLOGY,  2023–2029 (USD MILLION)
                       TABLE 55 NORTH AMERICA: MARKET, BY OFFERING,  2019–2022 (USD MILLION)
                       TABLE 56 NORTH AMERICA: MARKET, BY OFFERING,  2023–2029 (USD MILLION)
                       TABLE 57 NORTH AMERICA: MARKET, BY SOURCE,  2019–2022 (USD MILLION)
                       TABLE 58 NORTH AMERICA: MARKET, BY SOURCE,  2023–2029 (USD MILLION)
                       TABLE 59 NORTH AMERICA: MARKET, BY VERTICAL  2019–2022 (USD MILLION)
                       TABLE 60 NORTH AMERICA: MARKET, BY VERTICAL,  2023–2029 (USD MILLION)
                       TABLE 61 NORTH AMERICA: MARKET, BY COUNTRY,  2019–2022 (USD MILLION)
                       TABLE 62 NORTH AMERICA: MARKET, BY COUNTRY,  2023–2029 (USD MILLION)
             10.2.2 US
                       10.2.2.1 Government-led initiatives to boost importance of renewable sources to drive market
                                   TABLE 63 US: VIRTUAL POWER PLANT (VPP) MARKET, BY TECHNOLOGY, 2019–2022 (USD MILLION)
                                   TABLE 64 US: MARKET, BY TECHNOLOGY, 2023–2029 (USD MILLION)
             10.2.3 CANADA
                       10.2.3.1 Initiatives to provide green energy and reduce electricity rates to accelerate demand
                                   TABLE 65 CANADA: MARKET, BY TECHNOLOGY, 2019–2022 (USD MILLION)
                                   TABLE 66 CANADA: MARKET, BY TECHNOLOGY, 2023–2029 (USD MILLION)
     10.3 ASIA PACIFIC 
               FIGURE 37 ASIA PACIFIC: VIRTUAL POWER PLANT (VPP) MARKET SNAPSHOT
             10.3.1 RECESSION IMPACT ON MARKET IN ASIA PACIFIC
                       TABLE 67 ASIA PACIFIC: VIRTUAL POWER PLANT MARKET, BY TECHNOLOGY,  2019–2022 (USD MILLION)
                       TABLE 68 ASIA PACIFIC: MARKET, BY TECHNOLOGY,  2023–2029 (USD MILLION)
                       TABLE 69 ASIA PACIFIC: MARKET, BY OFFERING,  2019–2022 (USD MILLION)
                       TABLE 70 ASIA PACIFIC: MARKET, BY OFFERING,  2023–2029 (USD MILLION)
                       TABLE 71 ASIA PACIFIC: MARKET, BY SOURCE, 2019–2022 (USD MILLION)
                       TABLE 72 ASIA PACIFIC: MARKET, BY SOURCE, 2023–2029 (USD MILLION)
                       TABLE 73 ASIA PACIFIC: MARKET, BY VERTICAL, 2019–2022 (USD MILLION)
                       TABLE 74 ASIA PACIFIC: MARKET, BY VERTICAL,  2023–2029 (USD MILLION)
                       TABLE 75 ASIA PACIFIC: MARKET, BY COUNTRY, 2019–2022 (USD MILLION)
                       TABLE 76 ASIA PACIFIC: MARKET, BY COUNTRY, 2023–2029 (USD MILLION)
             10.3.2 AUSTRALIA
                       10.3.2.1 Government policy incentives and environmental sustainability goals to boost demand
                                   TABLE 77 AUSTRALIA: MARKET, BY TECHNOLOGY,  2019–2022 (USD MILLION)
                                   TABLE 78 AUSTRALIA: MARKET, BY TECHNOLOGY,  2023–2029 (USD MILLION)
             10.3.3 SOUTH KOREA
                       10.3.3.1 Increasing public–private collaborations to establish renewable infrastructure to drive market
                                   TABLE 79 SOUTH KOREA: VIRTUAL POWER PLANT (VPP) MARKET, BY TECHNOLOGY,  2019–2022 (USD MILLION)
                                   TABLE 80 SOUTH KOREA: MARKET, BY TECHNOLOGY,  2023–2029 (USD MILLION)
             10.3.4 JAPAN
                       10.3.4.1 Growing investment by foreign players to offer lucrative market growth opportunities
                                   TABLE 81 JAPAN: MARKET, BY TECHNOLOGY, 2019–2022 (USD MILLION)
                                   TABLE 82 JAPAN: MARKET, BY TECHNOLOGY, 2023–2029 (USD MILLION)
             10.3.5 REST OF ASIA PACIFIC
                       TABLE 83 REST OF ASIA PACIFIC: MARKET, BY TECHNOLOGY,  2019–2022 (USD MILLION)
                       TABLE 84 REST OF ASIA PACIFIC: MARKET, BY TECHNOLOGY,  2023–2029 (USD MILLION)
     10.4 EUROPE 
               FIGURE 38 EUROPE: VIRTUAL POWER PLANT (VPP) MARKET SNAPSHOT
             10.4.1 RECESSION IMPACT ON MARKET IN EUROPE
                       TABLE 85 EUROPE: VIRTUAL POWER PLANT MARKET, BY TECHNOLOGY, 2019–2022 (USD MILLION)
                       TABLE 86 EUROPE: MARKET, BY TECHNOLOGY, 2023–2029 (USD MILLION)
                       TABLE 87 EUROPE: MARKET, BY OFFERING, 2019–2022 (USD MILLION)
                       TABLE 88 EUROPE: MARKET, BY OFFERING, 2023–2029 (USD MILLION)
                       TABLE 89 EUROPE: MARKET, BY SOURCE, 2019–2022 (USD MILLION)
                       TABLE 90 EUROPE: MARKET, BY SOURCE, 2023–2029 (USD MILLION)
                       TABLE 91 EUROPE: MARKET, BY VERTICAL, 2019–2022 (USD MILLION)
                       TABLE 92 EUROPE: MARKET, BY VERTICAL, 2023–2029 (USD MILLION)
                       TABLE 93 EUROPE: MARKET, BY COUNTRY, 2019–2022 (USD MILLION)
                       TABLE 94 EUROPE: MARKET, BY COUNTRY, 2023–2029 (USD MILLION)
             10.4.2 UK
                       10.4.2.1 Growing investments by UK Infrastructure Bank in energy sector to drive market
                                   TABLE 95 UK: VIRTUAL POWER PLANT (VPP) MARKET, BY TECHNOLOGY, 2019–2022 (USD MILLION)
                                   TABLE 96 UK: MARKET, BY TECHNOLOGY, 2023–2029 (USD MILLION)
             10.4.3 GERMANY
                       10.4.3.1 Thriving renewable energy sector to boost demand
                                   TABLE 97 GERMANY: MARKET, BY TECHNOLOGY,  2019–2022 (USD MILLION)
                                   TABLE 98 GERMANY: MARKET, BY TECHNOLOGY,  2023–2029 (USD MILLION)
             10.4.4 FRANCE
                       10.4.4.1 Government-led initiatives to innovate renewable energy projects to accelerate demand
                                   TABLE 99 FRANCE: MARKET, BY TECHNOLOGY, 2019–2022 (USD MILLION)
                                   TABLE 100 FRANCE: MARKET, BY TECHNOLOGY, 2023–2029 (USD MILLION)
             10.4.5 DENMARK
                       10.4.5.1 Initiatives to make electricity sector fossil-free by 2030 to fuel demand
                                   TABLE 101 DENMARK: MARKET, BY TECHNOLOGY,  2019–2022 (USD MILLION)
                                   TABLE 102 DENMARK: MARKET, BY TECHNOLOGY,  2023–2029 (USD MILLION)
             10.4.6 REST OF EUROPE
                       TABLE 103 REST OF EUROPE: MARKET, BY TECHNOLOGY,  2019–2022 (USD MILLION)
                       TABLE 104 REST OF EUROPE: MARKET, BY TECHNOLOGY,  2023–2029 (USD MILLION)
     10.5 MIDDLE EAST & AFRICA 
             10.5.1 RECESSION IMPACT ON MARKET IN MIDDLE EAST & AFRICA
                       TABLE 105 MIDDLE EAST & AFRICA: VIRTUAL POWER PLANT MARKET, BY TECHNOLOGY,  2019–2022 (USD MILLION)
                       TABLE 106 MIDDLE EAST & AFRICA: MARKET, BY TECHNOLOGY,  2023–2029 (USD MILLION)
                       TABLE 107 MIDDLE EAST & AFRICA: MARKET, BY OFFERING,  2019–2022 (USD MILLION)
                       TABLE 108 MIDDLE EAST & AFRICA: MARKET, BY OFFERING,  2023–2029 (USD MILLION)
                       TABLE 109 MIDDLE EAST & AFRICA: MARKET, BY SOURCE,  2019–2022 (USD MILLION)
                       TABLE 110 MIDDLE EAST & AFRICA: MARKET, BY SOURCE,  2023–2029 (USD MILLION)
                       TABLE 111 MIDDLE EAST & AFRICA: MARKET, BY VERTICAL  2019–2022 (USD MILLION)
                       TABLE 112 MIDDLE EAST & AFRICA: MARKET, BY VERTICAL,  2023–2029 (USD MILLION)
                       TABLE 113 MIDDLE EAST & AFRICA: MARKET, BY COUNTRY,  2019–2022 (USD MILLION)
                       TABLE 114 MIDDLE EAST & AFRICA: MARKET, BY COUNTRY,  2023–2029 (USD MILLION)
                       TABLE 115 GCC COUNTRIES: MARKET, BY COUNTRY,  2019–2022 (USD MILLION)
                       TABLE 116 GCC COUNTRIES: MARKET, BY COUNTRY,  2023–2029 (USD MILLION)
             10.5.2 GCC COUNTRIES
                       10.5.2.1 Growing FDIs in renewable energy sector to accelerate demand
                                   TABLE 117 GCC COUNTRIES: MARKET, BY TECHNOLOGY,  2019–2022 (USD MILLION)
                                   TABLE 118 GCC COUNTRIES: MARKET, BY TECHNOLOGY,  2023–2029 (USD MILLION)
             10.5.3 SOUTH AFRICA
                       10.5.3.1 Adoption of clean energy technologies to boost demand
                                   TABLE 119 SOUTH AFRICA: MARKET, BY TECHNOLOGY,  2019–2022 (USD MILLION)
                                   TABLE 120 SOUTH AFRICA: MARKET, BY TECHNOLOGY,  2023–2029 (USD MILLION)
             10.5.4 TURKEY
                       10.5.4.1 Integration of renewable sources into power grids to drive market
                                   TABLE 121 TURKEY: MARKET, BY TECHNOLOGY, 2019–2022 (USD MILLION)
                                   TABLE 122 TURKEY: MARKET, BY TECHNOLOGY, 2023–2029 (USD MILLION)
             10.5.5 REST OF MIDDLE EAST & AFRICA
                       TABLE 123 REST OF MIDDLE EAST & AFRICA: MARKET, BY TECHNOLOGY, 2019–2022 (USD MILLION)
                       TABLE 124 REST OF MIDDLE EAST & AFRICA: MARKET, BY TECHNOLOGY, 2023–2029 (USD MILLION)
     10.6 SOUTH AMERICA 
             10.6.1 RECESSION IMPACT ON MARKET IN SOUTH AMERICA
                       TABLE 125 SOUTH AMERICA: VIRTUAL POWER PLANT MARKET, BY TECHNOLOGY,  2019–2022 (USD MILLION)
                       TABLE 126 SOUTH AMERICA: MARKET, BY TECHNOLOGY,  2023–2029 (USD MILLION)
                       TABLE 127 SOUTH AMERICA: MARKET, BY OFFERING,  2019–2022 (USD MILLION)
                       TABLE 128 SOUTH AMERICA: MARKET, BY OFFERING,  2023–2029 (USD MILLION)
                       TABLE 129 SOUTH AMERICA: MARKET, BY SOURCE,  2019–2022 (USD MILLION)
                       TABLE 130 SOUTH AMERICA: MARKET, BY SOURCE,  2023–2029 (USD MILLION)
                       TABLE 131 SOUTH AMERICA: MARKET, BY VERTICAL,  2019–2022 (USD MILLION)
                       TABLE 132 SOUTH AMERICA: MARKET, BY VERTICAL,  2023–2029 (USD MILLION)
                       TABLE 133 SOUTH AMERICA: MARKET, BY COUNTRY,  2019–2022 (USD MILLION)
                       TABLE 134 SOUTH AMERICA: MARKET, BY COUNTRY,  2023–2029 (USD MILLION)
             10.6.2 BRAZIL
                       10.6.2.1 Growing initiatives by players to implement VPP models to surge demand
                                   TABLE 135 BRAZIL: MARKET, BY TECHNOLOGY, 2019–2022 (USD MILLION)
                                   TABLE 136 BRAZIL: MARKET, BY TECHNOLOGY, 2023–2029 (USD MILLION)
             10.6.3 REST OF SOUTH AMERICA
                       TABLE 137 REST OF SOUTH AMERICA: MARKET, BY TECHNOLOGY,  2019–2022 (USD MILLION)
                       TABLE 138 REST OF SOUTH AMERICA: MARKET, BY TECHNOLOGY,  2023–2029 (USD MILLION)
 
11 COMPETITIVE LANDSCAPE (Page No. - 142)
     11.1 OVERVIEW 
     11.2 STRATEGIES ADOPTED BY MAJOR PLAYERS, 2020–2023 
               TABLE 139 MARKET: OVERVIEW OF STRATEGIES ADOPTED BY KEY PLAYERS, 2020–2023
     11.3 MARKET SHARE ANALYSIS, 2023 
               FIGURE 39 VIRTUAL POWER PLANT MARKET SHARE ANALYSIS, 2023
               TABLE 140 VIRTUAL POWER PLANT (VPP) MARKET SHARE ANALYSIS, 2023
               FIGURE 40 VIRTUAL POWER PLANT MARKET SHARE ANALYSIS, 2022
     11.4 REVENUE ANALYSIS, 2018–2022 
               FIGURE 41 VIRTUAL POWER PLANT (VPP) MARKET: REVENUE ANALYSIS OF TOP FIVE PLAYERS, 2018–2022
     11.5 COMPANY EVALUATION MATRIX, 2023 
             11.5.1 STARS
             11.5.2 EMERGING LEADERS
             11.5.3 PERVASIVE PLAYERS
             11.5.4 PARTICIPANTS
                       FIGURE 42 VIRTUAL POWER PLANT (VPP) MARKET: COMPANY EVALUATION MATRIX, 2023
             11.5.5 COMPANY FOOTPRINT
                       TABLE 141 OVERALL COMPANY FOOTPRINT
                       TABLE 142 TECHNOLOGY: COMPANY FOOTPRINT
                       TABLE 143 OFFERING: COMPANY FOOTPRINT
                       TABLE 144 VERTICAL: COMPANY FOOTPRINT
                       TABLE 145 REGION: COMPANY FOOTPRINT
     11.6 START-UPS/SMALL AND MEDIUM-SIZED ENTERPRISES (SMES) EVALUATION MATRIX, 2023 
             11.6.1 PROGRESSIVE COMPANIES
             11.6.2 RESPONSIVE COMPANIES
             11.6.3 DYNAMIC COMPANIES
             11.6.4 STARTING BLOCKS
                       FIGURE 43 VPP MARKET: START-UP/SME EVALUATION MATRIX, 2022
             11.6.5 COMPETITIVE BENCHMARKING
                       TABLE 146 VPP MARKET: LIST OF KEY START-UPS/SMES
                       TABLE 147 VIRTUAL POWER PLANTS MARKET: COMPETITIVE BENCHMARKING OF START-UPS
     11.7 COMPETITIVE SCENARIOS AND TRENDS 
             11.7.1 PRODUCT LAUNCHES, 2020–2023
                       TABLE 148 VPP MARKET: PRODUCT LAUNCHES, 2020–2023
             11.7.2 DEALS, 2020–2023
                       TABLE 149 VIRTUAL POWER PLANT (VPP) MARKET: DEALS, 2020–2023
 
12 COMPANY PROFILES (Page No. - 156)
     12.1 KEY PLAYERS 
(Business overview, Products /Solutions/Services offered, Recent developments, Deals, MnM view, Key strengths/Right to win, Strategic choices made, and Weaknesses and Competitive threats)*
             12.1.1 SIEMENS
                       TABLE 150 SIEMENS: COMPANY OVERVIEW
                       FIGURE 44 SIEMENS: COMPANY SNAPSHOT
                       TABLE 151 SIEMENS: PRODUCTS/SOLUTIONS/SERVICES OFFERED
                       TABLE 152 SIEMENS: DEALS
             12.1.2 SCHNEIDER ELECTRIC
                       TABLE 153 SCHNEIDER ELECTRIC: COMPANY OVERVIEW
                       FIGURE 45 SCHNEIDER ELECTRIC: COMPANY SNAPSHOT
                       TABLE 154 SCHNEIDER ELECTRIC: PRODUCTS/SOLUTIONS/SERVICES OFFERED
                       TABLE 155 SCHNEIDER ELECTRIC: DEALS
             12.1.3 GENERAL ELECTRIC
                       TABLE 156 GENERAL ELECTRIC: COMPANY OVERVIEW
                       FIGURE 46 GENERAL ELECTRIC: COMPANY SNAPSHOT
                       TABLE 157 GENERAL ELECTRIC: PRODUCTS/SOLUTIONS/SERVICES OFFERED
                       TABLE 158 GENERAL ELECTRIC: DEALS
             12.1.4 SHELL
                       TABLE 159 SHELL: COMPANY OVERVIEW
                       FIGURE 47 SHELL: COMPANY SNAPSHOT
                       TABLE 160 SHELL: PRODUCTS/SOLUTIONS/SERVICES OFFERED
                       TABLE 161 SHELL: DEALS
             12.1.5 ABB
                       TABLE 162 ABB: COMPANY OVERVIEW
                       FIGURE 48 ABB: COMPANY SNAPSHOT
                       TABLE 163 ABB: PRODUCTS/SOLUTIONS/SERVICES OFFERED
                       TABLE 164 ABB: DEALS
             12.1.6 TESLA
                       TABLE 165 TESLA: COMPANY OVERVIEW
                       FIGURE 49 TESLA: COMPANY SNAPSHOT
                       TABLE 166 TESLA: PRODUCTS/SOLUTIONS/SERVICES OFFERED
             12.1.7 CPOWER
                       TABLE 167 CPOWER: COMPANY OVERVIEW
                       TABLE 168 CPOWER: PRODUCTS/SOLUTIONS/SERVICES OFFERED
                       TABLE 169 CPOWER: DEALS
             12.1.8 IBM
                       TABLE 170 IBM: COMPANY OVERVIEW
                       FIGURE 50 IBM: COMPANY SNAPSHOT
                       TABLE 171 IBM: PRODUCTS/SOLUTIONS/SERVICES OFFERED
             12.1.9 HITACHI ENERGY LTD.
                       TABLE 172 HITACHI ENERGY LTD.: BUSINESS OVERVIEW
                       TABLE 173 HITACHI ENERGY LTD.: PRODUCTS/SOLUTIONS/SERVICES OFFERED
                       TABLE 174 HITACHI ENERGY LTD.: DEALS
             12.1.10 GENERAC POWER SYSTEMS, INC.
                       TABLE 175 GENERAC POWER SYSTEMS: COMPANY OVERVIEW
                       FIGURE 51 GENERAC POWER SYSTEMS: COMPANY SNAPSHOT
                       TABLE 176 GENERAC POWER SYSTEMS: PRODUCTS/SOLUTIONS/SERVICES OFFERED
                       TABLE 177 GENERAC POWER SYSTEMS: DEALS
             12.1.11 FLEXITRICITY
                       TABLE 178 FLEXITRICITY: COMPANY OVERVIEW
                       TABLE 179 FLEXITRICITY: PRODUCTS/SOLUTIONS/SERVICES OFFERED
                       TABLE 180 FLEXITRICITY: DEALS
             12.1.12 OLIVINE, INC.
                       TABLE 181 OLIVINE, INC.: COMPANY OVERVIEW
                       TABLE 182 OLIVINE, INC.: PRODUCTS/SOLUTIONS/SERVICES OFFERED
                       TABLE 183 OLIVINE, INC.: DEALS
             12.1.13 LUMENAZA GMBH
                       TABLE 184 LUMENAZA GMBH: COMPANY OVERVIEW
                       TABLE 185 LUMENAZA GMBH: PRODUCTS/SOLUTIONS/SERVICES OFFERED
             12.1.14 STEM, INC.
                       TABLE 186 STEM, INC.: COMPANY OVERVIEW
                       FIGURE 52 STEM, INC.: COMPANY SNAPSHOT
                       TABLE 187 STEM, INC.: PRODUCTS/SOLUTIONS/SERVICES OFFERED
                       TABLE 188 STEM, INC.: PRODUCT LAUNCHES
                       TABLE 189 STEM, INC.: DEALS
             12.1.15 OPEN ACCESS TECHNOLOGY INTERNATIONAL, INC.
                       TABLE 190 OPEN ACCESS TECHNOLOGY INTERNATIONAL, INC.: COMPANY OVERVIEW
                       TABLE 191 OPEN ACCESS TECHNOLOGY INTERNATIONAL, INC.: PRODUCTS/SOLUTIONS/SERVICES OFFERED
             12.1.16 SPIRAE
                       TABLE 192 SPIRAE: COMPANY OVERVIEW
                       TABLE 193 SPIRAE: PRODUCTS/SOLUTIONS/SERVICES OFFERED
     12.2 OTHER PLAYERS 
             12.2.1 ARGAND SOLUTIONS
             12.2.2 KRAKENFLEX LIMITED
             12.2.3 HAVEN ENERGY
             12.2.4 ENERGY & METEO SYSTEMS GMBH
*Details on Business overview, Products /Solutions/Services offered, Recent developments, Deals, MnM view, Key strengths/Right to win, Strategic choices made, and Weaknesses and Competitive threats might not be captured in case of unlisted companies.
 
13 APPENDIX (Page No. - 194)
     13.1 INSIGHTS FROM INDUSTRY EXPERTS 
     13.2 DISCUSSION GUIDE 
     13.3 KNOWLEDGESTORE: MARKETSANDMARKETS’  SUBSCRIPTION PORTAL 
     13.4 CUSTOMIZATION OPTIONS 
     13.5 RELATED REPORTS 
     13.6 AUTHOR DETAILS 

The study involved major activities in estimating the current virtual power plant market size. Exhaustive secondary research was done to collect information on the peer and parent markets. The next step was to validate these findings, assumptions, and sizing with industry experts across the value chain through primary research. Both top-down and bottom-up approaches were employed to estimate the complete market size. Thereafter, market breakdown and data triangulation were used to estimate the market size of the segments and subsegments.

Secondary Research

This research study on the virtual power plant (VPP) market involved the use of extensive secondary sources, directories, and databases, such as Hoovers, Bloomberg, Businessweek, Factiva, International Energy Agency, and United States Energy Association, to identify and collect information useful for a technical, market-oriented, and commercial study of the global virtual power plant market. The other secondary sources included annual reports of the companies involved in the market, press releases & investor presentations of companies, white papers, certified publications, articles by recognized authors, manufacturer associations, trade directories, and databases. 

Primary Research

The virtual power plant (VPP) market comprises several stakeholders such as virtual power plant aggregators, manufacturers of subcomponents of virtual power plant, manufacturing technology providers, and technology support providers in the supply chain. The demand side of this market is characterized by the rising demand for energy efficiency. The supply side is characterized by rising demand for contracts from the automotive sector and mergers & acquisitions among big players. Various primary sources from both the supply and demand sides of the market were interviewed to obtain qualitative and quantitative information

Following is the breakdown of primary respondents: 
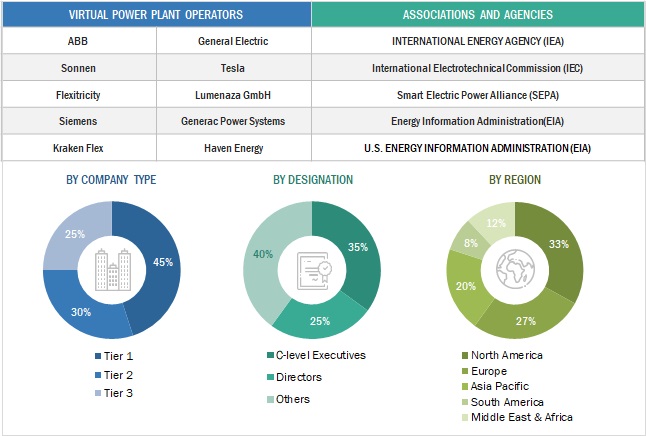
Virtual Power Plant Market Size, and Share

To know about the assumptions considered for the study, download the pdf brochure

Virtual Power Plant Market Size Estimation

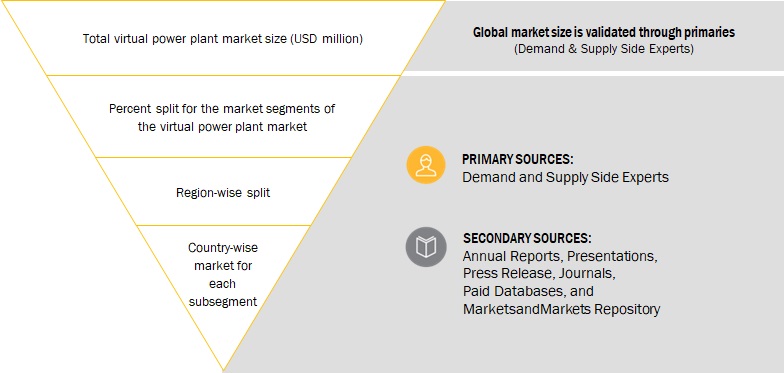
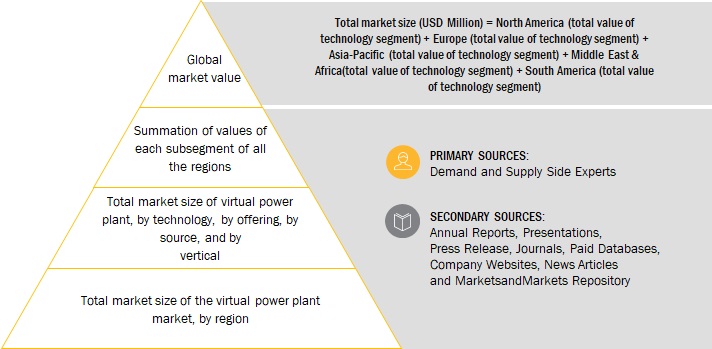
Both top-down and bottom-up approaches were used to estimate and validate the total size of the virtual power plant (VPP) market. These methods were also used extensively to estimate the size of various subsegments in the market. The research methodology used to estimate the market size includes the following:

  • The key players in the industry and market have been identified through extensive secondary research, and their market share in the respective regions has been determined through both secondary and primary research.
  • The industry’s value chain and market size, in terms of value, have been determined through primary and secondary research processes.
  • All percentage shares, splits, and breakdowns have been determined using secondary sources and verified through primaries.

Global Virtual Power Plant Market Size: Top-down Approach
Virtual Power Plant Market Size, and Share

To know about the assumptions considered for the study, Request for Free Sample Report

Global Virtual Power Plant Market Size: Bottom-Up Approach
Virtual Power Plant Market Size, and Share

Data Triangulation

After arriving at the overall market size from the estimation process explained above, the total market has been split into several segments and subsegments. The complete market engineering process is done to arrive at the exact statistics for all the segments and subsegments, also data triangulation and market breakdown processes have been employed, wherever applicable. The data has been triangulated by examining various factors and trends from both the demand- and supply sides. Along with this, the market has been validated through both the top-down and bottom-up approaches.

Market Definition

A virtual power plant (VPP) is a cloud-based distributed power plant that aggregates heterogeneous distributed energy resources (DER) capacities for optimized power generation from existing sources, integration of various renewable energy sources, and, ultimately, trading or selling power in the electricity market. VPPs are networks of small energy-producing or storage devices, like solar panels and batteries, pooled together to serve the electricity grid. With their participants’ approval, their energy can be tapped by utilities during high demand or reserved for later. As a result, the desired power requirement can be met without large-scale power infrastructure upgrades. Virtual power plant solutions can be associated with concepts such as smart grid, microgrid, distributed generation, demand response, and advanced energy storage.

Key Stakeholders

  • Public and Private Electric Utilities
  • VPP Aggregators
  • Distributed Energy Generation Solution Providers
  • Virtual Power Plant Component Manufacturers
  • Energy & Power Sector Consulting Companies
  • Government & Research Organizations
  • Independent Power Producers
  • Investment Banks
  • Electrical Equipment Associations
  • Integrated Device Manufacturers (IDMs)
  • Process Industries and Power and Energy Associations
  • Energy Storage Device/Equipment Manufacturers and Integrators
  • Distributed Energy Resource (DER) Owners

Objectives of the Study

  • To define, describe, analyze, and forecast the size of the global virtual power plant (VPP) market by technology, vertical, source, offering and region, and in terms of value
  • To forecast the market size for five key regions: North America, South America, Europe, Asia Pacific, and Middle East & Africa, along with their key countries
  • To provide detailed information about the key drivers, restraints, opportunities, and challenges influencing the growth of the market
  • To strategically analyze the subsegments with respect to individual growth trends, prospects, and contributions of each segment to the overall market size
  • To analyze market opportunities for stakeholders and the competitive landscape of the market
  • To strategically profile the key players and comprehensively analyze their market shares and core competencies
  • To analyze competitive developments, such as sales contracts, agreements, investments, expansions, new product launches, mergers, partnerships, collaborations, and acquisitions, in the market

Available Customizations:

With the given market data, MarketsandMarkets offers customizations as per the client’s specific needs. The following customization options are available for this report:

Geographic Analysis

  • Further breakdown of region or country-specific analysis

Company Information

  • Detailed analyses and profiling of additional market players (up to 5)
Custom Market Research Services

We will customize the research for you, in case the report listed above does not meet with your exact requirements. Our custom research will comprehensively cover the business information you require to help you arrive at strategic and profitable business decisions.

Request Customization
Report Code
EP 5131
Published ON
Jan, 2024
Choose License Type
BUY NOW
  • SHARE
X
Request Customization
Speak to Analyst
Speak to Analyst
OR FACE-TO-FACE MEETING
PERSONALIZE THIS RESEARCH
  • Triangulate with your Own Data
  • Get Data as per your Format and Definition
  • Gain a Deeper Dive on a Specific Application, Geography, Customer or Competitor
  • Any level of Personalization
REQUEST A FREE CUSTOMIZATION
LET US HELP YOU!
  • What are the Known and Unknown Adjacencies Impacting the Virtual Power Plant Market
  • What will your New Revenue Sources be?
  • Who will be your Top Customer; what will make them switch?
  • Defend your Market Share or Win Competitors
  • Get a Scorecard for Target Partners
CUSTOMIZED WORKSHOP REQUEST
+1-888-600-6441
  • Call Us
  • +1-888-600-6441 (Corporate office hours)
  • +1-888-600-6441 (US/Can toll free)
  • +44-800-368-9399 (UK office hours)
CONNECT WITH US
ABOUT TRUST ONLINE
©2024 MarketsandMarkets Research Private Ltd. All rights reserved
DMCA.com Protection Status Website Feedback