Hybrid Power Solutions Market by System Type (Solar-Fossil, Wind-Fossil, Solar-Wind-Fossil, Solar-Wind, Others), Grid Connectivity (On-Grid, Off-Grid), Capacity (Upto 100kW, 100kW-1MW, Above 1MW), End User & Region - Global Forecast to 2028
[193 Pages Report] The hybrid power solutions market is expected to grow from an estimated USD 2.4 billion in 2023 to USD 4.0 billion by 2028, at a CAGR of 10.4% during the forecast period. The nations are undergoing rapid industrialization, there is a greater demand for power. Due to the massive sustainability goals, the increase in adoption of renewable energy is driving the integration of renewable energy sources along with already established conventional power sources. This is enhancing the investment in development of hybrid power solutions.
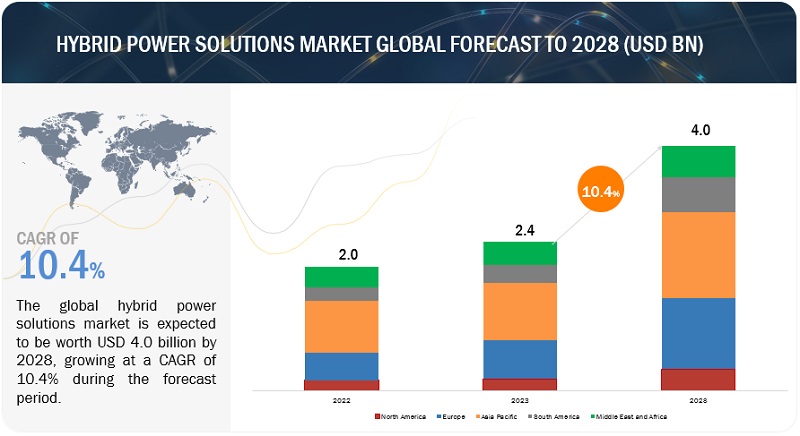
To know about the assumptions considered for the study, Request for Free Sample Report
To know about the assumptions considered for the study, download the pdf brochure
Hybrid Power Solutions Market Dynamics
Driver: Growth in hybrid power generation in off-grid locations
The growth of hybrid power generation in off-grid locations is fueled by the increasing need for reliable and sustainable electricity solutions in areas with limited or no access to centralized power grids. Off-grid regions, such as remote rural communities, island communities, mining operations, and telecommunication sites in remote areas, face significant challenges in meeting their energy demands. Traditional power generation methods, like diesel generators, are costly, environmentally detrimental, and often prone to supply disruptions. In response to these challenges, hybrid power systems that combine renewable energy sources, such as solar and wind, with traditional diesel generators have emerged as a viable and effective solution.
Restraints: High Initial Investment
The high initial expenditure of hybrid power solutions compared to conventional diesel generators presents a significant restraint on the widespread adoption and demand for hybrid power solutions globally. While hybrid power systems offer numerous benefits in terms of sustainability, reliability, and operational cost savings, the higher upfront investment can deter potential users, especially in regions or industries with budget constraints or limited access to financing options.
One of the primary factors contributing to the higher initial expenditure of hybrid power solutions is the integration of renewable energy components, such as solar panels and wind turbines. While renewable energy technologies have become more affordable over the years, they still involve higher upfront costs compared to conventional diesel generators. The costs associated with the purchase, installation, and commissioning of solar panels, wind turbines, batteries, and other renewable components can be substantial, particularly for larger systems with higher power ratings. Additionally, the need for specialized expertise in designing and implementing hybrid power solutions can add to the overall cost.
Opportunity: Reduction of carbon emissions
Hybrid power solutions are a combination of two or more different energy sources, such as solar, wind, and natural gas. They can help to reduce carbon emissions by reducing the reliance on fossil fuels, which are a major source of greenhouse gas emissions. For example, a hybrid power system that includes solar panels and a battery storage system can help to reduce carbon emissions in three ways:
Solar panels can generate electricity during the day, when the sun is shining. This can help to reduce the need for electricity from fossil fuel-fired power plants during peak demand hours. The battery storage system can store excess electricity generated by the solar panels during the day. This electricity can then be used to meet demand at night or during other times when the solar panels are not producing electricity.
Challenges: Complex system integration
Hybrid power solutions combine renewable sources with diesel generators, necessitating specific skills, local expertise, and a thorough assessment of the electrical infrastructure. A proficient power system designer is crucial for selecting the appropriate system that meets the power demand. They must possess hands-on experience in implementing hybrid solutions. To ensure the successful operation of hybrid power solutions, the operating personnel should have comprehensive knowledge of monitoring systems and a deep understanding of the overall system. Monitoring and controlling the performance of these solutions is vital to optimize their efficiency.
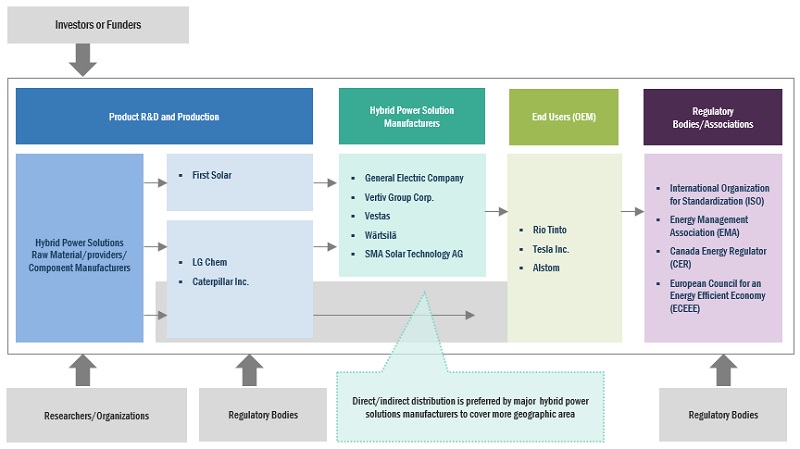
Hybrid Power Solutions Market Ecosystem
Notable players in this industry comprise long-standing, financially robust manufacturers of Hybrid power solutions Market and related components. These companies have a significant track record in the market, offering a wide range of products, employing cutting-edge technologies, and maintaining robust global sales and marketing networks. Prominent companies in this market include Vertiv (US), General Electric (US), Siemens Energy (Germany), SMA Solar Technology AG (Germany), Vestas (Denmark), Wartsila (Finland).
Solar-wind is expected to be the largest market on based on system type
The hybrid power solutions by system type has been segmented into Solar-fossil, Wind-fossil, Solar-wind-fossil, Solar-wind, and Others. Solar-Wind is expected to be the largest segment by system type, as majorly a concept used in power plants. Hece, largest. Multiple projects are coming up globally, enhancing the adoption of this technology.
Residential, by end user, to hold the second largest market share during the forecast period during the forecast period
The market has segmented by end user into residential, commercial, and industrial. Residential segment is expected to be the second largest segment in the market by end user due to the adoption of solar in conjunction with diesel gensets, especially in off-grid locations. Moreover, the indirect adoption of grid-connected renewable based power also enhances the segmental landscape.
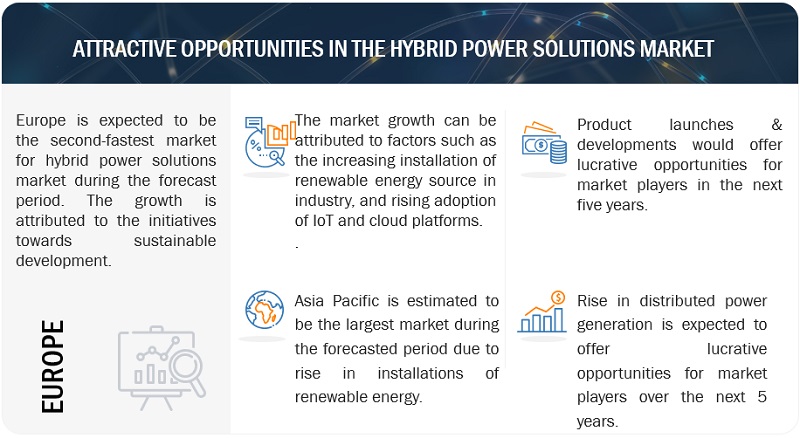
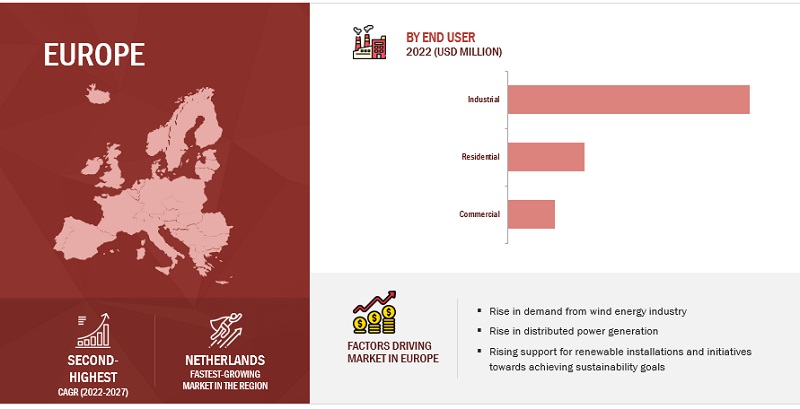
Europe is expected to account for the second fastest market during the forecast period.
Europe is a second fastest market due to the high number of projects in terms of retrofitting solar photovoltaic systems in hybrid power plants market. As countries in Europe work towards achieving carbon neutrality and meeting their renewable energy targets, hybrid power systems have emerged as a versatile and efficient solution to optimize energy generation and enhance grid stability. Furthermore, supportive policies and financial incentives from European governments have attracted investments in hybrid power projects. The European Union's focus on fostering green innovation and supporting sustainable energy initiatives has created a favorable environment for the growth of the hybrid power solutions market. Moreover, the versatility and adaptability of hybrid systems have captured the interest of diverse sectors in Europe, including industries, businesses, and residential users. Hybrid power solutions provide a scalable and flexible approach to cater to varying energy needs, from large-scale industrial applications to remote and off-grid locations. There are many projects, for instance, The Haringvliet energy park in the Netherlands is Europe's largest hybrid renewable energy park, integrating wind and solar plants with energy storage to ensure a reliable and sustainable power supply. The energy park will include a wind farm (22MW), a solar farm (38MW) and a 12MWh energy storage unit.
Key Market Players
The hybrid power solution market is dominated by a few major players that have a wide regional presence. The major players in the hybrid power solutions market are Vertiv (US), General Electric (US), Siemens Energy (Germany), Vestas (Denmark), Wartsila (Finland). Between 2018 and 2022, Strategies such as product launches, contracts, agreements, partnerships, collaborations, alliances, acquisitions, and expansions are followed by these companies to capture a larger share of the hybrid power solutions market.
Scope of the Report
|
Report Metric |
Details |
|
Market size available for years |
2021–2028 |
|
Base year considered |
2022 |
|
Forecast period |
2024–2028 |
|
Forecast units |
Value (USD) |
|
Segments covered |
System Type, Grid Connectivity, Power Rating, End User Industry, and Region |
|
Geographies covered |
Asia Pacific, North America, Europe, Middle East & Africa, and South America |
|
Companies covered |
Vertiv (US), Siemens Energy (Germany), SMA Solar Technologies Co., Ltd. (Germany), ZTE Corporation (China), Huawei Technolofgies Co., Ltd. (China), Chint Group (China), Fronius International GmbH (Austria), Silever Power Systems (UK), Wuxi chway Technology Co., Ltd. (China), Danvest BV (Netherlands), Clear BLUE Technologies Inc. (Canada), Pfistere holding AG (Germany), Vergnet SA (France), Wartsila (Finland), Delta Electronics, Inc. (Taiwan), General Electric Company (US), MAN Energy Solutions (Germany), Longi (China), Vestas (Denmark) |
This research report categorizes the hybrid power solutions market by type, end user industry, module, and region
On the basis of system type:
- Solar-fossil
- Wind-fossil
- Solar-wind-fossil
- Solar-wind
- Others
On the basis of end user:
- Residential
- Commercial
- Industrial
On the basis of by capacity:
- Upto 100 kW
- 100 kW-1 MW
- Above 1 MW
On the basis of by grid connectivity:
- On-grid
- Off-grid
On the basis of region:
- Asia Pacific
- Europe
- North America
- Middle East & Africa
- South America
Recent Developments
- In July 2023, General Electric Company signed a Memorandum of Understanding (MoU) with Fortune Electric Co., Ltd. to manufacture its Battery Energy Storage Solutions (BESS) in Taiwan. This MoU enhances General Electric Company’s market position in Taiwan by the introduction of its energy storage portfolio in the country.
- In November 2023, Siemens Energy was awarded the project to construct a hybrid power plant in French Guiana, located near Saint-Laurent-du-Maroni in northeast South America. The plant will utilize solar power exclusively to generate climate-neutral electricity, ensuring a continuous supply to approximately 10,000 households. In addition , Siemens Energy will provide operation and maintenance services for a period of 25 years, including remote control capabilities for the plant.
- In December 2020, Vestas and Mitsubishi Heavy Industries (MHI) finalized their agreement to expand their partnership in sustainable energy. As part of the agreement, Vestas has acquired MHI's shares in the MHI Vestas Offshore Wind (MVOW) joint venture, while MHI has acquired a 2.5% stake in Vestas and will be nominated to a seat on Vestas' board of directors.
Frequently Asked Questions (FAQ):
What is the current size of the hybrid power solutions market?
The current market size of global hybrid power solutions market is USD 2.4 billion in 2023.
What is the major drivers for hybrid power solutions market?
The global hybrid power solutions market is driven by in off-grid locations is fueled by the increasing need for reliable and sustainable electricity solutions in areas with limited or no access to centralized power grids. Off-grid regions, such as remote rural communities, island communities, mining operations, and telecommunication sites in remote areas, face significant challenges in meeting their energy demands.
Which is the second-fastest-growing region during the forecasted period in hybrid power solutions market?
Europe is the second fastest-growing market as there is a greater demand for power, which is enhancing the investment in development of hybrid power solutions, further driving the hybrid power solutions market. India, a significant market in the region, has seen multiple projects for the solar-wind power plants in the recent years. The region’s growing stringent environmental regulations is leading to an increased demand for hybrid power solutions.
Which is the fastest-growing segment, by system type during the forecasted period in hybrid power solutions market?
The solar-wind system type segment is witnessing a good growth as majorly a concept used in power plants. As multiple projects are coming up globally, the segment is anticipated to be the fastest-growing in the coming years.
Which is the second largest-growing segment, by end user during the forecasted period in hybrid power solutions market?
In the hybrid power solutions market, residential is the second largest market due to adoption of solar in conjunction with diesel gensets, especially in off-grid locations.
To speak to our analyst for a discussion on the above findings, click Speak to Analyst


- 5.1 INTRODUCTION
-
5.2 MARKET DYNAMICSDRIVERS- Increased hybrid power generation in off-grid locations- Lower operating costs than conventional diesel generatorsRESTRAINTS- High initial investments- Higher payback time than conventional diesel generatorsOPPORTUNITIES- Reduction in carbon emissions- Growing requirement for uninterrupted power from telecom infrastructure operatorsCHALLENGES- Complex system integration- Solar panel failures
-
5.3 TRENDS/DISRUPTIONS IMPACTING CUSTOMERS’ BUSINESSES
-
5.4 ECOSYSTEM ANALYSIS
-
5.5 VALUE CHAIN ANALYSISRAW MATERIAL PROVIDERS/SUPPLIERS/COMPONENT MANUFACTURERSHYBRID POWER SOLUTION MANUFACTURERS/ASSEMBLERSSYSTEM INTEGRATORSDISTRIBUTORS/RESELLERSPROJECT DEVELOPERS AND ENGINEERING, PROCUREMENT, AND CONSTRUCTION (EPC) COMPANIESEND USERSMAINTENANCE AND SERVICE PROVIDERS
- 5.6 PRICING ANALYSIS
-
5.7 TECHNOLOGY ANALYSISSMART MICROGRID
-
5.8 TARIFFS, CODES, AND REGULATIONSTARIFF RELATED TO HYBRID POWER SOLUTION UNITSCODES AND REGULATIONS RELATED TO HYBRID POWER SOLUTIONSCARBON-REDUCTION POLICY TRENDS IN ENERGY INDUSTRYCLIMATE SOLUTIONS ACTREGULATIONS RELATED TO HYBRID POWER SOLUTIONS
-
5.9 PATENT ANALYSIS
-
5.10 TRADE ANALYSISEXPORT SCENARIO FOR ELECTRIC MOTORS AND GENERATORSIMPORT SCENARIO FOR ELECTRIC MOTORS AND GENERATORS
- 5.11 KEY CONFERENCES AND EVENTS, 2023–2024
-
5.12 CASE STUDY ANALYSISMAN ENERGY SOLUTIONS TACKLED CHALLENGE OF RELIABLE POWER SUPPLY BY COMBINING RENEWABLE ENERGY SOURCES WITH HIGHLY ADAPTABLE GENSETSMAN ENERGY SOLUTIONS BUILT NEW HYBRID POWER SYSTEM FOR MINING INDUSTRY
-
5.13 PORTER’S FIVE FORCES ANALYSISTHREAT OF SUBSTITUTESBARGAINING POWER OF SUPPLIERSBARGAINING POWER OF BUYERSTHREAT OF NEW ENTRANTSINTENSITY OF COMPETITIVE RIVALRY
-
5.14 KEY STAKEHOLDERS AND BUYING CRITERIAKEY STAKEHOLDERS IN BUYING PROCESSBUYING CRITERIA
- 6.1 INTRODUCTION
-
6.2 SOLAR-FOSSILINCREASING DEMAND FOR CLEAN ENERGY TO COMBAT CLIMATE CHANGE AND REDUCE GREENHOUSE GAS EMISSIONS
-
6.3 WIND-FOSSILCAPABILITY TO ADDRESS INTERMITTENCY OF WIND ENERGY AND ENSURE STABLE AND RELIABLE ELECTRICITY SUPPLY
-
6.4 SOLAR-WIND-FOSSILHIGH EFFICIENCY AND ABILITY TO OVERCOME CHALLENGES OF INTERMITTENT SOLAR AND WIND ENERGY
-
6.5 SOLAR-WINDRISING DEVELOPMENT OF LARGE-SCALE POWER PLANTS
- 6.6 OTHERS
- 7.1 INTRODUCTION
-
7.2 UP TO 100 KWHIGH ADOPTION IN RESIDENTIAL SECTOR
-
7.3 100 KW–1 MWVERSATILITY AND ABILITY TO MEET SPECIFIC ENERGY NEEDS
-
7.4 ABOVE 1 MWINCREASING INVESTMENTS IN LARGE-SCALE HYBRID POWER PLANTS
- 8.1 INTRODUCTION
-
8.2 ON-GRIDGROWING NEED TO REDUCE POWER PEAK DEMAND AND GREENHOUSE GAS EMISSIONS
-
8.3 OFF-GRIDINCREASING REQUIREMENT FOR RELIABLE POWER IN REMOTE AREAS
- 9.1 INTRODUCTION
-
9.2 RESIDENTIALRISING NEED TO REDUCE RELIANCE ON TRADITIONAL GRID ELECTRICITY
-
9.3 COMMERCIALGROWING ADOPTION TO MEET ENERGY NEEDS AND REDUCE OPERATIONAL COSTS
-
9.4 INDUSTRIALHIGH POWER REQUIREMENT IN REMOTE LOCATIONS
- 10.1 INTRODUCTION
-
10.2 ASIA PACIFICASIA PACIFIC: RECESSION IMPACTBY SYSTEM TYPEBY CAPACITYBY END USERBY GRID CONNECTIVITYBY COUNTRY- China- India- Japan- Australia- South Korea- Taiwan- Rest of Asia Pacific
-
10.3 MIDDLE EAST & AFRICAMIDDLE EAST & AFRICA: RECESSION IMPACTBY SYSTEM TYPEBY CAPACITYBY END USERBY GRID CONNECTIVITYBY COUNTRY- Egypt- Nigeria- Senegal- South Africa- Rest of Middle East & Africa
-
10.4 EUROPERECESSION IMPACT: EUROPEBY SYSTEM TYPEBY CAPACITYBY END USERBY GRID CONNECTIVITYBY COUNTRY- UK- Germany- Sweden- France- Netherlands- Spain- Rest of Europe
-
10.5 NORTH AMERICANORTH AMERICA: RECESSION IMPACTBY SYSTEM TYPEBY CAPACITYBY END USERBY GRID CONNECTIVITYBY COUNTRY- US- Canada- Mexico
-
10.6 SOUTH AMERICASOUTH AMERICA: RECESSION IMPACTBY SYSTEM TYPEBY CAPACITYBY END USERBY GRID CONNECTIVITYBY COUNTRY- Brazil- Chile- Rest of South America

-
11.1 OVERVIEWKEY STRATEGIES ADOPTED BY MAJOR PLAYERS
- 11.2 MARKET SHARE ANALYSIS, 2022
- 11.3 REVENUE ANALYSIS, 2018–2022
-
11.4 COMPANY EVALUATION MATRIX, 2022STARSPERVASIVE PLAYERSEMERGING LEADERSPARTICIPANTS
- 11.5 COMPETITIVE BENCHMARKING
- 11.6 COMPETITIVE SCENARIOS AND TRENDS
-
12.1 KEY PLAYERSVERTIV GROUP CORP.- Business overview- Products/Solutions/Services offered- MnM viewGENERAL ELECTRIC- Business overview- Products/Solutions/Services offered- Recent developments- MnM viewSIEMENS ENERGY- Business overview- Products/Solutions/Services offered- Recent developments- MnM viewVESTAS- Business overview- Products/Solutions/Services offered- Recent developments- MnM viewWÄRTSILÄ- Business overview- Products/Solutions/Services offered- Recent developments- MnM viewSMA SOLAR TECHNOLOGY AG- Business overview- Products/Solutions/Services offeredHUAWEI TECHNOLOGIES CO., LTD.- Business overview- Products/Solutions/Services offered- Recent developmentsZTE CORPORATION- Business overview- Products/Solutions/Services offeredDELTA ELECTRONICS, INC.- Business overview- Products/Solutions/Services offered- Recent developmentsLONGI- Business overview- Products/Solutions/Services offered- Recent developmentsCHINT GROUP- Business overview- Products/Solutions/Services offeredVERGNET SA- Business overview- Products/Solutions/Services offeredFRONIUS INTERNATIONAL GMBH- Business overview- Products/Solutions/Services offeredPFISTERER HOLDING AG- Business overview- Products/Solutions/Services offeredMAN ENERGY SOLUTIONS- Business overview- Products/Solutions/Services offered
-
12.2 OTHER PLAYERSDANVEST BVSILVER POWER SYSTEMSWUXI CHWAY TECHNOLOGY CO., LTD.FOSHAN TANFON ENERGY CO., LTD.CLEAR BLUE TECHNOLOGIES INC.
- 13.1 INSIGHTS FROM INDUSTRY EXPERTS
- 13.2 DISCUSSION GUIDE
- 13.3 KNOWLEDGESTORE: MARKETSANDMARKETS’ SUBSCRIPTION PORTAL
- 13.4 CUSTOMIZATION OPTIONS
- 13.5 RELATED REPORTS
- 13.6 AUTHOR DETAILS
- TABLE 1 MARKET: INCLUSIONS AND EXCLUSIONS, BY SYSTEM TYPE
- TABLE 2 MARKET: INCLUSIONS AND EXCLUSIONS, BY CAPACITY
- TABLE 3 MARKET: INCLUSIONS AND EXCLUSIONS, BY GRID CONNECTIVITY
- TABLE 4 MARKET: INCLUSIONS AND EXCLUSIONS, BY END USER
- TABLE 5 MARKET SNAPSHOT
- TABLE 6 EMISSION REDUCTION TARGETS
- TABLE 7 MARKET: ECOSYSTEM ANALYSIS
- TABLE 8 AVERAGE SELLING PRICE (ASP) OF HYBRID POWER SOLUTIONS, BY SYSTEM TYPE (USD THOUSAND/MW)
- TABLE 9 AVERAGE SELLING PRICE (ASP) ANALYSIS, BY REGION (2021 AND 2028)
- TABLE 10 TARIFF RELATED TO ELECTRIC MOTORS AND GENERATORS
- TABLE 11 TARIFF RELATED TO HYDROGEN
- TABLE 12 MARKET: REGULATIONS
- TABLE 13 MARKET: INNOVATIONS AND PATENT REGISTRATIONS
- TABLE 14 EXPORT SCENARIO FOR HS CODE: 8501, BY COUNTRY, '2020–2022 (USD THOUSAND)
- TABLE 15 IMPORT SCENARIO FOR HS CODE: 8501, BY COUNTRY, 2020–2022 (USD THOUSAND)
- TABLE 16 MARKET: LIST OF CONFERENCES AND EVENTS
- TABLE 17 MARKET: PORTER’S FIVE FORCES ANALYSIS
- TABLE 18 INFLUENCE OF STAKEHOLDERS ON BUYING PROCESS, BY END USER (%)
- TABLE 19 KEY BUYING CRITERIA, BY END USER
- TABLE 20 MARKET, BY SYSTEM TYPE, 2021–2028 (USD MILLION)
- TABLE 21 SOLAR-FOSSIL: MARKET, BY REGION, 2021–2028 (USD MILLION)
- TABLE 22 WIND-FOSSIL: MARKET, BY REGION, 2021–2028 (USD MILLION)
- TABLE 23 SOLAR-WIND-FOSSIL: MARKET, BY REGION, 2021–2028 (USD MILLION)
- TABLE 24 SOLAR-WIND: MARKET, BY REGION, 2021–2028 (USD MILLION)
- TABLE 25 OTHERS: MARKET, BY REGION, 2021–2028 (USD MILLION)
- TABLE 26 MARKET, BY CAPACITY, 2021–2028 (USD MILLION)
- TABLE 27 UP TO 100 KW: MARKET, BY REGION, 2021–2028 (USD MILLION)
- TABLE 28 100 KW–1 MW: MARKET, BY REGION, 2021–2028 (USD MILLION)
- TABLE 29 ABOVE 1 MW: MARKET, BY REGION, 2021–2028 (USD MILLION)
- TABLE 30 MARKET, BY GRID CONNECTIVITY, 2021–2028 (USD MILLION)
- TABLE 31 ON-GRID: MARKET, BY REGION, 2021–2028 (USD MILLION)
- TABLE 32 OFF-GRID: MARKET, BY REGION, 2021–2028 (USD MILLION)
- TABLE 33 MARKET, BY END USER, 2021–2028 (USD MILLION)
- TABLE 34 RESIDENTIAL: MARKET, BY REGION, 2021–2028 (USD MILLION)
- TABLE 35 COMMERCIAL: MARKET, BY REGION, 2021–2028 (USD MILLION)
- TABLE 36 INDUSTRIAL: MARKET, BY REGION, 2021–2028 (USD MILLION)
- TABLE 37 MARKET, BY REGION, 2021–2028 (USD MILLION)
- TABLE 38 MARKET, BY REGION, 2021–2028 (MW)
- TABLE 39 ASIA PACIFIC: MARKET, BY SYSTEM TYPE, 2021–2028 (USD MILLION)
- TABLE 40 ASIA PACIFIC: MARKET, BY CAPACITY, 2021–2028 (USD MILLION)
- TABLE 41 ASIA PACIFIC: MARKET, BY END USER, 2021–2028 (USD MILLION)
- TABLE 42 ASIA PACIFIC: MARKET, BY GRID CONNECTIVITY, 2021–2028 (USD MILLION)
- TABLE 43 ASIA PACIFIC: MARKET, BY COUNTRY, 2021–2028 (USD MILLION)
- TABLE 44 CHINA: MARKET, BY END USER, 2021–2028 (USD MILLION)
- TABLE 45 INDIA: MARKET, BY END USER, 2021–2028 (USD MILLION)
- TABLE 46 JAPAN: MARKET, BY END USER, 2021–2028 (USD MILLION)
- TABLE 47 AUSTRALIA: MARKET, BY END USER, 2021–2028 (USD MILLION)
- TABLE 48 SOUTH KOREA: MARKET, BY END USER, 2021–2028 (USD MILLION)
- TABLE 49 TAIWAN: MARKET, BY END USER, 2021–2028 (USD MILLION)
- TABLE 50 REST OF ASIA PACIFIC: MARKET, BY END USER, 2021–2028 (USD MILLION)
- TABLE 51 MIDDLE EAST & AFRICA: MARKET, BY SYSTEM TYPE, 2021–2028 (USD MILLION)
- TABLE 52 MIDDLE EAST & AFRICA: MARKET, BY CAPACITY, 2021–2028 (USD MILLION)
- TABLE 53 MIDDLE EAST & AFRICA: MARKET, BY END USER, 2021–2028 (USD MILLION)
- TABLE 54 MIDDLE EAST & AFRICA: MARKET, BY GRID CONNECTIVITY, 2021–2028 (USD MILLION)
- TABLE 55 MIDDLE EAST & AFRICA: MARKET, BY COUNTRY, 2021–2028 (USD MILLION)
- TABLE 56 EGYPT: MARKET, BY END USER, 2021–2028 (USD MILLION)
- TABLE 57 NIGERIA: MARKET, BY END USER, 2021–2028 (USD MILLION)
- TABLE 58 SENEGAL: MARKET, BY END USER, 2021–2028 (USD MILLION)
- TABLE 59 SOUTH AFRICA: MARKET, BY END USER, 2021–2028 (USD MILLION)
- TABLE 60 REST OF MIDDLE EAST & AFRICA: MARKET, BY END USER, 2021–2028 (USD MILLION)
- TABLE 61 EUROPE: MARKET, BY SYSTEM TYPE, 2021–2028 (USD MILLION)
- TABLE 62 EUROPE: MARKET, BY CAPACITY, 2021–2028 (USD MILLION)
- TABLE 63 EUROPE: MARKET, BY END USER, 2021–2028 (USD MILLION)
- TABLE 64 EUROPE: MARKET, BY GRID CONNECTIVITY, 2021–2028 (USD MILLION)
- TABLE 65 EUROPE: MARKET, BY COUNTRY, 2021–2028 (USD MILLION)
- TABLE 66 UK: MARKET, BY END USER, 2021–2028 (USD MILLION)
- TABLE 67 GERMANY: MARKET, BY END USER, 2021–2028 (USD MILLION)
- TABLE 68 SWEDEN: MARKET, BY END USER, 2021–2028 (USD MILLION)
- TABLE 69 FRANCE: MARKET, BY END USER, 2021–2028 (USD MILLION)
- TABLE 70 NETHERLANDS: MARKET, BY END USER, 2021–2028 (USD MILLION)
- TABLE 71 SPAIN: MARKET, BY END USER, 2021–2028 (USD MILLION)
- TABLE 72 REST OF EUROPE: MARKET, BY END USER, 2021–2028 (USD MILLION)
- TABLE 73 NORTH AMERICA: MARKET, BY SYSTEM TYPE, 2021–2028 (USD MILLION)
- TABLE 74 NORTH AMERICA: MARKET, BY CAPACITY, 2021–2028 (USD MILLION)
- TABLE 75 NORTH AMERICA: MARKET, BY END USER, 2021–2028 (USD MILLION)
- TABLE 76 NORTH AMERICA: MARKET, BY GRID CONNECTIVITY, 2021–2028 (USD MILLION)
- TABLE 77 NORTH AMERICA: MARKET, BY COUNTRY, 2021–2028 (USD MILLION)
- TABLE 78 US: MARKET, BY END USER, 2021–2028 (USD MILLION)
- TABLE 79 CANADA: MARKET, BY END USER, 2021–2028 (USD MILLION)
- TABLE 80 MEXICO: MARKET, BY END USER, 2021–2028 (USD MILLION)
- TABLE 81 SOUTH AMERICA: MARKET, BY SYSTEM TYPE, 2021–2028 (USD MILLION)
- TABLE 82 SOUTH AMERICA: MARKET, BY CAPACITY, 2021–2028 (USD MILLION)
- TABLE 83 SOUTH AMERICA: MARKET, BY END USER, 2021–2028 (USD MILLION)
- TABLE 84 SOUTH AMERICA: MARKET, BY GRID CONNECTIVITY, 2021–2028 (USD MILLION)
- TABLE 85 SOUTH AMERICA: MARKET, BY COUNTRY, 2021–2028 (USD MILLION)
- TABLE 86 BRAZIL: MARKET, BY END USER, 2021–2028 (USD MILLION)
- TABLE 87 CHILE: MARKET, BY END USER, 2021–2028 (USD MILLION)
- TABLE 88 REST OF SOUTH AMERICA: MARKET, BY END USER, 2021–2028 (USD MILLION)
- TABLE 89 MARKET: KEY STRATEGIES ADOPTED BY MAJOR PLAYERS, 2018–2022
- TABLE 90 SYSTEM TYPE: COMPANY FOOTPRINT
- TABLE 91 END USER: COMPANY FOOTPRINT
- TABLE 92 CAPACITY: COMPANY FOOTPRINT
- TABLE 93 GRID CONNECTIVITY: COMPANY FOOTPRINT
- TABLE 94 REGION: COMPANY FOOTPRINT
- TABLE 95 COMPANY FOOTPRINT
- TABLE 96 MARKET: PRODUCT LAUNCHES, JANUARY 2019–JANUARY 2023
- TABLE 97 MARKET: DEALS, JANUARY 2019–JANUARY 2023
- TABLE 98 MARKET: OTHERS, JANUARY 2019–JANUARY 2023
- TABLE 99 VERTIV GROUP CORP.: COMPANY OVERVIEW
- TABLE 100 VERTIV GROUP CORP.: PRODUCTS/SOLUTIONS/SERVICES OFFERED
- TABLE 101 GENERAL ELECTRIC: COMPANY OVERVIEW
- TABLE 102 GENERAL ELECTRIC: PRODUCTS/SOLUTIONS/SERVICES OFFERED
- TABLE 103 GENERAL ELECTRIC: PRODUCT LAUNCHES
- TABLE 104 GENERAL ELECTRIC: DEALS
- TABLE 105 GENERAL ELECTRIC: OTHERS
- TABLE 106 SIEMENS ENERGY: COMPANY OVERVIEW
- TABLE 107 SIEMENS ENERGY: PRODUCTS/SOLUTIONS/SERVICES OFFERED
- TABLE 108 SIEMENS ENERGY: DEALS
- TABLE 109 VESTAS: COMPANY OVERVIEW
- TABLE 110 VESTAS: PRODUCTS/SOLUTIONS/SERVICES OFFERED
- TABLE 111 VESTAS: OTHERS
- TABLE 112 WÄRTSILÄ: COMPANY OVERVIEW
- TABLE 113 WÄRTSILÄ: PRODUCTS/SOLUTIONS/SERVICES OFFERED
- TABLE 114 WÄRTSILÄ: PRODUCT LAUNCHES
- TABLE 115 WÄRTSILÄ: DEALS
- TABLE 116 WÄRTSILÄ: OTHERS
- TABLE 117 SMA SOLAR TECHNOLOGY AG: COMPANY OVERVIEW
- TABLE 118 SMA SOLAR TECHNOLOGY AG: PRODUCTS/SOLUTIONS/SERVICES OFFERED
- TABLE 119 HUAWEI TECHNOLOGIES CO., LTD.: COMPANY OVERVIEW
- TABLE 120 HUAWEI TECHNOLOGIES CO., LTD.: PRODUCTS/SOLUTIONS/SERVICES OFFERED
- TABLE 121 HUAWEI TECHNOLOGIES CO. LTD.: PRODUCT LAUNCHES
- TABLE 122 ZTE CORPORATION: COMPANY OVERVIEW
- TABLE 123 ZTE CORPORATION: PRODUCTS/SOLUTIONS/SERVICES OFFERED
- TABLE 124 DELTA ELECTRONICS, INC.: COMPANY OVERVIEW
- TABLE 125 DELTA ELECTRONICS, INC.: PRODUCTS/SOLUTIONS/SERVICES OFFERED
- TABLE 126 DELTA ELECTRONICS, INC.: DEALS
- TABLE 127 LONGI: COMPANY OVERVIEW
- TABLE 128 LONGI: PRODUCTS/SOLUTIONS/SERVICES OFFERED
- TABLE 129 LONGI: DEALS
- TABLE 130 CHINT GROUP: COMPANY OVERVIEW
- TABLE 131 CHINT GROUP: PRODUCTS/SOLUTIONS/SERVICES OFFERED
- TABLE 132 VERGNET SA: COMPANY OVERVIEW
- TABLE 133 VERGNET SA: PRODUCTS/SOLUTIONS/SERVICES OFFERED
- TABLE 134 FRONIUS INTERNATIONAL GMBH: COMPANY OVERVIEW
- TABLE 135 FRONIUS INTERNATIONAL GMBH: PRODUCTS/SOLUTIONS/SERVICES OFFERED
- TABLE 136 PFISTERER HOLDING AG: COMPANY OVERVIEW
- TABLE 137 PFISTERER HOLDING AG: PRODUCTS/SOLUTIONS/SERVICES OFFERED
- TABLE 138 MAN ENERGY SOLUTIONS: COMPANY OVERVIEW
- TABLE 139 MAN ENERGY SOLUTIONS: PRODUCTS/SOLUTIONS/SERVICES OFFERED
- FIGURE 1 MARKET: RESEARCH DESIGN
- FIGURE 2 DATA TRIANGULATION
- FIGURE 3 MAIN METRICS CONSIDERED TO ANALYZE AND ASSESS DEMAND FOR HYBRID POWER SOLUTIONS
- FIGURE 4 MARKET SIZE ESTIMATION METHODOLOGY: BOTTOM-UP APPROACH
- FIGURE 5 MARKET SIZE ESTIMATION METHODOLOGY: TOP-DOWN APPROACH
- FIGURE 6 KEY STEPS CONSIDERED TO ASSESS SUPPLY OF HYBRID POWER SOLUTIONS
- FIGURE 7 MARKET: SUPPLY-SIDE ANALYSIS
- FIGURE 8 SOUTH AMERICA TO REGISTER HIGHEST CAGR IN MARKET DURING FORECAST PERIOD
- FIGURE 9 ABOVE 1 MW SEGMENT TO LEAD MARKET DURING FORECAST PERIOD
- FIGURE 10 ON-GRID TO BE DOMINANT SEGMENT IN MARKET DURING FORECAST PERIOD
- FIGURE 11 INDUSTRIAL SEGMENT TO LEAD MARKET DURING FORECAST PERIOD
- FIGURE 12 SOLAR-WIND SEGMENT TO LEAD MARKET DURING FORECAST PERIOD
- FIGURE 13 RISING ADOPTION OF RENEWABLE SOURCES IN POWER GENERATION
- FIGURE 14 SOUTH AMERICAN MARKET TO REGISTER HIGHEST CAGR DURING FORECAST PERIOD
- FIGURE 15 INDUSTRIAL SEGMENT AND US HELD LARGEST SHARES OF NORTH AMERICAN MARKET IN 2022
- FIGURE 16 SOLAR-WIND SEGMENT TO DOMINATE MARKET IN 2028
- FIGURE 17 INDUSTRIAL SEGMENT TO ACCOUNT FOR LARGEST SHARE OF MARKET IN 2028
- FIGURE 18 ON-GRID SEGMENT TO ACCOUNT FOR LARGER SHARE OF MARKET IN 2028
- FIGURE 19 ABOVE 1 MW SEGMENT TO ACCOUNT FOR LARGEST SHARE OF MARKET IN 2028
- FIGURE 20 MARKET: DRIVERS, RESTRAINTS, OPPORTUNITIES, AND CHALLENGES
- FIGURE 21 OFF-GRID CAPACITY, BY SOURCE, 2019–2021
- FIGURE 22 OFFSHORE WIND INSTALLATION CAPACITY (GW), BY REGION, 2018–2050
- FIGURE 23 FLUCTUATIONS IN GLOBAL FUEL PRICES, 2015–2019
- FIGURE 24 CAPITAL COST ASSOCIATED WITH SOLAR-DIESEL-BASED HYBRID POWER SOLUTIONS, BY COMPONENT (%)
- FIGURE 25 REVENUE SHIFTS AND NEW REVENUE POCKETS FOR PLAYERS IN MARKET
- FIGURE 26 MARKET: ECOSYSTEM ANALYSIS
- FIGURE 27 MARKET: VALUE CHAIN ANALYSIS
- FIGURE 28 AVERAGE SELLING PRICE (ASP) OF HYBRID POWER SOLUTIONS, BY SYSTEM TYPE
- FIGURE 29 AVERAGE SELLING PRICE (ASP) ANALYSIS, BY REGION (2021 AND 2028)
- FIGURE 30 MARKET: PORTER’S FIVE FORCES ANALYSIS
- FIGURE 31 INFLUENCE OF STAKEHOLDERS ON BUYING PROCESS, BY END USER
- FIGURE 32 KEY BUYING CRITERIA, BY END USER
- FIGURE 33 MARKET, BY SYSTEM TYPE, 2022
- FIGURE 34 MARKET, BY CAPACITY, 2022
- FIGURE 35 MARKET, BY GRID CONNECTIVITY, 2022
- FIGURE 36 MARKET, BY END USER, 2022
- FIGURE 37 SOUTH AMERICAN MARKET TO REGISTER HIGHEST CAGR FROM 2023 TO 2028
- FIGURE 38 MARKET, BY REGION, 2022 (%)
- FIGURE 39 ASIA PACIFIC: SNAPSHOT OF MARKET
- FIGURE 40 MIDDLE EAST & AFRICA: SNAPSHOT OF MARKET
- FIGURE 41 EUROPE: SNAPSHOT OF MARKET
- FIGURE 42 MARKET SHARE ANALYSIS, 2022
- FIGURE 43 MARKET: REVENUE ANALYSIS, 2018–2022
- FIGURE 44 HYBRID POWER SOLUTIONS MARKET: COMPANY EVALUATION MATRIX, 2022
- FIGURE 45 VERTIV GROUP CORP.: COMPANY SNAPSHOT
- FIGURE 46 GENERAL ELECTRIC: COMPANY SNAPSHOT
- FIGURE 47 SIEMENS ENERGY: COMPANY SNAPSHOT
- FIGURE 48 VESTAS: COMPANY SNAPSHOT
- FIGURE 49 WÄRTSILÄ: COMPANY SNAPSHOT
- FIGURE 50 SMA SOLAR TECHNOLOGY AG: COMPANY SNAPSHOT
- FIGURE 51 ZTE CORPORATION: COMPANY SNAPSHOT
- FIGURE 52 DELTA ELECTRONICS, INC.: COMPANY SNAPSHOT
- FIGURE 53 LONGI: COMPANY SNAPSHOT
The study involved major activities in estimating the current size of the hybrid power solutions market. Exhaustive secondary research was done to collect information on the peer and parent markets. The next step was to validate these findings, assumptions, and sizing with industry experts across the value chain through primary research. Both top-down and bottom-up approaches were employed to estimate the complete market size. Thereafter, market breakdown and data triangulation were used to estimate the market size of the segments and subsegments.
Secondary Research
This research study on the hybrid power solutions market involved the use of extensive secondary sources, directories, and databases, such as Hoovers, Bloomberg, Businessweek, Factiva, International Energy Agency, and BP Statistical Review of World Energy, to identify and collect information useful for a technical, market-oriented, and commercial study of the global hybrid power solutions market. The other secondary sources included annual reports, press releases & investor presentations of companies, white papers, certified publications, articles by recognized authors, manufacturer associations, trade directories, and databases.
Primary Research
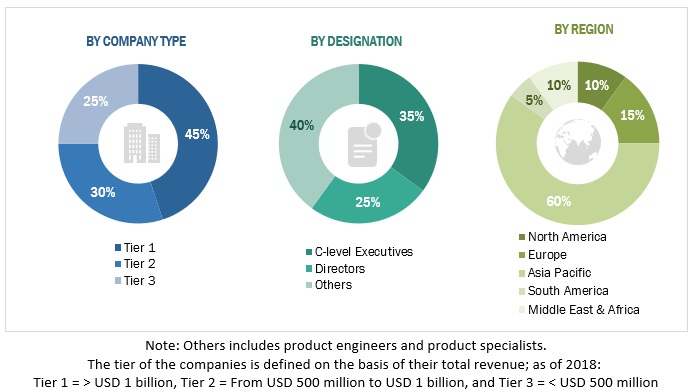
The hybrid power solutions market comprises several stakeholders such as generator manufacturers, manufacturers of subcomponents of hybrid power solutions, manufacturing technology providers, and technology support providers in the supply chain. The demand side of this market is characterized by the rising demand for uninterrupted power supply from end users. Moreover, the demand is also driven by the rising demand from data centers & IT facilities. The supply side is characterized by rising demand for contracts from the industrial sector, and mergers & acquisitions among big players. Various primary sources from both the supply and demand sides of the market were interviewed to obtain qualitative and quantitative information. Following is the breakdown of primary respondents:
To know about the assumptions considered for the study, download the pdf brochure
Market Size Estimation
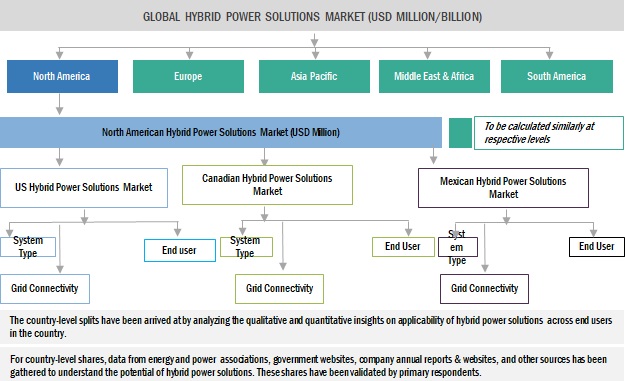
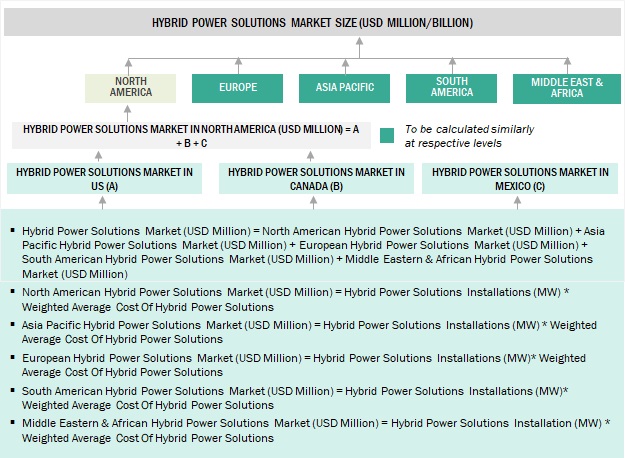
Both top-down and bottom-up approaches were used to estimate and validate the total size of the hybrid power solutions market. These methods were also used extensively to estimate the size of various subsegments in the market. The research methodology used to estimate the market size includes the following:
- The key players in the industry and market have been identified through extensive secondary research, and their market share in the respective regions have been determined through both primary and secondary research.
- The industry’s value chain and market size, in terms of value, have been determined through primary and secondary research processes.
- All percentage shares, splits, and breakdowns have been determined using secondary sources and verified through primary sources.
Global Hybrid Power Solutions Market Size: Top-down Approach
To know about the assumptions considered for the study, Request for Free Sample Report
Global Hybrid Power Solutions Market Size: Bottom-Up Approach
Data Triangulation
After arriving at the overall market size from the estimation process explained above, the total market has been split into several segments and subsegments. To complete the overall market engineering process and arrive at the exact statistics for all the segments and subsegments, the data triangulation and market breakdown processes have been employed, wherever applicable. The data has been triangulated by studying various factors and trends from both the demand- and supply sides. Along with this, the market has been validated using both the top-down and bottom-up approaches.
Market Definition
A hybrid power solution refers to a unit that combines multiple sources of energy generation to produce electricity. It typically integrates renewable energy sources, such as solar, and wind, with conventional power technologies like diesel generators. The combination of these sources allows for increased efficiency, reliability, and flexibility in electricity production.
Key Stakeholders
- Government & research organizations
- Institutional investors and investment banks
- Investors/shareholders
- Environmental research institutes
Objectives of the Study
- To define, describe, segment, and forecast the hybrid power solutions market, in terms of value and volume, on the basis of system type, end user, grid connectivity, power rating, and region
- To forecast the market size for five key regions: North America, South America, Europe, Asia Pacific, and Middle East & Africa, along with their key countries
- To provide detailed information about the key drivers, restraints, opportunities, and challenges influencing the growth of the market
- To strategically analyze the subsegments with respect to individual growth trends, prospects, and contributions of each segment to the overall market size
- To analyze market opportunities for stakeholders and the competitive landscape of the market
- To strategically profile the key players and comprehensively analyze their market shares and core competencies
- To analyze competitive developments, such as sales contracts, agreements, investments, expansions, new product launches, mergers, partnerships, collaborations, and acquisitions, in the market
Available Customizations:
With the given market data, MarketsandMarkets offers customizations as per the client’s specific needs. The following customization options are available for this report:
Geographic Analysis
- Further breakdown of region or country-specific analysis
Company Information
- Detailed analyses and profiling of additional market players (up to 5)


Growth opportunities and latent adjacency in Hybrid Power Solutions Market