Seismic Survey Market by Service (Data Acquisition (Land, Marine, and Air-Borne), Data Processing, and Interpretation), Technology (2D imaging, 3D imaging, and 4D imaging), and Region - Global Forecast to 2022


[157 Pages Report] The global seismic survey market was USD 7.24 Billion in 2016 and is estimated to grow at a CAGR of 4.24%, from 2017 to 2022. The use of seismic technology in brownfields projects and shale gas exploration is expected to drive the market for seismic surveys.
The years considered for the study are as follows:
- Base Year: 2016
- Estimated Year: 2017
- Projected Year: 2022
- Forecast Period: 2017 to 2022
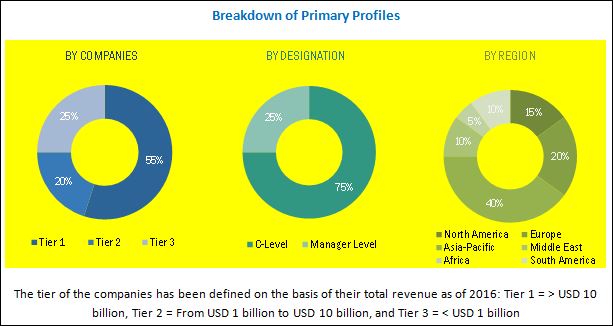
The base year for company profiles is 2016. Whenever information was unavailable for the base year, the prior year has been considered.
Objectives of the Study
- To define and segment the seismic survey market with respect to region
- To estimate the market size, in terms of value, of the market
- To identify factors driving or inhibiting the growth of the market and their present and future impact on the market
- To identify the drivers, restraints, opportunities, and challenges of the seismic survey market
- To analyze major stakeholders in the market and provide details regarding the competitive landscape for key market leaders
- To study the industry trends and forecast the seismic survey market for major regions, namely, Africa and the Middle East, among others
- To strategically identify and profile global as well as local players in the market and comprehensively analyze their market ranking
- To analyze competitive developments such as new product launches, mergers & acquisitions, expansions, and contracts & agreements in market
Note: Geophysical equipment is not been considered in this report
Research Methodology
This research study involved the use of extensive secondary sources, directories, journals on seismic surveys, geophysical studies, and other related equipment market,; newsletters and databases such as Hoover�s, Bloomberg, Businessweek, and Factiva, among others, to identify and collect information useful for a technical, market-oriented, and commercial study of the global seismic survey market. The primary sources are several industry experts from core and related industries, vendors, preferred suppliers, technology developers, alliances, and organizations related to all the segments of this industry�s value chain. The points given below explain the research methodology.
- Study of annual revenue and market developments of major players providing services in the market
- Assessment of future trends and growth of end-users
- Assessment of the market with respect to the technology used for different applications
After arriving at the overall market size, the total market has been split into several segments and subsegments. The figure given below illustrates the breakdown of the primaries conducted during the research study based on company type, designation, and region.
To know about the assumptions considered for the study, download the pdf brochure
Market Ecosystem
The seismic survey market includes power and automation technology companies such as Compagnie Generale de Geophysique (CGG) (France), Fugro N.V. (Netherlands), Petroleum Geo-Services (PGS) (Norway), Schlumberger Limited-Western Geco (U.S.), and Tomlinson Geophysical Services, Inc. (TGS)-Norwegian Petroleum Exploration Consultants (NOPEC) Geophysical Company (Norway), among others.
Target Audience:
- Geophysical service providers
- Oil & gas service companies
- Oil & gas equipment providers
- Drilling and survey companies
- Oil & gas operators
- International and other associations
- Government and research organizations
- Investment banks
Scope of the Report:
- Data Acquisition
- Data Processing
- Data Interpretation
- 2D imaging
- 3D imaging
- 4D imaging
- North America
- Europe
- Asia-Pacific
- South America
- Middle East
- Africa
By Service
By Technology
By Region
Available Customizations:
With the given market data, MarketsandMarkets offers customizations as per the client�s specific needs. The following customization options are available for this report:
Company Information
Detailed analyses and profiling of additional market players (up to five)
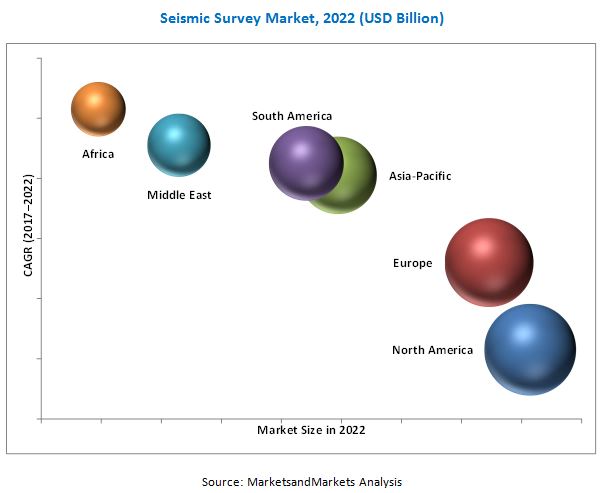
The global seismic survey market is expected to grow at CAGR 4.24%, from 2017 to 2022, and reach a projected value of USD 9.28 Billion by 2022. The growth of the market is likely to be driven by the increased use of seismic technology in brownfield projects and shale gas exploration.
The report segments the seismic survey market into data acquisition, data processing, and data interpretation services and 2D, 3D, and 4D technology. The data acquisition segment is the largest market segment as the data obtained from surveys is helpful in exploring new reserves with longer production lifecycles. Exploration companies use data to find new oil & gas reserves.
The 3D imaging market is expected to grow at the fastest pace during the forecast period. The demand for 3D seismic technology has increased as oil & gas companies use it to solve problems and reduce uncertainties in exploration, development, and production operations. The technology is also used to capture clearer images of geological structures. It also helps improve turnaround time in data acquisition, processing, and interpretation. The 3D imaging gives a clear picture of earth�s surface so companies can invest in new oil & gas reserves.
The African market will offer opportunities for the growth of the seismic survey market. There are large hydrocarbons fields that are yet to be explored in Africa, Thus, creating an opportunity for exploration companies.
The seismic survey market can be directly linked to the ever growing demand for seismic technology in shale gas exploration and brownfield projects. However, factors such as the slump in oil prices have led to reduced investments by oil & gas companies across regions, which could restrain market growth. A rise in the demand for multi-client surveys and advances in technology present promising growth opportunities for the market.
Some of the leading players in the seismic survey market include Compagnie Generale de Geophysique (CGG) (France), Petroleum Geo-Services (PGS) (Norway), Fugro N.V. (Netherlands), Polarcus Limited (U.A.E.), and Tomlinson Geophysical Services (TGS)-Norwegian Petroleum Exploration Consultants (NOPEC) Geophysical Company (Norway), among others. Contracts and agreements was the most common strategy adopted by the top players in the market, constituting approximately 50% of the total development share. This was followed by new product launches, mergers & acquisitions, and expansions, respectively.
To speak to our analyst for a discussion on the above findings, click Speak to Analyst
 Exclusive indicates content/data unique to MarketsandMarkets and not available with any competitors.
Table of Contents
1 Introduction (Page No. - 15)
1.1 Objectives of the Study
1.2 Market Definition
1.3 Markets Covered
1.4 Years Considered for the Study
1.5 Currency
1.6 Limitations
1.7 Stakeholders
2 Research Methodology (Page No. - 18)
2.1 Introduction
2.1.1 Secondary Data
2.1.1.1 Key Data From Secondary Sources
2.1.2 Primary Data
2.1.2.1 Key Data From Primary Sources
2.1.2.2 Key Industry Insights
2.1.2.3 Breakdown of Primaries
2.2 Market Size Estimation
2.2.1 Bottom-Up Approach
2.2.2 Top-Down Approach
2.3 Market Breakdown & Data Triangulation
2.4 Research Assumptions & Limitations
2.4.1 Assumptions
3 Executive Summary (Page No. - 26)
4 Premium Insights (Page No. - 29)
4.1 Seismic Survey Market, By Technology
4.2 Seismic Survey Market, By Service
4.3 Africa: the Largest Growing Market During the Forecast Period, By Region
5 Market Overview (Page No. - 32)
5.1 Introduction
5.2 Market Dynamics
5.2.1 Drivers
5.2.1.1 Growing Demand for Seismic Technology in Brownfield Projects
5.2.1.2 The Use of Seismic Technology in Shale Gas Exploration
5.2.2 Restraints
5.2.2.1 Low Oil Prices
5.2.3 Opportunities
5.2.3.1 Rise in Demand for Multiclient Surveys
5.2.4 Challenges
5.2.4.1 Regulation & Monitoring of Seismic Surveys
6 Seismic Survey Market, By Service (Page No. - 36)
6.1 Introduction
6.2 Data Acquisition
6.2.1 Land Acquisition
6.2.2 Marine Acquisition
6.2.3 Airborne Acquisition
6.3 Data Processing & Interpretation
6.3.1 Data Processing
6.3.2 Data Interpretation
7 Seismic Survey Market, By Technology (Page No. - 44)
7.1 Introduction
7.2 2D
7.3 3D
7.4 4D
8 Seismic Survey Market, By Region (Page No. - 49)
8.1 Introduction
8.2 North America
8.2.1 By Service
8.2.2 By Technology
8.2.3 By Country
8.2.3.1 U.S.
8.2.3.2 Canada
8.2.3.3 Mexico
8.3 Europe
8.3.1 By Service
8.3.2 By Technology
8.3.3 By Country
8.3.3.1 U.K.
8.3.3.2 Denmark
8.3.3.3 Netherlands
8.3.3.4 Russia
8.3.3.5 Norway
8.3.3.6 Rest of Europe
8.4 Asia-Pacific
8.4.1 By Service
8.4.2 By Technology
8.4.3 By Country
8.4.3.1 China
8.4.3.2 India
8.4.3.3 Australia
8.4.3.4 Indonesia
8.4.3.5 Malaysia
8.4.3.6 Rest of Asia-Pacific
8.5 Middle East
8.5.1 By Service
8.5.2 By Technology
8.5.3 By Country
8.5.3.1 Saudi Arabia
8.5.3.2 Kuwait
8.5.3.3 U.A.E.
8.5.3.4 Iran
8.5.3.5 Iraq
8.5.3.6 Rest of the Middle East
8.6 South America
8.6.1 By Service
8.6.2 By Technology
8.6.3 By Country
8.6.3.1 Brazil
8.6.3.2 Argentina
8.6.3.3 Venezuela
8.6.3.4 Rest of South America
8.7 Africa
8.7.1 By Service
8.7.2 By Technology
8.7.3 By Country
8.7.3.1 Egypt
8.7.3.2 Algeria
8.7.3.3 Angola
8.7.3.4 Nigeria
8.7.3.5 Rest of Africa
9 Competitive Landscape (Page No. - 84)
9.1 Overview
9.2 Seismic Survey Market: Competitors� Ranking, 2016
9.3 Competitive Situation & Trends
9.4 Vendor Dive Overview
9.4.1 Vanguards
9.4.2 Innovators
9.4.3 Dyanmic
9.4.4 Emerging
9.5 Analysis of the Service Offerings of Major Players in this Market (25 Companies)
9.6 Business Strategies Adopted By Major Players in the Seismic Survey Market (25 Companies)
10 Company Profiles (Page No. - 92)
10.1 Seabird Exploration, PLC
10.1.1 Overview
10.1.2 Service Offerings
10.1.3 Service Offering Scorecard
10.1.4 Business Strategy Scorecard
10.1.5 Recent Developments
10.2 Petroleum Geo-Services (PGS)
10.2.1 Overview
10.2.2 Service Offerings
10.2.3 Service Offering Scorecard
10.2.4 Business Strategy Scorecard
10.2.5 Recent Developments
10.3 Tomlinson Geophysical Services, Inc. (TGS)-Norwegian Petroleum Exploration Consultants (NOPEC) Geophysical Company
10.3.1 Overview
10.3.2 Service Offerings
10.3.3 Service Offering Scorecard
10.3.4 Business Strategy Scorecard
10.3.5 Recent Developments
10.4 Compagnie Generale De Geophysique, S.A.
10.4.1 Overview
10.4.2 Service Offerings
10.4.3 Service Offering Scorecard
10.4.4 Business Strategy Scorecard
10.4.5 Recent Developments
10.5 Agile Seismic, LLC
10.5.1 Overview
10.5.2 Service Offerings
10.5.3 Service Offering Scorecard
10.5.4 Business Strategy Scorecard
10.6 New Resolution Geophysics (NRG)
10.6.1 Overview
10.6.2 Service Offerings
10.6.3 Service Offering Scorecard
10.6.4 Business Strategy Scorecard
10.7 Ion Geophysical Corporation
10.7.1 Overview
10.7.2 Service Offerings
10.7.3 Service Offering Scorecard
10.7.4 Business Strategy Scorecard
10.7.5 Recent Developments
10.8 Geokinetics
10.8.1 Overview
10.8.2 Service Offerings
10.8.3 Service Offering Scorecard
10.8.4 Business Strategy Scorecard
10.8.5 Recent Developments
10.9 Schlumberger Limited-Westerngeco
10.9.1 Overview
10.9.2 Service Offerings
10.9.3 Service Offering Scorecard
10.9.4 Business Strategy Scorecard
10.9.5 Recent Developments
10.10 Pulse Seismic, Inc.
10.10.1 Overview
10.10.2 Service Offerings
10.10.3 Service Offering Scorecard
10.10.4 Business Strategy Scorecard
10.10.5 Recent Developments
10.11 Saexploration Holding, Inc.
10.11.1 Overview
10.11.2 Service Offerings
10.11.3 Service Offering Scorecard
10.11.4 Business Strategy Scorecard
10.11.5 Recent Developments
10.12 Dawson Geophysical Company
10.12.1 Overview
10.12.2 Service Offerings
10.12.3 Service Offering Scorecard
10.12.4 Business Strategy Scorecard
10.12.5 Recent Developments
10.13 Alpine Ocean Seismic Survey, Inc.
10.13.1 Overview
10.13.2 Service Offerings
10.13.3 Service Offering Scorecard
10.13.4 Business Strategy Scorecard
10.14 Geospace Technologies Corporation
10.14.1 Overview
10.14.2 Service Offerings
10.14.3 Service Offering Scorecard
10.14.4 Business Strategy Scorecard
10.14.5 Recent Developments
10.15 Global Geophysical Services, Inc.
10.15.1 Overview
10.15.2 Service Offerings
10.15.3 Service Offering Scorecard
10.15.4 Business Strategy Scorecard
10.16 Fugro N.V.
10.16.1 Overview
10.16.2 Product Offering Scorecard
10.16.3 Business Strategy Scorecard
10.16.4 Service Offerings
10.16.5 Recent Developments
10.17 BGP Inc., China National Petroleum Corporation
10.17.1 Overview
10.17.2 Service Offerings
10.17.3 Product Offering Scorecard
10.17.4 Business Strategy Scorecard
10.17.5 Recent Developments
11 Appendix (Page No. - 150)
11.1 Insights of Industry Experts
11.2 Discussion Guide
11.3 Knowledge Store: Marketsandmarkets� Subscription Portal
11.4 Available Customizations
11.5 Introducing RT: Real-Time Market Intelligence
11.6 Available Customizations
11.7 Related Reports
11.8 Author Details
List of Tables (62 Tables)
Table 1 Global Seismic Survey Market Snapshot
Table 2 Seismic Survey Market Size, By Service, 2015�2022 (USD Million)
Table 3 Data Acquisition: Market Size, By Service, 2015�2022 (USD Million)
Table 4 Land Acquisition: Market Size, By Region, 2015�2022 (USD Million)
Table 5 Marine Acquisition: Market Size, By Region, 2015�2022 (USD Million)
Table 6 Airborne Acquisition: Market Size, By Region, 2015�2022 (USD Million)
Table 7 Data Processing & Interpretation:Market Size, By Service, 2015�2022 (USD Million)
Table 8 Data Processing: Market Size, By Region, 2015�2022 (USD Million)
Table 9 Data Interpretation: Market Size, By Region, 2015�2022 (USD Million)
Table 10 Seismic Survey Market Size,By Technology, 2015�2022 (USD Million)
Table 11 2D: Market Size, By Region, 2015�2022 (USD Million)
Table 12 3D: Market Size, By Region, 2015�2022 (USD Million)
Table 13 4D: Market Size, By Region, 2015�2022 (USD Million)
Table 14 Global Seismic Survey Market Size, By Region, 2015�2022 (USD Million)
Table 15 North America: Seismic Survey Market Size, By Service, 2015�2022 (USD Million)
Table 16 North America: Market Size, By Technology, 2015�2022 (USD Million)
Table 17 North America: Market Size, By Country, 2015�2022 (USD Million)
Table 18 U.S.: Market Size, By Service, 2015�2022 (USD Million)
Table 19 Canada: Market Size, By Service, 2015�2022 (USD Million)
Table 20 Mexico: Market Size, By Service, 2015�2022 (USD Million)
Table 21 Europe: Seismic Survey Market Size, By Service, 2015�2022 (USD Million)
Table 22 Europe: Market Size, By Technology, 2015�2022 (USD Million)
Table 23 Europe: Market Size, By Country, 2015�2022 (USD Million)
Table 24 U.K.: Market Size, By Service, 2015�2022 (USD Million)
Table 25 Denmark: Market Size, By Service, 2015�2022 (USD Million)
Table 26 Netherlands: Market Size, By Service, 2015�2022 (USD Million)
Table 27 Russia: Market Size, By Service, 2015�2022 (USD Million)
Table 28 Norway: Market Size, By Service, 2015�2022 (USD Million)
Table 29 Rest of Europe: Market Size, By Service, 2015�2022 (USD Million)
Table 30 Asia-Pacific: Seismic Survey Market Size, By Service, 2015�2022 (USD Million)
Table 31 Asia-Pacific: Market Size, By Technology, 2015�2022 (USD Million)
Table 32 Asia-Pacific: Market Size, By Country, 2015�2022 (USD Million)
Table 33 China: Market Size, By Service, 2015�2022 (USD Million)
Table 34 India: Market Size, By Service, 2015�2022 (USD Million)
Table 35 Australia: Market Size, By Service, 2015�2022 (USD Million)
Table 36 Indonesia: Market Size, By Service, 2015�2022 (USD Million)
Table 37 Malaysia: Market Size, By Service, 2015�2022 (USD Million)
Table 38 Rest of Asia-Pacific: Market Size, By Service, 2015�2022 (USD Million)
Table 39 Middle East: Seismic Survey Market Size, By Service, 2015�2022 (USD Million)
Table 40 Middle East: Seismic Survey Size, By Technology, 2015�2022 (USD Million)
Table 41 Middle East: Market Size, By Country, 2015�2022 (USD Million)
Table 42 Saudi Arabia: Market Size, By Service, 2015�2022 (USD Million)
Table 43 Kuwait: Market Size, By Service, 2015�2022 (USD Million)
Table 44 U.A.E.: Market Size, By Service, 2015�2022 (USD Million)
Table 45 Iran: Market Size, By Service, 2015�2022 (USD Million)
Table 46 Iraq: Market Size, By Service, 2015�2022 (USD Million)
Table 47 Rest of the Middle East: Market Size, By Service, 2015�2022 (USD Million)
Table 48 South America: Seismic Survey Market Size, By Service, 2015�2022 (USD Million)
Table 49 South America: Market Size, By Technology, 2015�2022 (USD Million)
Table 50 South America: Market Size, By Country, 2015�2022 (USD Million)
Table 51 Brazil: Market Size, By Service, 2015�2022 (USD Million)
Table 52 Argentina: Market Size, By Service, 2015�2022
Table 53 Venezuela: Market Size, By Service, 2015�2022 (USD Million)
Table 54 Rest of South America: Market Size, By Service, 2015�2022 (USD Million)
Table 55 Africa: Seismic Survey Market Size, By Service, 2015�2022 (USD Million)
Table 56 Africa: Market Size, By Technology, 2015�2022 (USD Million)
Table 57 Africa: Market Size, By Country, 2015�2022 (USD Million)
Table 58 Egypt: Market Size, By Service, 2015�2022 (USD Million)
Table 59 Algeria: Market Size, By Service, 2015�2022 (USD Million)
Table 60 Angola: Market Size, By Service, 2015�2022 (USD Million)
Table 61 Nigeria: Market Size, By Service, 2015�2022 (USD Million)
Table 62 Rest of Africa: Market Size, By Service, 2015�2022 (USD Million)
List of Figures (36 figures)
Figure 1 Markets Covered: Seismic Survey
Figure 2 Seismic Survey Market: Research Design
Figure 3 Break Down of Primary Interviews: By Company Type, Designation, & Region
Figure 4 Market Size Estimation Methodology: Bottom-Up Approach
Figure 5 Market Size Estimation Methodology: Top-Down Approach
Figure 6 Market Estimation Approach & Data Triangulation Methodology
Figure 7 Data Processing and Interpretation Segment is Expected to Register the Highest Growth in the Seismic Survey Market
Figure 8 2D Imaging Technology Segment is Expected to Lead the Seismic Survey Market, 2017�2022
Figure 9 Attractive Opportunities in Seismic Survey Market
Figure 10 Market Share (Value), By Type, 2017�2022
Figure 11 Data Acquisition is Estimated to Dominate the Seismic Survey Market By 2022
Figure 12 Seismic Survey Market for Africa is Expected to Grow at the Fastest Pace During the Forecast Period
Figure 13 North America to Dominate the Seismic Survey Market Between 2017 & 2022
Figure 14 Market Dynamics for Seismic Survey Market
Figure 15 Data Acquisition Segment is Expected to Dominate the Seismic Survey Market During the Forecast Period
Figure 16 Land Acquisition Segment is Expected to Dominate the Data Acquisition Market Oil During the Forecast Period
Figure 17 Regional Snapshot: Rapid Growth in Developing Markets
Figure 18 Seismic Survey Market Snapshot: North America
Figure 19 Europe is Expected to Drive the Seismic Survey Market, By Region, 2017�2022 (USD Million)
Figure 20 Companies Adopted New Services Offerings, Contracts & Agreements, Mergers & Acquisitions, & Awards & Recognitions to Capture A Share of the Market
Figure 21 Battle for Market Share: Contracts & Agreements Was the Key Strategy, 2014�2017
Figure 22 Market Evaluation Framework: Contracts & Agreements Fueled the Growth of Companies From 2013 to February 2017
Figure 23 Vendor Dive Matrix
Figure 24 Service Strategy Comparison
Figure 25 Business Strategy Comparison
Figure 26 Seabird Exploration, PLC: Company Snapshot (2016)
Figure 27 Petroleum Geo-Services: Company Snapshot (2016)
Figure 28 Tomlinson Geophysical Services Inc (TGS)-Norwegian Petroleum Exploration Consultants (NOPEC) Geophysical Company: Company Snapshot (2016)
Figure 29 Compagnie Generale De Geophysique, S.A.: Company Snapshot (2016)
Figure 30 Ion Geophysical Corporation: Company Snapshot (2016)
Figure 31 Schlumberger-Westerngeco: Company Snapshot (2016)
Figure 32 Pulse Seismic, Inc.: Company Snapshot (2016)
Figure 33 Saexploration Holding, Inc.: Company Snapshot (2016)
Figure 34 Dawson Geophysical Company: Company Snapshot (2016)
Figure 35 Geospace Technologies Corporation: Company Snapshot (2016)
Figure 36 Fugro N.V.: Company Snapshot (2016)


Growth opportunities and latent adjacency in Seismic Survey Market
I am looking for a seismic acquisition company to work in Libya