Security Labels Market by Type (Branding, Identification, Information), Identification method (Bar code, Radio Frequency Identification, Holographic) Composition (Facestock, Release Liner, Adhesive), Form (Reel, Sheet) & Application - Forecast to 2020


[223 Pages Report] The Security Labels Market was valued at USD 20.61 Billion in 2015 and is projected to reach USD 26.47 Billion by 2020, at a CAGR of 5.13% from 2015 to 2020. On the basis of compositon, facestock accounted for the largest market share among all compositions for security labels. Bar codes accounted for the largest share in terms of both volume and value. In 2014, the application segment was dominated by the food & beverage sector followed by retail and consumer durables. Security labels in the form of sheets accounted for the largest share in terms of both volume and value. The final segment, that is, the region, consists of North America, Europe, Asia-Pacific, and the Rest of the World (RoW). Globally, competition in the market is growing considerably owing to the improvement in labeling technologies such as bar codes and radio-frequency identification. Security labels convertors are keen on developing innovative labeling solutions that can withstand severe weather conditions such as extreme temperature and abrasion. The base year considered for the sudy is 2014 and the market size is forecasted from 2015 to 2020.
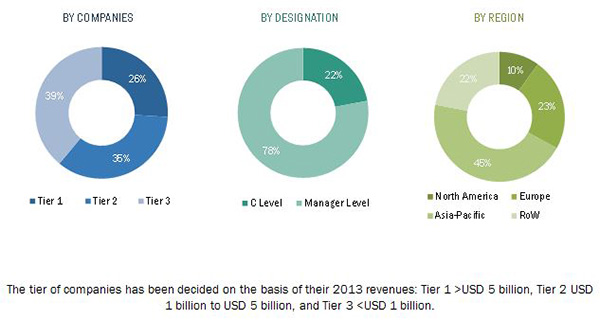
The research methodology used to estimate and forecast the market size included the top-down and bottom-up approach. The total market size of the security labels was calculated, and accordingly, the percentage was allotted to different sectors in each of the segments. The allotment and calculation were done on the basis of extensive primary interviews and secondary research. Primary research involved in this report includes extensive interviews with key people such as CEOs, VPs, directors, and executives. After arriving at the overall market size, the total market was split into several segments and subsegments. These data triangulation and market breakdown procedures were employed to complete the overall market engineering process and arrive at the exact statistics for all segments and subsegments. The breakdown of profiles of primary respondents is depicted in the figure below.
To know about the assumptions considered for the study, download the pdf brochure
The security labels ecosystem comprises companies such as 3M Company (U.S.), Avery Dennison Corporation (U.S.), CCL Industries Inc. (Canada), UPM (Finland), and Honeywell International Inc. (U.S.). The other players in the market are Tesa SE Group (Germany), Seiko Holdings Corporation (Japan), Group Dc (Canada), Label Lock (U.K.), and Polylabel.com (Canada). These provide solutions to end users to cater to their unique business requirements and needs.
This report estimates the size of the security labels market in terms of volume (million square meter) and value (USD million). In this report, the market has been segmented broadly on the basis of type, form, identification method, composition, application, and region. The market drivers, restraints, opportunities, and challenges, and product price trends have been discussed in detail. The share of participants in the overall market has also been discussed, in detail.
Target audience
- market manufacturers
- market importers and exporters
- market traders, distributors, and suppliers
- Government and research organizations
- Associations and industry bodies
- Regulatory bodies
- End users
Scope of the Report
This research report categorizes the market based on type, form, identification method, composition, application, and region.
Based on type, the market has been segmented as follows:
- Branding
- Identification
- Informative
Based on form, the market has been segmented as follows:
- Reels
- Sheets
Based on identification method, the market has been segmented as follows:
- Bar codes
- Radio-frequency identification
- Holographic
Based on composition, the market has been segmented as follows:
- Facestock
- Adhesive
- Release liner
Based on application, the market has been segmented as follows:
- Food & beverage
- Retail
- Consumer durables
- Pharmaceuticals
- Others (automotive, aerospace, construction, logistic, manufacturing, data centers and government organization)
Based on region, the market has been segmented as follows:
- North America
- Europe
- Asia-Pacific
- RoW (Brazil, U.A.E., South Africa, and others)
Available Customizations
With the given market data, MarketsandMarkets offers customizations as per the client-specific needs. The following customization options are available for the report:
Product Analysis
- Product matrix which gives a detailed comparison of the product portfolio of each company
Geographic Analysis
- Further analysis of security labels market for additional countries
Company Information
- Detailed analysis and profiling of additional market players (up to 5).
MarketsandMarkets projects that the security labels market size by value will grow and reach USD 26.47 Billion by 2020 at a CAGR of 5.13% between 2015 and 2020. The market is growing in accordance with the growth trends of the converting and labeling industries. Factors such as increasing demand from food and beverage industry, demand for retail supplies, consumer durables, and logistics application, increasing consumer awareness, and growth of the e-commerce industry have propelled the growth of the global market. Security labels are used for anticounterfeiting, brand protection, transmitting information, and providing waring, among other functions. Product innovations and technological developments in the market are expected to create strong investment opportunities.
The market is segmented on the basis of type, form, identification method, composition, application, and region. On the basis of composition, facestock held the largest market share, in terms of both volume and value. Bar codes was the most widely used identification method among other technologies, in terms of both volume and value. On the basis of form, sheets held the largest market share, in terms of both volume and value.
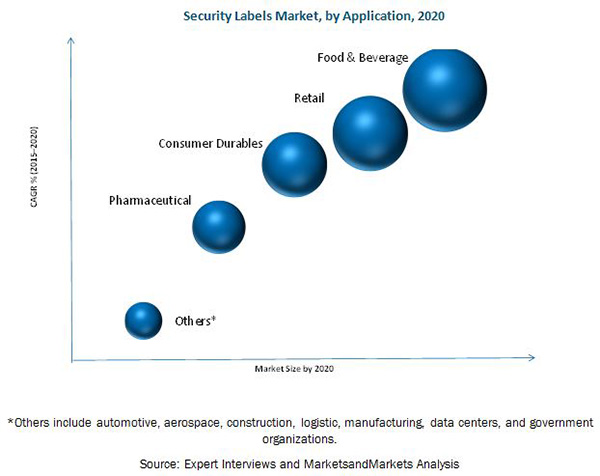
On the basis of application, the market is segmented into food & beverage, retail, consumer durables, pharmaceuticals, and others. Increasing disposable incomes of people in developing countries and changing preferences of manufacturers for cost-efficient and effective labeling are some of the factors that are driving the market.
On the basis of key regions, the market for security labels is segmented into North America, Europe, Asia-Pacific, and the Rest of the World (RoW). The European region held the largest share among all the regions in 2014. This is mainly due to emerging economies in Germany and U.K., coupled with growing applications of security labels in the food & beverage and consumer durables industry. Asia-Pacific is projected to be the fastest-growing market during the forecast period, due to the growing demand for security labels products and increasing awareness among end users. In terms of type, branding is projected to be the largest market for security labels.
Certain factors such as the high capital investment, lack of standards & regulations, rising environmental concerns, and rising raw material cost hinder the growth of this industry The rising raw material cost is one of the strongest restraints for the security labels market. High raw material costs are at the forefront of the agenda of both end-user packaging buyers and their label-converter suppliers. Raw materials such as film materials, resins, inks, paper & wood pulp, hydrocarbon resins, carbon black, adhesives, and solvents are largely driven by rise in prices. The rise in raw material cost has added to limiting the growth of the market.
The new product developmets and aqusitions were the major strategies adopted by most players in this market. Companies such as 3M Company (U.S.), Avery Dennison Corporation (U.S.), CCL Industries Inc. (Canada), UPM (Finland), Honeywell International Inc. (U.S.), Tesa SE Group (Germany), and Seiko Holdings Corporation (Japan) were the key players who adopted these strategies to increase the customer base in key markets. The leading security labels manufacturers are focusing on emerging countries that are estimated to show potential for industrial development in the near future.
To speak to our analyst for a discussion on the above findings, click Speak to Analyst
 Exclusive indicates content/data unique to MarketsandMarkets and not available with any competitors.
Table of Contents
1 Introduction (Page No. - 20)
1.1 Objectives of The Study
1.2 Market Definition
1.3 Study Scope
1.3.1 Periodization Considered for the Study
1.4 Currency Considered
1.5 Unit Considered for the Market
1.6 Stakeholders
2 Research Methodology (Page No. - 23)
2.1 Introduction
2.1.1 Secondary Data
2.1.2 Primary Data
2.1.2.1 Key Data From Primary Sources
2.1.2.2 Breakdown of Primary Interviews
2.2 Market Size Estimation
2.3 Market Breakdown & Data Triangulation
2.4 Market Share Estimation
2.5 Research Assumptions & Limitations
2.5.1 Assumptions of the Research Study
2.5.2 Limitations of the Research Study
3 Executive Summary (Page No. - 33)
3.1 Driving Factors
3.2 Market for Sheets to Grow at A Higher CAGR
3.2.1 China to Be the Fastest-Growing Market for Security Labels, 2015�2020
4 Premium Insights (Page No. - 37)
4.1 Attractive Market Opportunities in the Security Labels Market
4.2 Market in the Asia-Pacific Region
4.3 Country-Wise Growth Rates From 2015 to 2020
4.4 Region-Wise Market Share in 2015
4.5 Emerging vs Developed Markets for Security Labels, 2015 vs 2020
5 Market Overview (Page No. - 42)
5.1 Introduction
5.2 Evolution
5.3 Market Segmentation
5.3.1 Security Labels, By Type
5.3.2 Security Labels, By Identification Method
5.3.3 Security Labels, By Composition
5.3.4 Security Labels, By Form
5.3.5 Security Labels, By Application
5.4 Market Dynamics
5.4.1 Drivers
5.4.1.1 Demand-Side Drivers
5.4.1.1.1 Increasing Production and Consumption of Consumer Durable Goods
5.4.1.1.2 Rapid Growth in E-Commerce Industry
5.4.1.1.3 Rapid Growth in Manufacturing Sector
5.4.1.1.4 Growth in Pharmaceutical Industry
5.4.2 Restraints
5.4.2.1 Demand-Side Restraints
5.4.2.1.1 Lack of Related Standards
5.4.2.2 Supply-Side Restraints
5.4.2.2.1 Increase in Raw-Material Prices
5.4.3 Opportunities
5.4.3.1 Effective and Efficient Value Chain Management
5.4.3.2 Increase in Demand for Remote Authentication of Products
5.4.3.3 Growing Opportunity in Automobile Sector
5.4.4 Challenges
5.4.4.1 Huge Investment in Research & Development
5.4.4.2 Limited Access to Rf Signals By Metallic and Liquid Objects
5.4.4.3 Rising Environmental Concerns
5.5 Regulatory Landscape
6 Industry Trends (Page No. - 59)
6.1 Introduction
6.2 Value Chain
6.3 Porter�s Five Forces Analysis
6.3.1 Threat of New Entrants
6.3.2 Threat of Substitutes
6.3.3 Bargaining Power of Suppliers
6.3.4 Bargaining Power of Buyers
6.3.5 Intensity of Competitive Rivalry
7 Security Labels Market, By Type (Page No. - 66)
7.1 Introduction
7.1.1 Market, By Type
7.1.1.1 Branding Segment Dominated the Market in 2014
7.2 Branding Labels
7.2.1 Branding By Identification Method
7.2.1.1 Bar Codes Segment is Estimated to Be the Fastest-Growing Market Due to Its Increasing Application for Product Tracking
7.2.2 Branding Market, By Form
7.2.2.1 Sheet Segment to Grow at the Highest Rate By 2020
7.2.3 Branding Market, By Composition
7.2.3.1 Facestock Segment Accounted for the Largest Market Share in 2014
7.3 Identification
7.3.1 Identification Market, By Identification Method
7.3.1.1 Bar Codes is A High-Potential Segment for the Identification Labels Market
7.3.2 Identification Market, By Form
7.3.2.1 Sheets Segment Dominated the Market in 2014
7.3.3 Identification Market, By Composition
7.3.3.1 Facestock Was the Most Widely Used Composition in 2014
7.4 Informative
7.4.1 Informative Market, By Identification Method
7.4.1.1 The Increasing Demand for Bar Codes is Expected to Drive the Market of Labelling Industry
7.4.2 Informative Market, By Form
7.4.2.1 Sheets Segment to Grow at the Highest Rate By 2020
7.4.3 Informative Market, By Composition
7.4.3.1 Facestock Segment Accounted for the Largest Market Share in 2014
7.5 Others
7.5.1 Others Market, By Identification Method
7.5.1.1 Bar Codes is Projected to Be the Fastest-Growing Segment During the Forecast Period
7.5.2 Others Market, By Form
7.5.2.1 Sheets is A High-Potential Form for the Security Labels Market
7.5.3 Others Market, By Composition
7.5.3.1 Facestock Estimated to Be the Fastest-Growing Market By Composition
8 Security Labels Market, By Identification Method (Page No. - 79)
8.1 Introduction
8.1.1 Market, By Identification Method
8.1.1.1 Bar Codes Dominated the Market in 2014
8.2 Bar Codes
8.3 Radio Frequency Identification
8.4 Holographic
8.5 Others
9 Security Labels Market, By Composition (Page No. - 84)
9.1 Introduction
9.2 Facestock
9.2.1 By Composition
9.2.1.1 Paper is A High-Potential Segment for the Market
9.3 Release Liner
9.3.1 By Composition
9.3.1.1 Synthetic Estimated to Be the Fastest-Growing Market
9.4 Adhesive
10 Security Labels Market, By Form (Page No. - 89)
10.1 Introduction
10.1.1 Market, By Form
10.1.1.1 Security Labels in the Form of Sheets Account for A Larger Market Share in 2014
10.2 Sheets
10.2.1 Sheets Market, By Application
10.2.1.1 Rising Demand From Food & Beverage Packaging and Labelling Industry is Driving the Market for Sheets
11 Security Labels Market, By Application (Page No. - 94)
11.1 Introduction
11.1.1 Market, By Application
11.1.1.1 Food & Beverage is Projected to Be the Fastest-Growing Industry During the Forecast Period
11.2 Food & Beverages
11.2.1 Food & Beverages Market, By Type
11.2.2 Food & Beverages Market, By Identification Method
11.3 Retail
11.3.1 Retail Market, By Type
11.3.2 Retail Market, By Identification Method
11.4 Pharmaceuticals
11.4.1 Pharmaceuticals Market, By Type
11.4.2 Pharmaceuticals Market, By Identification Method
11.5 Consumer Durables
11.5.1 Consumer Durables Market, By Type
11.5.2 Consumer Durables Market, By Identification Method
11.6 Others
11.6.1 Others Market, By Type
11.6.2 Others Market, By Identification Method
12 Security Labels Market, By Region (Page No. - 108)
12.1 Introduction
12.1.1 Market Size, By Region
12.1.1.1 Europe Dominated the Market for Security Labels in 2014
12.2 North America
12.2.1 North America: Market Size, By Country
12.2.1.1 U.S. Accounted for Largest Share in North America�s Market
12.2.2 North America: Size, By Type
12.2.2.1 Branding Segment Projected to Grow the Fastest in North America By 2020
12.2.3 North America: Size, By Identification Method
12.2.3.1 Bar Codes Segment to Dominate the Market By 2020
12.2.4 North America: Size, By Form
12.2.4.1 Sheets Segment to Grow at the Highest Rate By 2020
12.2.5 North America: Size, By Composition
12.2.5.1 Facestock Accounted for the Largest Share in North American Security Labels Market in 2014
12.2.6 North America: Size, By Application
12.2.6.1 Food & Beverages is the Fastest-Growing Followed By the Consumer Durables Segment
12.2.7 U.S.
12.2.8 U.S.: Market Size, By Type
12.2.8.1 Identification to Grow at the Second-Highest Rate in the U.S. Market
12.2.9 U.S.: Size, By Identification Method
12.2.9.1 Bar Codes Segment Dominated the U.S. Market in 2014
12.2.10 U.S.: Size, By Application
12.2.10.1 Food & Beverages is Estimated to Be the Fastest-Growing Segment in the U.S. Market
12.2.11 Canada
12.2.12 Canada: Market Size, By Type
12.2.12.1 Branding Segment to Grow at the Highest Rate By 2020
12.2.13 Canada: Market Size, By Type, 2013�2020 (USD Million)
12.2.14 Canada: Market Size, By Identification Method
12.2.14.1 Bar Codes Segment Dominated the Canadian Security Labels Market in 2014
12.2.15 Canada: Market Size, By Application
12.2.15.1 Food & Beverages Segment Dominated the Application Market in Canada
12.2.16 Mexico
12.2.17 Mexico: Market Size, By Type
12.2.17.1 Branding Segment to Grow at the Highest Rate By 2020
12.2.18 Mexico: Market Size, By Identification Method
12.2.18.1 Bar Codes Was the Most Widely Used Identification Method in 2014
12.2.19 Mexico: Market Size, By Application
12.2.19.1 Retail Segment to Grow at the Second-Highest Rate By 2020
12.3 Europe
12.3.1 Europe: Market Size, By Country
12.3.1.1 Germany Accounted for the Largest Share in the European Market
12.3.2 Europe: Market Size, By Type
12.3.2.1 Branding Segment to Grow at the Highest CAGR Through 2020
12.3.3 Europe: Market Size, By Identification Method
12.3.3.1 Bar Codes Segment Accounted for the Largest Market Share in 2014
12.3.4 Europe: Market Size, By Form
12.3.4.1 Sheets Segment Dominated the Form Market in Europe
12.3.5 Europe: Market Size, By Composition
12.3.5.1 Facestock Segment Accounted for the Largest Market Share in 2014
12.3.6 Europe: Market Size, By Application
12.3.6.1 Retail to Grow at the Second-Highest Rate in the European Market
12.3.7 Germany
12.3.8 Germany: Security Labels Market Size, By Type
12.3.8.1 Branding Segment to Grow at the Highest CAGR Through 2020
12.3.9 Germany: Market Size, By Identification Method
12.3.9.1 Bar Codes Was the Most Widely Used Identification Method in 2014
12.3.10 Germany: Market Size, By Application
12.3.10.1 Food & Beverages Segment Accounted for the Largest Market Share in 2014
12.3.11 France
12.3.12 France: Market Size, By Type
12.3.12.1 Identification Segment to Grow at the Second-Highest Rate By 2020
12.3.13 France: Market Size, By Identification Method
12.3.13.1 Branding Segment to Grow at the Highest CAGR Through 2020
12.3.14 France: Market Size, By Application
12.3.14.1 Food & Beverages Segment Dominated the Market in France
12.3.15 U.K.
12.3.16 U.K.: Market Size, By Type
12.3.16.1 Branding Segment to Grow at the Highest CAGR Through 2020
12.3.17 U.K.: Market Size, By Identification Method
12.3.17.1 Bar Codes Segment Accounted for the Largest Market Share in 2014
12.3.18 U.K.: Market Size, By Application
12.3.18.1 Food & Beverages to Grow at the Highest Rate By 2020
12.3.19 Spain
12.3.20 Spain: Market Size, By Type
12.3.20.1 Branding Segment Dominated the Spanish Market in 2014
12.3.21 Spain: Market Size, By Identification Method
12.3.21.1 Radio-Frequency Identification Segment to Grow at the Second-Highest Rate By 2020
12.3.22 Spain: Market Size, By Application
12.3.22.1 Food & Beverages Segment to Grow at the Highest CAGR Through 2020
12.3.23 Rest of Europe
12.3.24 Rest of Europe: Security Labels Market Size, By Type
12.3.24.1 Branding Segment Accounted for the Largest Market Share in 2014
12.3.25 Rest of Europe: Market Size, By Identification Method
12.3.25.1 Bar Codes Was the Most Widely Used Identification Method in 2014
12.3.26 Rest of Europe: Market Size, By Application
12.3.26.1 Food & Beverages Segment Dominated the Market in Rest of Europe
12.4 Asia-Pacific
12.4.1 Asia-Pacific: Market Size, By Country
12.4.1.1 China Dominated the Asia-Pacific Market in 2014
12.4.2 Asia-Pacific: Market Size, By Type
12.4.2.1 Branding Segment to Grow at the Highest CAGR Through 2020
12.4.3 Asia-Pacific: Market Size, By Identification Method
12.4.3.1 Bar Codes Was the Most Widely Used Identification Method in 2014
12.4.4 Asia-Pacific: Market Size, By Form
12.4.4.1 Sheets Segment to Grow at the Highest Rate By 2020
12.4.5 Asia-Pacific: Market Size, By Composition
12.4.5.1 Facestock Segment Accounted for the Largest Market Share in 2014
12.4.6 Asia-Pacific: Market Size, By Application
12.4.6.1 Food & Beverages Segment Dominated the Security Labels Market in Asia-Pacific
12.4.7 China
12.4.8 China: Security Labels Market Size, By Type
12.4.8.1 Branding Segment to Grow at the Highest Rate By 2020
12.4.9 China: Market Size, By Identification Method
12.4.9.1 Radio-Frequency Identification Segment to Grow at the Second-Highest Rate in 2014
12.4.10 China: Market Size, By Application
12.4.10.1 Food & Beverages Segment Dominated, By Application, in 2014
12.4.11 India
12.4.12 India: Market Size, By Type
12.4.12.1 Branding Segment to Grow at the Highest CAGR Through 2020
12.4.13 India: Market Size, By Identification Method
12.4.13.1 Radio-Frequency Identification to Grow at the Second-Highest Rate in the Indian Market
12.4.14 India: Security Labels Market Size, By Application
12.4.14.1 Food & Beverages Segment Dominated the Security Labels Market in 2014
12.4.15 Japan
12.4.16 Japan: Market Size, By Type
12.4.16.1 Branding Segment to Grow at the Highest Rate By 2020
12.4.17 Japan: Market Size, By Identification Method
12.4.17.1 Bar Codes Was the Most Widely Used Identification Method in 2014
12.4.18 Japan: Market Size, By Application
12.4.18.1 Retail Segment to Grow at the Second-Highest Rate By 2020
12.4.19 South Korea
12.4.20 South Korea: Market Size, By Type
12.4.20.1 Branding Segment to Grow at the Highest CAGR Through 2020
12.4.21 South Korea: Market Size, By Identification Method
12.4.21.1 Radio-Frequency Identification to Grow at the Second-Highest Rate in 2014
12.4.22 South Korea: Market Size, By Application
12.4.22.1 Retail Segment to Grow at the Second-Highest Rate By 2020
12.4.23 Australia
12.4.24 Australia: Market Size, By Type
12.4.24.1 Branding Segment to Grow at the Highest CAGR Through 2020
12.4.25 Australia: Market Size, By Identification Method
12.4.25.1 Bar Codes Was the Most Widely Used Identification Method in 2014
12.4.26 Australia: Market Size, By Application
12.4.26.1 Food & Beverages Segment to Grow at the Highest Rate By 2020
12.4.27 Indonesia
12.4.28 Indonesia: Market Size, By Type
12.4.28.1 Branding Segment Accounted for the Largest Market Share in 2014
12.4.29 Indonesia: Market Size, By Identification Method
12.4.29.1 Radio-Frequency Identification Segment to Grow at the Second-Highest Rate By 2020
12.4.30 Indonesia: Market Size, By Application
12.4.30.1 Food & Beverages Segment Dominated the Security Labels Market in 2014
12.4.31 Rest of Asia-Pacific
12.4.32 Rest of Asia-Pacific: Market Size, By Type
12.4.32.1 Branding Segment to Grow at the Highest CAGR Through 2020
12.4.33 Rest of Asia-Pacific: Market Size, By Identification Method
12.4.33.1 Bar Codes Was the Most Widely Used Identification Method in 2014
12.4.34 Rest of Asia-Pacific: Market Size, By Application
12.4.34.1 Food & Beverages Segment Dominated the Security Labels Market in Rest of Asia-Pacific
12.5 Rest of the World (RoW)
12.5.1 RoW: Market Size, By Country
12.5.1.1 Brazil Dominated the RoW Market in 2014
12.5.2 RoW: Market Size, By Type
12.5.2.1 Branding Segment to Grow at the Highest CAGR Through 2020
12.5.3 RoW: Security Labels Market Size, By Identification Method
12.5.3.1 Radio-Frequency Identification to Grow at the Second-Highest Rate in the RoW Market
12.5.4 RoW: Market Size, By Form
12.5.4.1 Sheets Segment to Grow at the Highest Rate By 2020
12.5.5 RoW: Market Size, By Composition
12.5.5.1 Facestock Segment Accounted for the Largest Market Share in 2014
12.5.6 RoW: Market Size, By Application
12.5.6.1 Food & Beverages Segment Dominated the End Use Market in RoW
12.5.7 Brazil
12.5.8 Brazil: Security Labels Market Size, By Type
12.5.8.1 Branding Segment to Grow at the Highest CAGR Through 2020
12.5.9 Brazil: Market Size, By Identification Method
12.5.9.1 Bar Codes Was the Most Widely Used Identification Method in 2014
12.5.10 Brazil : Market Size, By Application
12.5.10.1 Retail Segment to Grow at the Second-Highest Rate By 2020
12.5.11 UAE
12.5.12 UAE: Market Size, By Type
12.5.12.1 Identification Segment to Grow at the Second-Highest Rate in the UAE Market
12.5.13 UAE: Market Size, By Identification Method
12.5.13.1 Bar Codes Segment Accounted for the Largest Share in 2014
12.5.14 UAE: Security Labels Market Size, By Application
12.5.14.1 Food & Beverages Segment Dominated the Application Market in 2014
12.5.15 South Africa
12.5.16 South Africa: Market Size, By Type
12.5.16.1 Branding is the Dominating Segment in 2014
12.5.17 South Africa: Market Size, By Identification Method
12.5.17.1 Radio-Frequency Identification Segment to Grow at the Second-Highest Rate By 2020
12.5.18 South Africa: Market Size, By Application
12.5.18.1 Retail Segment to Grow at the Second-Highest Rate By 2020
12.5.19 Others in RoW
12.5.20 Others in RoW: Security Labels Market Size, By Type
12.5.20.1 Branding Segment Accounted for the Largest Market Share in 2014
12.5.21 Others in RoW: Market Size, By Identification Method
12.5.21.1 Bar Codes Segment to Grow at the Highest Rate By 2020
12.5.22 Others in RoW: Market Size, By Application
12.5.22.1 Food & Beverages Segment Accounted for the Largest Market Share in 2014
13 Competitive Landscape (Page No. - 197)
13.1 Overview
13.2 Development Analysis
13.3 Competitive Situations & Trends
13.4 Key Growth Strategies, 2010�2016
13.5 New Product/Service Launches
13.6 Acquisitions
13.7 Expansions
13.8 Joint Ventures
14 Company Profiles (Page No. - 204)
14.1 Introduction
14.2 3M
14.2.1 Business Overview
14.2.2 Products Offered
14.2.3 Recent Developments
14.2.4 MnM View
14.2.4.1 SWOT Analysis
14.3 Honeywell International Inc.
14.3.1 Business Overview
14.3.2 Products Offered
14.3.3 Recent Developments
14.3.4 MnM View
14.3.4.1 SWOT Analysis
14.4 UPM
14.4.1 Business Overview
14.4.2 Products Offered
14.4.3 Recent Developments
14.4.4 MnM View
14.4.4.1 SWOT Analysis
14.5 Avery Dennison Corporation
14.5.1 Business Overview
14.5.2 Products Offered
14.5.3 Recent Developments
14.5.4 MnM View
14.5.4.1 SWOT Analysis
14.6 CCL Industries, Inc
14.6.1 Business Overview
14.6.2 Products Offered
14.6.3 Recent Developments
14.6.4 MnM View
14.6.4.1 SWOT Analysis
14.7 Tesa SE Group
14.7.1 Business Overview
14.7.2 Products Offered
14.7.3 Recent Developments
14.8 Seiko Holdings Corporation
14.8.1 Business Overview
14.8.2 Products Offered
14.8.3 Recent Developments
14.9 Label Lock
14.9.1 Business Overview
14.9.2 Products Offered
14.9.3 Recent Developments
14.10 Groupdc
14.10.1 Business Overview
14.10.2 Products Offered
14.10.3 Recent Developments
14.11 Polylabel.Com
14.11.1 Business Overview
14.11.2 Products Offered
14.11.3 Recent Developments
15 Appendix (Page No. - 232)
15.1 Insights of Industry Experts
15.2 Discussion Guide
15.3 Introducing RT: Real Time Market Intelligence
15.4 Available Customizations
15.5 Related Reports
List of Tables (223 Tables)
Table 1 Types & Descriptions
Table 2 Identification Methods & Descriptions
Table 3 Compositions & Descriptions
Table 4 Forms & Descriptions
Table 5 Applications & Descriptions
Table 6 R&D Investment By Company
Table 7 List of Standards
Table 8 Security Labels Market Size, By Type, 2013�2020 (USD Million)
Table 9 Market Size, By Type, 2013�2020 (Million Square Meters)
Table 10 Branding Market Size, By Identification Method, 2013�2020 (USD Million)
Table 11 Market Size, By Identification Method, 2013�2020 (Million Square Meters)
Table 12 Branding Market Size, By Form, 2013�2020 (USD Million)
Table 13 Branding Market Size, By Form, 2013�2020 (Million Square Meters)
Table 14 Branding Market Size, By Composition, 2013�2020 (USD Million)
Table 15 Identification Market Size, By Identification Method, 2013�2020 (USD Million)
Table 16 Identification Market Size, By Identification Method, 2013�2020 (Million Square Meters)
Table 17 Identification Market Size, By Form, 2013�2020 (USD Million)
Table 18 Identification Market Size, By Form, 2013�2020 (Million Square Meters)
Table 19 Identification Market Size, By Composition, 2013�2020 (USD Million)
Table 20 Informative Market Size, By Identification Method, 2013�2020 (USD Million)
Table 21 Informative Market Size, By Identification Method, 2013�2020 (Million Square Meters)
Table 22 Informative Market Size, By Form, 2013�2020 (USD Million)
Table 23 Informative Market Size, By Form, 2013�2020 (Million Square Meters)
Table 24 Informative Market Size, By Composition, 2013�2020 (USD Million)
Table 25 Others Market Size, By Identification Method, 2013�2020 (USD Million)
Table 26 Others Market Size, By Identification Method, 2013�2020 (Million Square Meters)
Table 27 Others Market Size, By Form, 2013�2020 (USD Million)
Table 28 Others Market Size, By Form, 2013�2020 (Million Square Meters)
Table 29 Others Market Size, By Composition, 2013�2020 (USD Million)
Table 30 Security Labels Market Size, By Identification Method, 2013�2020 (USD Million)
Table 31 Market Size, By Identification Method, 2013�2020 (Million Square Meters)
Table 32 Market Size, By Composition, 2013�2020 (USD Million)
Table 33 Facestock Market Size, By Composition, 2013�2020 (USD Million)
Table 34 Release Liner Market Size, By Composition , 2013�2020 (USD Million)
Table 35 Market Size, By Form, 2013�2020 (USD Million)
Table 36 Market Size, By Form, 2013�2020 (Million Square Meters)
Table 37 Sheets Market Size, By Application, 2013�2020 (USD Million)
Table 38 Sheets Market Size, By Application, 2013�2020 (Million Square Meters)
Table 39 Market Size, By Application, 2013�2020 (USD Million)
Table 40 Market Size, By Application, 2013�2020 (Million Square Meters)
Table 41 Food & Beverages Market Size, By Type, 2013�2020 (USD Million)
Table 42 Food & Beverages Market Size, By Type, 2013�2020 (Million Square Meters)
Table 43 Food and Beverage Market Size, By Identification Method, 2013�2020 (USD Million)
Table 44 Food and Beverage Market Size, By Identification Method, 2013�2020 (Million Square Meters)
Table 45 Retail Market Size, By Type, 2013�2020 (USD Million)
Table 46 Retail Market Size, By Type, 2013�2020 (Million Square Meters)
Table 47 Retail Market Size, By Identification Method, 2013�2020 (USD Million)
Table 48 Retail Market Size, By Identification Method, 2013�2020 (Million Square Meters)
Table 49 Pharmaceuticals Market Size, By Type, 2013�2020 (USD Million)
Table 50 Pharmaceuticals Market Size, By Type, 2013�2020 (Million Square Meters)
Table 51 Pharmaceuticals Market Size, By Identification Method, 2013�2020 (USD Million)
Table 52 Pharmaceuticals Market Size, By Identification Method, 2013�2020 (Million Square Meters)
Table 53 Consumer Durables Market Size, By Type, 2013�2020 (USD Million)
Table 54 Consumer Durables Market Size, By Type, 2013�2020 (Million Square Meters)
Table 55 Consumer Durables Market Size, By Identification Method, 2013�2020 (USD Million)
Table 56 Consumer Durables Market Size, By Identification Method, 2013�2020 (Million Square Meters)
Table 57 Others Market Size, By Type, 2013�2020 (USD Million)
Table 58 Others Market Size, By Type, 2013�2020 (Million Square Meters)
Table 59 Others Market Size, By Identification Method, 2013�2020 (USD Million)
Table 60 Others Market Size, By Identification Method, 2013�2020 (Million Square Meters)
Table 61 Security Labels Market Size, By Region, 2013�2020 (USD Million)
Table 62 Market Size, By Region, 2013�2020 (Million Square Meters)
Table 63 North America: Market Size, By Country, 2013�2020 (USD Million)
Table 64 North America: Market Size, By Country, 2013�2020 (Million Square Meters)
Table 65 North America: Market Size, By Type, 2013�2020 (USD Million)
Table 66 North America: Market Size, By Type, 2013�2020 (Million Square Meters)
Table 67 North America: Security Labels Market Size, By Identification Method, 2013�2020 (USD Million)
Table 68 North America: Market Size, By Identification Method, 2013�2020 (Million Square Meters)
Table 69 North America: Market Size, By Form, 2013�2020 (USD Million)
Table 70 North America: Market Size, By Form, 2013�2020 (Million Square Meters)
Table 71 North America: Market Size, By Composition, 2013�2020 (USD Million)
Table 72 North America: Security Labels Market Size, By Application, 2013�2020 (USD Million)
Table 73 North America: Market Size, By Application, 2013�2020 (Million Square Meters)
Table 74 U.S.: Market Size, By Type, 2013�2020 (USD Million)
Table 75 U.S.: Market Size, By Type, 2013�2020 (Million Square Meters)
Table 76 U.S.: Market Size, By Identification Method, 2013�2020 (USD Million)
Table 77 U.S.: Market Size, By Identification Method, 2013�2020 (Million Square Meters)
Table 78 U.S.: Security Labels Market Size, By Application, 2013�2020 (USD Million)
Table 79 U.S.: Market Size, By Application, 2013�2020 (Million Square Meters)
Table 80 Canada: Market Size, By Type, 2013�2020 (Million Square Meters)
Table 81 Canada: Market Size, By Identification Method, 2013�2020 (USD Million)
Table 82 Canada: Market Size, By Identification Method, 2013�2020 (Million Square Meters)
Table 83 Canada: Security Labels Market Size, By Application, 2013�2020 (USD Million)
Table 84 Canada: Market Size, By Application, 2013�2020 (Million Square Meters)
Table 85 Mexico: Market Size, By Type, 2013�2020 (USD Million)
Table 86 Mexico: Market Size, By Type, 2013�2020 (Million Square Meters)
Table 87 Mexico: Market Size, By Identification Method, 2013�2020 (USD Million)
Table 88 Mexico: Market Size, By Identification Method, 2013�2020 (Million Square Meters)
Table 89 Mexico: Security Labels Market Size, By Application, 2013�2020 (USD Million)
Table 90 Mexico: Market Size, By Application, 2013�2020 (Million Square Meters)
Table 91 Europe: Market Size, By Country, 2013�2020 (USD Million)
Table 92 Europe: Market Size, By Country, 2013�2020 (Million Square Meters)
Table 93 Europe: Market Size, By Type, 2013�2020 (USD Million)
Table 94 Europe: Market Size, By Type, 2013�2020 (Million Square Meters)
Table 95 Europe: Market Size, By Identification Method, 2013�2020 (USD Million)
Table 96 Europe: Security Labels Market Size, By Identification Method, 2013�2020 (Million Square Meters)
Table 97 Europe: Market Size, By Form, 2013�2020 (USD Million)
Table 98 Europe: Market Size, By Form, 2013�2020 (Million Square Meters)
Table 99 Europe: Market Size, By Composition, 2013�2020 (USD Million)
Table 100 Europe: Market Size, By Application, 2013�2020 (USD Million)
Table 101 Europe: Market Size, By Application, 2013�2020 (Million Square Meters)
Table 102 Germany: Security Labels Market Size, By Type, 2013�2020 (USD Million)
Table 103 Germany: Market Size, By Type, 2013�2020 (Million Square Meters)
Table 104 Germany: Market Size, By Identification Method, 2013�2020 (USD Million)
Table 105 Germany: Market Size, By Identification Method, 2013�2020 (Million Square Meters)
Table 106 Germany: Market Size, By Application, 2013�2020 (USD Million)
Table 107 Germany: Security Labels Market Size, By Application, 2013�2020 (Million Square Meters)
Table 108 France: Market Size, By Type, 2013�2020 (USD Million)
Table 109 France: Market Size, By Type, 2013�2020 (Million Square Meters)
Table 110 France: Market Size, By Identification Method, 2013�2020 (USD Million)
Table 111 France: Security Labels Market Size, By Identification Method, 2013�2020 (Million Square Meters)
Table 112 France: Market Size, By Application, 2013�2020 (USD Million)
Table 113 France: Market Size, By Application, 2013�2020 (Million Square Meters)
Table 114 U.K.: Security Labels Market Size, By Type, 2013�2020 (USD Million)
Table 115 U.K.: Market Size, By Type, 2013�2020 (Million Square Meters)
Table 116 U.K.: Market Size, By Identification Method, 2013�2020 (USD Million)
Table 117 U.K.: Market Size, By Identification Method, 2013�2020 (Million Square Meters)
Table 118 U.K.: Security Labels Market Size, By Application, 2013�2020 (USD Million)
Table 119 U.K.: Market Size, By Application, 2013�2020 (Million Square Meters)
Table 120 Spain: Market Size, By Type, 2013�2020 (USD Million)
Table 121 Spain: Market Size, By Type, 2013�2020 (Million Square Meters)
Table 122 Spain: Market Size, By Identification Method, 2013�2020 (USD Million)
Table 123 Spain: Security Labels Market Size, By Identification Method, 2013�2020 (Million Square Meters)
Table 124 Spain: Market Size, By Application, 2013�2020 (USD Million)
Table 125 Spain: Security Labels Market Size, By Application, 2013�2020 (Million Square Meters)
Table 126 Rest of Europe: Market Size, By Type, 2013�2020 (USD Million)
Table 127 Rest of Europe: Security Labels Market Size, By Type, 2013�2020 (Million Square Meters)
Table 128 Rest of Europe: Market Size, By Identification Method, 2013�2020 (USD Million)
Table 129 Rest of Europe: Security Labels Market Size, By Identification Method, 2013�2020 (Million Square Meters)
Table 130 Rest of Europe: Market Size, By Application, 2013�2020 (USD Million)
Table 131 Rest of Europe: Market Size, By Application, 2013�2020 (Million Square Meters)
Table 132 Asia-Pacific: Security Labels Market Size, By Country, 2013�2020 (USD Million)
Table 133 Asia-Pacific: Market Size, By Country, 2013�2020 (Million Square Meters)
Table 134 Asia-Pacific: Security Labels Market Size, By Type, 2013�2020 (USD Million)
Table 135 Asia-Pacific: Market Size, By Type, 2013�2020 (Million Square Meters)
Table 136 Asia-Pacific: Market Size, By Identification Method, 2013�2020 (USD Million)
Table 137 Asia-Pacific: Market Size, By Identification Method, 2013�2020 (Million Square Meters)
Table 138 Asia-Pacific: Market Size, By Form, 2013�2020 (USD Million)
Table 139 Asia-Pacific: Market Size, By Form, 2013�2020 (Million Square Meters)
Table 140 Asia-Pacific: Security Labels Market Size, By Composition, 2013�2020 (USD Million)
Table 141 Asia-Pacific: Market Size, By Application, 2013�2020 (USD Million)
Table 142 Asia-Pacific: Market Size, By Application 2013�2020 (Million Square Meters)
Table 143 China: Security Labels Market Size, By Type, 2013�2020 (USD Million)
Table 144 China: Market By Size, By Type, 2013�2020 (Million Square Meters)
Table 145 China: Market Size, By Identification Method, 2013�2020 (USD Million)
Table 146 China: Market Size, By Identification Method, 2013�2020 (Million Square Meters)
Table 147 China: Security Labels Market Size, By Application, 2013�2020 (USD Million)
Table 148 China: Market Size, By Application 2013�2020 (Million Square Meters)
Table 149 India: Market Size, By Type, 2013�2020 (USD Million)
Table 150 India: Market Size, By Type, 2013�2020 (Million Square Meters)
Table 151 India: Market Size, By Identification Method, 2013�2020 (USD Million)
Table 152 India: Security Labels Market Size, By Identification Method, 2013�2020 (Million Square Meters)
Table 153 India: Market Size, By Application, 2013�2020 (USD Million)
Table 154 India: Market Size, By Application, 2013�2020 (Million Square Meters)
Table 155 Japan: Market Size, By Type, 2013�2020 (USD Million)
Table 156 Japan: Market Size, By Type, 2013�2020 (Million Square Meters)
Table 157 Japan: Market Size, By Identification Method, 2013�2020 (USD Million)
Table 158 Japan: Security Labels Market Size, By Identification Method, 2013�2020 (Million Square Meters)
Table 159 Japan: Security Labels Market Size, By Application, 2013�2020 (USD Million)
Table 160 Japan: Market Size, By Application 2013�2020 (Million Square Meters)
Table 161 South Korea: Market Size, By Type, 2013�2020 (USD Million)
Table 162 South Korea: Market Size, By Type, 2013�2020 (Million Square Meters)
Table 163 South Korea: Security Labels Market Size, By Identification Method, 2013�2020 (USD Million)
Table 164 South Korea: Market Size, By Identification Method, 2013�2020 (Million Square Meters)
Table 165 South Korea: Market Size, By Application, 2013�2020 (USD Million)
Table 166 South Korea: Market Size, By Application 2013�2020 (Million Square Meters)
Table 167 Australia: Market Size, By Type 2013�2020 (USD Million)
Table 168 Australia: Market Size, By Type, 2013�2020 (Million Square Meters)
Table 169 Australia: By Size, By Identification Method, 2013�2020 (USD Million)
Table 170 Australia: Security Labels Market Size, By Identification Method, 2013�2020 (Million Square Meters)
Table 171 Australia: Market Size, By Application, 2013�2020 (USD Million)
Table 172 Australia: Market Size, By Application 2013�2020 (Million Square Meters)
Table 173 Indonesia: Security Labels Market Size, By Type 2013�2020 (USD Million)
Table 174 Indonesia: Market Size, By Type, 2013�2020 (Million Square Meters)
Table 175 Indonesia: Market Size, By Identification Method, 2013�2020 (USD Million)
Table 176 Indonesia: Market Size, By Identification Method, 2013�2020 (Million Square Meters)
Table 177 Indonesia: Security Labels Market Size, By Application, 2013�2020 (USD Million)
Table 178 Indonesia: Market Size, By Application 2013�2020 (Million Square Meters)
Table 179 Rest of Asia-Pacific: Market Size, By Type, 2013�2020 (USD Million)
Table 180 Rest of Asia-Pacific: Security Labels Market Size, By Type, 2013�2020 (Million Square Meters)
Table 181 Rest of Asia-Pacific: Market Size, By Identification Method, 2013�2020 (USD Million)
Table 182 Rest of Asia-Pacific: Market Size, By Identification Method, 2013�2020 (Million Square Meters)
Table 183 Rest of Asia-Pacific: Security Labels Market Size, By Application, 2013�2020 (USD Million)
Table 184 Rest of Asia-Pacific: Market Size, By Application 2013�2020 (Million Square Meters)
Table 185 RoW: Security Labels Market Size, By Country, 2013�2020 (USD Million)
Table 186 RoW: Market Size, By Country, 2013�2020 (Million Square Meters)
Table 187 RoW: Market Size, By Type 2013�2020 (USD Million)
Table 188 RoW: Market Size, By Type, 2013�2020 (Million Square Meters)
Table 189 RoW: Market Size, By Identification Method, 2013�2020 (USD Million)
Table 190 RoW: Security Labels Market Size, By Identification Method, 2013�2020 (Million Square Meters)
Table 191 RoW: Market Size, By Form, 2013�2020 (USD Million)
Table 192 RoW: Security Labels Market Size, By Form, 2013�2020 (Million Square Meters)
Table 193 RoW: Market Size, By Composition, 2013�2020 (USD Million)
Table 194 RoW: Market Size, By Application, 2013�2020 (USD Million)
Table 195 RoW: Market Size, By Application, 2013�2020 (Million Square Meters)
Table 196 Brazil: Security Labels Market Size, By Type, 2013�2020 (USD Million)
Table 197 Brazil: Market Size, By Type, 2013�2020 (Million Square Meters)
Table 198 Brazil: Market Size, By Identification Method, 2013�2020 (USD Million)
Table 199 Brazil: Security Labels Market Size, By Identification Method, 2013�2020 (Million Square Meters)
Table 200 Brazil : Market Size, By Application, 2013�2020 (USD Million)
Table 201 Brazil : Market Size, By Application 2013�2020 (Million Square Meters)
Table 202 UAE: Security Labels Market Size, By Type, 2013�2020 (USD Million)
Table 203 UAE: Market Size, By Type, 2013�2020 (Million Square Meters)
Table 204 UAE: Market Size, By Identification Method, 2013�2020 (USD Million)
Table 205 UAE: Security Labels Market Size, By Identification Method, 2013�2020 (Million Square Meters)
Table 206 UAE: Market Size, By Application, 2013�2020 (USD Million)
Table 207 UAE: Market Size, By Application, 2013�2020 (Million Square Meters)
Table 208 South Africa: Security Labels Market Size, By Type, 2013�2020 (USD Million)
Table 209 South Africa: Market Size, By Type, 2013�2020 (Million Square Meters)
Table 210 South Africa: Market Size, By Identification Method, 2013�2020 (USD Million)
Table 211 South Africa: Market Size, By Identification Method, 2013�2020 (Million Square Meters)
Table 212 South Africa: Market Size, By Application, 2013�2020 (USD Million)
Table 213 South Africa: Market Size, By Application, 2013�2020 (Million Square Meters)
Table 214 Others in RoW: Security Labels Market Size, By Type 2013�2020 (USD Million)
Table 215 Others in RoW: Market Size, By Type, 2013�2020 (Million Square Meters)
Table 216 Others in RoW: Market Size, By Identification Method, 2013�2020 (USD Million)
Table 217 Others in RoW: Security Labels Market Size, By Identification Method, 2013�2020 (Million Square Meters)
Table 218 Others in RoW: Market Size, By Application, 2013�2020 (USD Million)
Table 219 Others in RoW: Market Size, By Application 2013�2020 (Million Square Meters)
Table 220 Security Labels Market: New Product/Service Launches, 2010�2016
Table 221 Market: Acquisitions 2010�2016
Table 222 Market: Expansions 2010�2016
Table 223 Market: Joint Ventures, 2010�2016
List of Figures (59 Figures)
Figure 1 Security Labels Market
Figure 2 Market: Research Design
Figure 3 Breakdown of Primary Interviews: By Company Type, Designation & Region
Figure 4 Market Size Estimation Methodology: Bottom-Up Approach
Figure 5 Market Size Estimation Methodology: Top-Down Approach
Figure 6 Data Triangulation Methodology
Figure 7 Limitations of the Research Study
Figure 8 Security Labels Market Snapshot (2015 vs 2020): Market for Sheets to Grow at A Higher CAGR
Figure 9 China: the Fastest-Growing Market for Security Labels, 2015�2020
Figure 10 Leading Market Players Adopted New Product Developments, Acquisitions, Expansions, and Joint Ventures as Key Strategies Between 2010 & 2016
Figure 11 Emerging Economies Offer Attractive Opportunities in the Security Labels Market
Figure 12 Branding Captured the Largest Share in the Emerging Asia-Pacific Market in 2015
Figure 13 China Projected to Be the Fastest-Growing Country for Security Labels During the Forecast Period
Figure 14 Europe Occupied the Largest Market Share , in Terms of Value, Among All Regions in 2014
Figure 15 Emerging Markets to Grow Faster Than Developed Markets, 2015�2020
Figure 16 Evolution of Security Labels
Figure 17 Market Segmentation
Figure 18 Drivers, Restraints, Opportunities, and Challenges
Figure 19 Global Retail E-Commerce Sales From 2013 to 2018
Figure 20 Manufacturing & Service Sectors Snapshot
Figure 21 Pharmaceutical Market Size From 2005 to 2014 (USD Billion)
Figure 22 Price Development for Paper and Plastic, 2007-2011
Figure 23 Growth in Global Vehicle Production From 2009 to 2014
Figure 24 Security Labels Value Chain
Figure 25 Porter�s Five Forces Analysis
Figure 26 Branding is Projected to Be the Fastest-Growing Market From 2015 to 2020
Figure 27 Bar Codes Segment is Estimated to Dominate the Security Labels Market in 2015
Figure 28 Facestock Segment is Estimated to Dominated the Market in 2015
Figure 29 Sheets Segment is Projected to Be the Fastest-Growing Market From 2015 to 2020
Figure 30 Food & Beverages Segment is Estimated to Dominate the Market in 2015
Figure 31 Geographical Snapshot: Security Labels Market, By Growth Rate, 2015-2020
Figure 32 Europe to Be Dominant in the Market, 2015-2020
Figure 33 North America: Market Snapshot
Figure 34 Mexican Beverage Industry Market Size, 2009-2014 (USD Billion)
Figure 35 Europe: Market Snapshot
Figure 36 Germany: Vehicle Production Statistics From 2010 to 2014
Figure 37 Industrial Production in China From February 2015 to January 2016 (%Change)
Figure 38 Japan: Retail E-Commerce Sales From 2012 to 2018 (USD Billion)
Figure 39 Australian Processed Food Industry Size From 2008 to 2012 (USD Billion)
Figure 40 Companies Adopted New Product Launches & Acquisitions as Their Key Growth Strategies Over the Last Five Years (2011�2015)
Figure 41 Market Share, By Key Player, 2011�2014
Figure 42 2014 is the Most Active Year in Terms of Development for the Security Labels Market
Figure 43 New Product Launches: the Key Strategy, 2010�2016
Figure 44 Geographic Revenue Mix of Top Five Players
Figure 45 3M: Company Snapshot
Figure 46 SWOT Analysis: 3M
Figure 47 Honeywell International Inc.: Company Snapshot
Figure 48 SWOT Analysis: Honeywell International Inc.
Figure 49 UPM: Company Snapshot
Figure 50 SWOT Analysis: UPM
Figure 51 Avery Dennison Corporation: Company Snapshot
Figure 52 SWOT Analysis: Avery Dennison Corporation
Figure 53 CCL Industries, Inc: Company Snapshot
Figure 54 SWOT Analysis: CCL Industries, Inc
Figure 55 Tesa SE Group: Company Snapshot
Figure 56 Seiko Holdings Corporation: Company Snapshot
Figure 57 Label Lock: Company Snapshot
Figure 58 Groupdc: Company Snapshot
Figure 59 Polylabel.Com: Company Snapshot


Growth opportunities and latent adjacency in Security Labels Market