Industrial Labels Market by Type (Warning, Asset Tags), Material (Polymer, Metal), Industry (Transportation, Automotive), Mechanism (Pressure-sensitive, Glue-applied), Printing Technology, Identification Technology, and Region - Global Forecast to 2021


[188 Pages Report] The market for industrial labels is estimated to grow from USD 43.04 Billion in 2016 to reach USD 55.95 Billion by 2021, at a CAGR of 5.39%. The base year considered for the study is 2015 and the market size is projected from 2016 to 2021. The segments considered for this report are based on type, material, end-use industry, mechanism, printing technology, identification technology, and region.
The key objective of the global industrial labels report is to provide companies with a summary of the latest trends and lucrative business expansion opportunities for industrial label manufacturers, suppliers, and distributors. The report also demonstrates the key business strategies and principles adopted by the key players around the world. This report is intended:
- To define, segment, and project the size of the global industrial labels market on the basis of type, material, end-use industry, printing technology, mechanism, identification technology, and region
- To analyze opportunities in the market for stakeholders and provide a competitive landscape of the market leaders
- To strategically profile key players and comprehensively analyze their core competencies
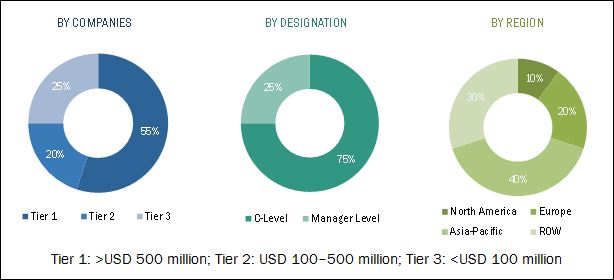
The research methodology used to forecast the market size was with the top-down approach. The total market size of industrial labels was calculated based on the percentage split of industrial labels and percentage splits of different types preferred as industrial labels. This allotment and calculation were done on the basis of extensive primary interviews and secondary research from a variety of sources such as European Flexographic Industry Association, European Label Association, and many more. Primary research involved in this report includes extensive interviews with key people such as CEOs, VPs, directors, and executives. After arriving at the overall market size, the total market was split into several segments and subsegments. Data triangulation and market breakdown procedures were used to complete the overall market engineering process and arrive at the exact statistics for all segments and subsegments. The breakdown of profiles of primary is depicted in the below figure:
To know about the assumptions considered for the study, download the pdf brochure
The global industrial labels ecosystem comprises industrial label manufacturers, vendors, and service providers. The value chain of the industrial label market includes printing machinery manufactures such as HP Inc. (U.S.), Cannon Inc. (U.S.), Xerox Corporation (U.S.), Cenveo, Inc. (U.S.), and many more. The labels manufacturers include CCL Industries, Inc. (Canada), H.B. Fuller Co. (U.S.), Cenveo, Inc. (U.S.), Dunmore Corporation (U.S.), 3M Company (U.S.), Brady Corporation (U.S.), Avery Dennison Corporation (U.S.), DuPont (U.S.), and Henkel Ag & Company (Germany). Additionally, the products are used in construction, automotive, consumer durables, and logistics & transportation industries on a global scale.
Target Audience
- Industrial label manufacturers
- OEMs
- Manufacturing organizations
- Automotive manufacturers
- Construction organizations
Scope of the Report
- This research report segments industrial labels into the following submarkets.
By Type:
- Warning/security labels
- Branding labels
- Weatherproof labels
- Equipment asset tags
- Others (multiple die-cut labels, drum label, tire labels, and battery labels)
By End-Use Industry:
- Transportation & logistics
- Construction
- Automotive
- Consumer durables
- Others (aerospace, marine, and postal services)
By Material:
- Metal
- Polymer
By Printing Technology:
- Digital printing
- Flexography
- Lithography
- Screen printing
- Others (gravure, letterpress, and offset)
By Mechanism:
- Pressure-sensitive
- Glue-applied
- Heat transfer
- Others (non-shrink wraparound, heat-seal, gummed, and foam mechanism)
By Region:
- North America
- Europe
- Asia-Pacific
- RoW
Available Customizations
With the given market data, MarketsandMarkets offers customizations as per the client-specific needs. The following customization options are available for the report:
Product Analysis
- Product Matrix which gives a detailed comparison of the market for different recycled product types
Geographic Analysis
- Further analysis of the industrial labels market for additional countries
Company Information
- Detailed analysis and profiling of additional market players (up to 5)
MarketsandMarkets projects that the industrial labels market will grow from USD 43.04 Billion in 2016 to USD 55.95 Billion by 2021, at an estimated CAGR of 5.39%. The market is growing due to growth in end-use industries such as construction, aerospace & defense, automotive, consumer durables, transportation & logistics, and many more. Along with the same, rise in demand of sustainable & recyclable labeling & packaging material has fueled the market for industrial labels. Emerging economies such as India, South Africa, Brazil, and oil-centric GCC (Gulf Cooperation Countries) possess a great potential for the industrial label market.
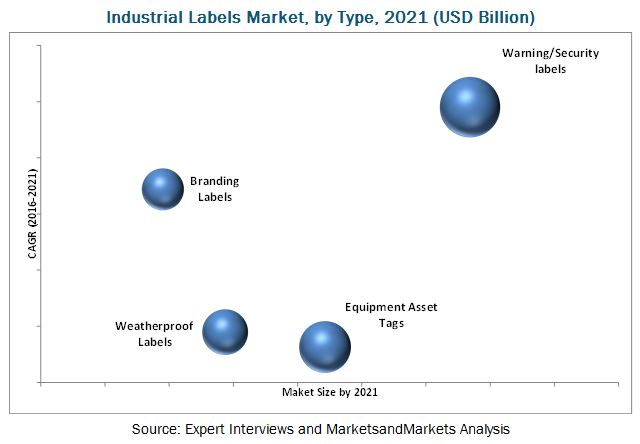
This market is segmented on the basis of type, end-use industry, material, printing technology, mechanism, identification technology, and region. In terms of type, warning/security labels held the largest market share, in terms of value. It is projected to grow at the highest CAGR. The excellent growth is witnessed because of the increasing demand of these labels in industries such as construction, automotive, consumer durables, and transportation & logistics.
In terms of material, the polymer material segment accounted for the largest share in this market, in terms of both value and volume, among material types. However, the metal material labels segment is projected to grow at a significant rate. The demand for metal labeling propelled because of a variety of reasons such as durability, cost effectiveness, and easy installation.
In terms of end-use industry, the market is segmented into transportation & logistics, construction, automotive, consumer durables, and others. The transportation & logistics segment is projected to grow at the highest rate due to the increasing trends in the supply chain & warehousing industry and online shopping ability of consumers.
In terms of region, the market for industrial labels is segmented into North America, Europe, Asia-Pacific, and Rest of the World. The Asia-Pacific region is projected to grow at the highest CAGR among all the regions by 2021. This is mainly due to emerging economies in China, Southeast countries and India; urbanization; industrialization; and excellent PEST (political, economic, social, and technological) conditions.
The laser engraving labels segment in the industrial labels market has high growth as these are applicable on almost any type of materials such a platinum, silver, brass, gold, stainless steel, carbide, copper, titanium, and plastics with a variety of advantages.
The strategies such as mergers & acquisitions and agreements & expansions were majorly adopted by most of the players in this market. Companies such as H.B. Fuller (U.S.), Henkel Ag & Co. KGaA (Germany), CCL Industries Inc. (Canada), and Fuji Seal International, Inc. (Japan) were the key players who adopted these strategies to increase the reach of their offerings, improve their production capacity, and establish focus on core operations. Companies also emphasized on new product launches to increase their product portfolio in the fast-growing regions. Companies such as Brady Corporation (U.S.) and DUNMORE (U.S.) have adopted this strategy. These players also have a strong distribution network and influencing presence in the developed as well as developing economies.
To speak to our analyst for a discussion on the above findings, click Speak to Analyst
 Exclusive indicates content/data unique to MarketsandMarkets and not available with any competitors.
Table of Contents
1 Introduction (Page No. - 16)
1.1 Objectives of the Study
1.2 Market Definition
1.2.1 Study Scope
1.2.2 Periodization
1.3 Currency Considered
1.4 Units Considered
1.5 Limitations
1.6 Stakeholders
2 Research Methodology (Page No. - 19)
2.1 Research Data
2.2 Secondary Data
2.2.1 Key Data From Secondary Sources
2.3 Primary Data
2.3.1 Key Data From Primary Sources
2.3.2 Key Industry Insights
2.4 Market Size Estimation
2.5 Data Triangulation
2.6 Research Assumptions & Limitations
2.6.1 Assumptions
3 Executive Summary (Page No. - 27)
3.1 Industrial Labels Market Size, By Type, 2016–2021 (USD Billion)
3.2 Industrial Label Market Size, By End-Use Industry, 2016 vs 2021 (USD Billion)
3.3 Industrial Labels Market Size, By Mechanism, 2016–2021 (USD Billion)
3.4 Industrial Label Market Size, By Printing Technology, 2014–2021 (USD Billion)
3.5 Industrial Labels Market Share (Value), By Identification Technology, 2016
4 Premium Insights (Page No. - 34)
4.1 Industrial Labels Market Growth
4.2 Industrial Label Market Size, By Type, (2016-2021)
4.3 Asia-Pacific Industrial Labels Market, By Country & End-Use Industry
4.4 Industrial Labels Market Size, By Region, 2016 vs 2021 (USD Billion)
4.5 Industrial Label Market Size, By Major Country, 2016 vs 2021 (USD Billion)
4.6 Life Cycle Analysis, By Region
5 Market Overview (Page No. - 40)
5.1 Introduction
5.2 Evolution of Industrial Labels Market
5.3 Industrial Labels Market Segmentation
5.4 Market Dynamics
5.4.1 Drivers
5.4.1.1 Increasing Production of Consumer Durable Goods
5.4.1.2 Growing Automotive Industry
5.4.1.3 Rising Popularity of Online Designing Tools
5.4.2 Restraints
5.4.2.1 Rise in Raw Material Cost
5.4.3 Opportunities
5.4.3.1 Developing Countries: New Destinations for Expansion
5.4.4 Challenges
5.4.4.1 Growing Demand for Laser Engraving in Labels
6 Industrial Labels Market, By Type (Page No. - 48)
6.1 Introduction
6.2 Warning/Security Labels
6.3 Equipment Asset Labels
6.4 Weatherproof Labels
6.5 Branding Labels
6.6 Others
7 Industrial Labels Market, By Mechanism (Page No. - 59)
7.1 Introduction
7.2 Pressure Sensitive Labeling
7.3 Glue-Applied Labeling
7.4 Heat Transfer
7.5 Others
8 Industrial Labels Market, By Raw Material (Page No. - 63)
8.1 Introduction
8.2 Metal Labels
8.3 Plastic/Polymer Labels
8.3.1 Polypropylene (PP)
8.3.2 Polyethylene (PE)
8.3.3 Polycarbonate (PC)
8.3.4 Polyurethane (PU)
8.3.5 Others in Plastic
9 Industrial Labels Market, By Identification Technology (Page No. - 70)
9.1 Introduction
9.2 Barcode
9.3 RFID
9.4 Others
10 Industrial Labels Market, By Printing Technology (Page No. - 74)
10.1 Introduction
10.2 Flexography
10.3 Offset
10.4 Digital Printing
10.5 Screen Printing
10.6 Others
11 Industrial Labels Market, By End-Use Industry (Page No. - 79)
11.1 Introduction
11.2 Transportation & Logistics
11.3 Automotive
11.4 Consumer Durables
11.5 Construction
11.6 Others
12 Industrial Labels Market, By Region (Page No. - 83)
12.1 Introduction
12.2 Asia-Pacific
12.2.1 China
12.2.2 Japan
12.2.3 India
12.2.4 Australia
12.2.5 Rest of Asia-Pacific
12.3 Europe
12.3.1 Germany
12.3.2 U.K.
12.3.3 Russia
12.3.4 France
12.3.5 Rest of Europe
12.4 North America
12.4.1 North America
12.4.2 U.S.
12.4.3 Canada
12.4.4 Mexico
12.5 Rest of the World (RoW)
12.5.1 Latin America
12.5.2 Middle East & North Africa (MENA)
12.5.3 Other Countries in RoW
13 Competitive Landscape (Page No. - 142)
13.1 Overview
13.2 Competitive Situation & Trends
13.3 Key Growth Strategies, 2012–2016
13.3.1 Mergers & Acquisitions
13.3.2 New Product Launches
13.3.3 Expansions & Agreements
14 Company Profiles (Page No. - 148)
(Company at A Glance, Business Overview, Products Offered, Key Strategy, Recent Developments, SWOT Analysis & MnM View)*
14.1 Introduction
14.2 Avery Dennison Corporation
14.3 3M
14.4 Dupont
14.5 Ccl Industries Inc.
14.6 Brady Corporation
14.7 Cenveo Corporation
14.8 Henkel AG & Co. KGAA
14.9 H.B. Fuller
14.10 Fuji Seal International, Inc.
14.11 Dunmore
*Details on Company at A Glance, Recent Financials, Products Offered, Strategies & Insights, & Recent Developments Might Not Be Captured in Case of Unlisted Companies.
15 Appendix (Page No. - 176)
15.1 Insights of Industry Experts
15.2 Discussion Guide
15.3 Knowledge Store: Marketsandmarkets’ Subscription Portal
15.4 Company Developments
15.4.1 Mergers & Acquisitions
15.4.2 Expansions & Investments
15.4.3 New Product Launches
15.5 Introducing RT: Real Time Market Intelligence
15.6 Available Customizations
15.7 Related Reports
List of Tables (132 Tables)
Table 1 Asia-Pacific Urbanization Prospects
Table 2 Benefits of Laser-Engraved Labels
Table 3 Industrial Labels Market Size, By Type, 2014–2021 (USD Million)
Table 4 Industrial Label Market Size, By Type, 2014–2021 (Million Square Meters)
Table 5 Warning/Security Labels Market Size, By End-Use Industry, 2014–2021 (USD Million)
Table 6 Warning/Security Labels Market Size, By End-Use Industry, 2014–2021 (Million Square Meters)
Table 7 Equipment Asset Tags Market Size, By End-Use Industry, 2014–2021 (USD Million)
Table 8 Equipment Asset Tags Market Size, By End-Use Industry, 2014–2021 (Million Square Meters)
Table 9 Weatherproof Labels Market Size, By End-Use Industry, 2014–2021 (USD Million)
Table 10 Weatherproof Labels Market Size, By End-Use Industry, 2014–2021 (Million Square Meters)
Table 11 Branding Labels Market Size, By End-Use Industry, 2014–2021 (USD Million)
Table 12 Branding Labels Market Size, By End-Use Industry, 2014–2021 (Million Square Meters)
Table 13 Other Types Market Size, By End-Use Industry, 2014–2021 (USD Million)
Table 14 Other Types Market Size, By End Use Industry, 2014–2021 (Million Square Meters)
Table 15 Industrial Labels Market Size, By Mechanism, 2014–2021 (USD Million)
Table 16 Industrial Label Market Size, By Mechanism, 2014–2021 (Million Square Meters)
Table 17 Industrial Labels Market Size, By Raw Material, 2014–2021 (USD Million)
Table 18 Industrial Label Market Size, By Raw Material, 2014–2021 (Million Square Meters)
Table 19 Metal Labels Properties
Table 20 Metal Labels Market Size, By Type, 2014–2021 (USD Million)
Table 21 Metal Labels Market Size, By Type, 2014–2021 (Million Square Meters)
Table 22 Properties of Polypropylene
Table 23 Properties of Polyethylene
Table 24 Properties of Polycarbonate
Table 25 Properties of Polyurethane
Table 26 Plastic/Polymer Market Size, By Type, 2014–2021 (USD Million)
Table 27 Plastic/Polymer Market Size, By Type, 2014–2021 (Million Square Meters)
Table 28 Industrial Labels Market Size, By Identification Technology, 2014–2021 (USD Million)
Table 29 Industrial Label Market Size, By Identification Technology, 2014–2021 (Million Square Meters)
Table 30 Industrial Labels Market Size, By Printing Technology, 2014-2021 (USD Million)
Table 31 Industrial Label Market Size, By Printing Technology, 2014-2021 (Million Square Meters)
Table 32 Industrial Labels Market Size, By End-Use Industry, 2014–2021 (USD Million)
Table 33 Industrial Label Market Size, By End-Use Industry, 2014–2021 (Million Square Meters)
Table 34 Industrial Labels Market Size, By Region, 2014–2021 (USD Million)
Table 35 Industrial Label Market Size, By Region, 2014–2021 (Million Square Meters)
Table 36 Asia-Pacific Automotive Production, By Country, 2015 (Units)
Table 37 Asia-Pacific: Industrial Labels Market Size, By Country, 2014–2021 (USD Million)
Table 38 Asia-Pacific: Market Size, By Country, 2014–2021 (Million Square Meters)
Table 39 Asia-Pacific: Market Size, By Type, 2014–2021 (USD Million)
Table 40 Asia-Pacific: Market Size, By Type, 2014–2021 (Million Square Meters)
Table 41 Asia-Pacific: Market Size, By End-Use Industry, 2014–2021 (USD Million)
Table 42 Asia-Pacific: Market Size, By End-Use Industry, 2014–2021 (Million Square Meters)
Table 43 China: Industrial Labels Market Size, By Type, 2014–2021 (USD Million)
Table 44 China: Market Size, By Type, 2014–2021 (Million Square Meters)
Table 45 China: Market Size, By End-Use Industry, 2014–2021 (USD Million)
Table 46 China: Market Size, By End-Use Industry, 2014–2021 (Million Square Meters)
Table 47 Japan: Industrial Labels Market Size, By Type, 2014–2021 (USD Million)
Table 48 Japan: Market Size, By Type, 2014–2021 (Million Square Meters)
Table 49 Japan: Market Size, By End-Use Industry, 2014–2021 (USD Million)
Table 50 Japan: Market Size, By End-Use Industry, 2014–2021 (Million Square Meters)
Table 51 India: Industrial Labels Market Size, By Type, 2014–2021 (USD Million)
Table 52 India: Market Size, By Type, 2014–2021 (Million Square Meters)
Table 53 India: Market Size, By End-Use Industry, 2014–2021 (USD Million)
Table 54 India: Market Size, By End-Use Industry, 2014–2021 (Million Square Meters)
Table 55 Australia: Industrial Labels Market Size, By Type, 2014–2021 (USD Million)
Table 56 Australia: Market Size, By Type, 2014–2021 (Million Square Meters)
Table 57 Australia: Market Size, By End-Use Industry, 2014–2021 (USD Million)
Table 58 Australia: Market Size, By End-Use Industry, 2014–2021 (Million Square Meters)
Table 59 Rest of Asia-Pacific: Industrial Labels Market Size, By Type, 2014–2021 (USD Million)
Table 60 Rest of Asia-Pacific: Market Size, By Type, 2014–2021 (Million Square Meters)
Table 61 Rest of Asia-Pacific: Market Size, By End-Use Industry, 2014–2021 (USD Million)
Table 62 Rest of Asia-Pacific: Market Size, By End-Use Industry, 2014–2021 (Million Square Meters)
Table 63 European Automotive Production, By Country, 2015 (Units)
Table 64 Europe: Industrial Labels Market Size, By Country, 2014–2021 (USD Million)
Table 65 Europe: Market Size, By Country, 2014–2021 (Million Square Meters)
Table 66 Europe: Market Size, By Type, 2014–2021 (USD Million)
Table 67 Europe: Market Size, By Type, 2014–2021 (Million Square Meters)
Table 68 Europe: Market Size, By End-Use Industry, 2014–2021 (USD Million)
Table 69 Europe: Market Size, By End-Use Industry, 2014–2021 (Million Square Meters)
Table 70 Germany: Industrial Labels Market Size, By Type, 2014–2021 (USD Million)
Table 71 Germany: Market Size, By Type, 2014–2021 (Million Square Meters)
Table 72 Germany: Market Size, By End-Use Industry, 2014–2021 (USD Million)
Table 73 Germany: Market Size, By End-Use Industry, 2014–2021 (Million Square Meters)
Table 74 U.K.: Industrial Labels Market Size, By Type, 2014–2021 (USD Million)
Table 75 U.K.: Market Size, By Type, 2014–2021 (Million Square Meters)
Table 76 U.K.: Market Size, By End-Use Industry, 2014–2021 (USD Million)
Table 77 U.K.: Market Size, By End-Use Industry, 2014–2021 (Million Square Meters)
Table 78 Russia: Industrial Labels Market Size, By Type, 2014–2021 (USD Million)
Table 79 Russia: Market Size, By Type, 2014–2021 (Million Square Meters)
Table 80 Russia: Market Size, By End-Use Industry, 2014–2021 (USD Million)
Table 81 Russia: Market Size, By End-Use Industry, 2014–2021 (Million Square Meters)
Table 82 France: Industrial Labels Market Size, By Type, 2014–2021 (USD Million)
Table 83 France: Market Size, By Type, 2014–2021 (Million Square Meters)
Table 84 France: Market Size, By End-Use Industry, 2014–2021 (USD Million)
Table 85 France: Market Size, By End-Use Industry, 2014–2021 (Million Square Meters)
Table 86 Rest of Europe: Industrial Labels Market Size, By Type, 2014–2021 (USD Million)
Table 87 Rest of Europe: Market Size, By Type, 2014–2021 (Million Square Meters)
Table 88 Rest of Europe: Market Size, By End-Use Industry, 2014–2021 (USD Million)
Table 89 Rest of Europe: Market Size, By End-Use Industry, 2014–2021 (Million Square Meters)
Table 90 North American Automotive Production in 2015, By Country (Units)
Table 91 North America: Industrial Labels Market Size, By Country, 2014–2021 (USD Million)
Table 92 North America: Market Size, By Country, 2014–2021 (Million Square Meters)
Table 93 North America: Market Size, By Type, 2014–2021 (USD Million)
Table 94 North America: Market Size, By Type, 2014–2021 (Million Square Meters)
Table 95 North America: Market Size, By End-Use Industry, 2014–2021 (USD Million)
Table 96 North America: Market Size, By End-Use Industry, 2014–2021 (Million Square Meters)
Table 97 U.S.: Industrial Labels Market Size, By Type, 2014–2021 (USD Million)
Table 98 U.S.: Market Size, By Type, 2014–2021 (Million Square Meters)
Table 99 U.S.: Market Size, By End-Use Industry, 2014–2021 (USD Million)
Table 100 U.S.: Market Size, By End-Use Industry, 2014–2021 (Million Square Meters)
Table 101 Canada: Industrial Labels Market Size, By Type, 2014–2021 (USD Million)
Table 102 Canada: Market Size, By Type, 2014–2021 (Million Square Meters)
Table 103 Canada: Market Size, By End-Use Industry, 2014–2021 (USD Million)
Table 104 Canada: Market Size, By End-Use Industry, 2014–2021 (Million Square Meters)
Table 105 Mexico: Industrial Labels Market Size, By Type, 2014–2021 (USD Million)
Table 106 Mexico: Market Size, By Type, 2014–2021 (Million Square Meters)
Table 107 Mexico: Market Size, By End-Use Industry, 2014–2021 (USD Million)
Table 108 Mexico: Market Size, By End-Use Industry, 2014–2021 (Million Square Meters)
Table 109 RoW: Automotive Production, By Country, 2015 (Units)
Table 110 RoW: Industrial Labels Market Size, By Country, 2014–2021 (USD Million)
Table 111 RoW: Market Size, By Country, 2014–2021 (Million Square Meters)
Table 112 RoW: Market Size, By Type, 2014–2021 (USD Million)
Table 113 RoW: Market Size, By Type, 2014–2021 (Million Square Meters)
Table 114 RoW: Market Size, By End-Use Industry, 2014–2021 (USD Million)
Table 115 RoW: Market Size, By End-Use Industry, 2014–2021 (Million Square Meters)
Table 116 Latin America: Industrial Labels Market Size, By Type, 2014–2021 (USD Million)
Table 117 Latin America: Market Size, By Type, 2014–2021 (Million Square Meters)
Table 118 Latin America: Market Size, By End-Use Industry, 2014–2021 (USD Million)
Table 119 Latin America: Market Size, By End-Use Industry, 2014–2021 (Million Square Meters)
Table 120 MENA: Industrial Labels Market Size, By Type, 2014–2021 (USD Million)
Table 121 MENA: Market Size, By Type, 2014–2021 (Million Square Meters)
Table 122 MENA: Market Size, By End-Use Industry, 2014–2021 (USD Million)
Table 123 MENA: Market Size, By End-Use Industry, 2014–2021 (Million Square Meters)
Table 124 Other Countries in RoW: Industrial Labels Market Size, By Type, 2014–2021 (USD Million)
Table 125 Other Countries in RoW: Market Size, By Type, 2014–2021 (Million Square Meters)
Table 126 Other Countries in RoW: Market Size, By End-Use Industry, 2014–2021 (USD Million)
Table 127 Other Countries in RoW: Market Size, By End-Use Industry, 2014–2021 (Million Square Meters)
Table 128 H.B. Fuller Emphasized on Mergers & Acquisitions to Expand Its Business
Table 129 Mergers & Acquisitions, 2012–2016
Table 130 New Product Launches, 2012–2016
Table 131 Expansions & Agreements, 2012–2016
Table 132 3M Awards in 2015
List of Figures (53 Figures)
Figure 1 Industrial Labels Market
Figure 2 Industrial Label Market: Research Design
Figure 3 Breakdown of Primary Interviews: By Company Type, Designation, and Region
Figure 4 Market Size Estimation Methodology: Bottom-Up Approach
Figure 5 Market Size Estimation Methodology: Top-Down Approach
Figure 6 Data Triangulation Methodology
Figure 7 Warning/Security Labels Dominated the Industrial Labels Market in 2015
Figure 8 Transportation & Logistics Dominated the Industrial Label Market in 2015
Figure 9 Pressure-Sensitive Mechanism Projected to Be the Fastest-Growing Market By 2021
Figure 10 Digital Printing Technology Projected to Be the Largest and Fastest-Growing Market By 2021
Figure 11 Radio Frequency Identification (RFID) Technology Projected to Be the Fastest-Growing Market By 2021
Figure 12 Asia-Pacific Projected to Be the Fastest-Growing Region for the Industrial Labels Market
Figure 13 Leading Market Players Adopted Mergers & Acquisitions as the Key Strategy From 2012 to 2016
Figure 14 Attractive Market Opportunities in the Industrial Labels Market
Figure 15 China is Projected to Be the Fastest-Growing Market During the Next Five Years
Figure 16 Warning/Security Labels to Dominate the Industrial Label Market During the Forecast Period
Figure 17 Transportation & Logistics Segment Captured the Largest Share in the Asia-Pacific Region in 2015
Figure 18 Asia-Pacific is Projected to Be the Prime Revenue Generator in the Industrial Labels Market By 2021
Figure 19 Industrial Labels Market: Developing vs Developed Countries
Figure 20 Asia-Pacific to Be the Fastest-Growing Market
Figure 21 First Industrial Label Was Synthesized in Mid-1950s
Figure 22 Industrial Labels Market Segmentation
Figure 23 Increasing Demand From End-Use Industries is the Major Driver of the Market
Figure 24 Global Electronics and Consumer Goods Industry, 2015
Figure 25 Motor Vehicle Production, By Country, 2015
Figure 26 Warning/Security Labels to Dominate the Market During the Forecast Period
Figure 27 Pressure-Sensitive Mechanism Dominated the Industrial Labels Market, in Terms of Value, 2015
Figure 28 Digital Printing is Estimated to Grow at the Highest CAGR During the Forecast Period
Figure 29 Transportation & Logistics to Grow at the Highest CAGR During the Forecast Period
Figure 30 Geographic Snapshot: Industrial Labels Market Growth Rate, By Key Country, 2016–2021
Figure 31 Asia-Pacific: Market Snapshot
Figure 32 Europe: Industrial Labels Market Snapshot
Figure 33 North America: Market Snapshot
Figure 34 RoW Market Snapshot
Figure 35 Companies Adopted Mergers & Acquisitions as Their Key Growth Strategies, 2012–2016
Figure 36 Growth Comparison of Key Players in the Industrial Labels Market, 2012–2015
Figure 37 2014 Was the Most Active in the Industrial Label Market, in Terms of Developments
Figure 38 Mergers & Acquisitions: the Key Strategy, 2012–2016
Figure 39 Geographic Revenue Mix of Top Five Market Players
Figure 40 Avery Dennison Corporation: Company Snapshot
Figure 41 Avery Dennison Corporation: SWOT Analysis
Figure 42 3M: Company Snapshot
Figure 43 3M: SWOT Analysis
Figure 44 Dupont: Company Snapshot
Figure 45 SWOT Analysis: E. I. Du Pont De Nemours and Company
Figure 46 CCL Industries Inc.: Company Snapshot
Figure 47 SWOT Analysis: CCL Industries Inc.
Figure 48 Brady Corporation: Company Snapshot
Figure 49 SWOT Analysis: Brady Corporation
Figure 50 Cenveo Corporation: Company Snapshot
Figure 51 Henkel AG & Co. KGAA: Company Snapshot
Figure 52 H.B. Fuller : Company Snapshot
Figure 53 Fuji Seal International, Inc: Company Snapshot


Growth opportunities and latent adjacency in Industrial Labels Market