
SCADA Market Size, Share & Trends 2032

SCADA Market by Component (Programmable Logic Controllers (PLCs), Remote Terminal Units (RTUs), Human-machine Interfaces (HMIs), Communication Systems, Input/Output (I/O) Devices, Sensors, Actuators, Terminal Blocks, Connectors) - Global Forecast to 2030


OVERVIEW
Source: Secondary Research, Interviews with Experts, MarketsandMarkets Analysis
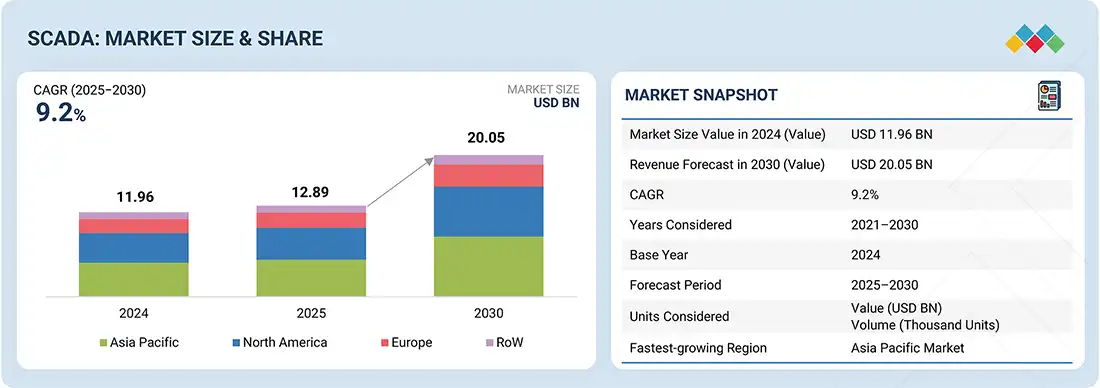
The global SCADA market is projected to grow from USD 12.89 billion in 2025 to USD 20.05 billion by 2030, at a CAGR of 9.2%. Growth is fuelled by rising demand for intelligent monitoring across utilities, manufacturing, oil & gas, and transportation. Improvements in cloud integration, IIoT, edge analytics, and increased investments in smart infrastructure and automation are boosting SCADA adoption. The need for cybersecurity and remote management further shapes the market, positioning SCADA as a core enabler of next-generation industrial ecosystems.
KEY TAKEAWAYS
-
BY OFFERINGThe SCADA market is segmented into hardware, software, and services. Hardware forms the backbone with PLCs, RTUs, HMIs, and communication systems, enabling efficient control and real-time monitoring. Software solutions focus on data acquisition, visualization, and analysis, supported by on-premises and cloud deployments. Services, including installation, maintenance, and managed offerings, ensure system reliability, scalability, and cybersecurity.
-
BY END USERThe SCADA market caters to process industries, discrete industries, and utilities. Process industries such as chemicals, pharmaceuticals, food & beverages, and oil & gas drive adoption through reliability, compliance, and process efficiency. Discrete industries, such as automotive and electronics, leverage SCADA for real-time monitoring and optimization, while utilities in power, water, transport, and telecom use it to enhance stability, smart infrastructure, and network management.
-
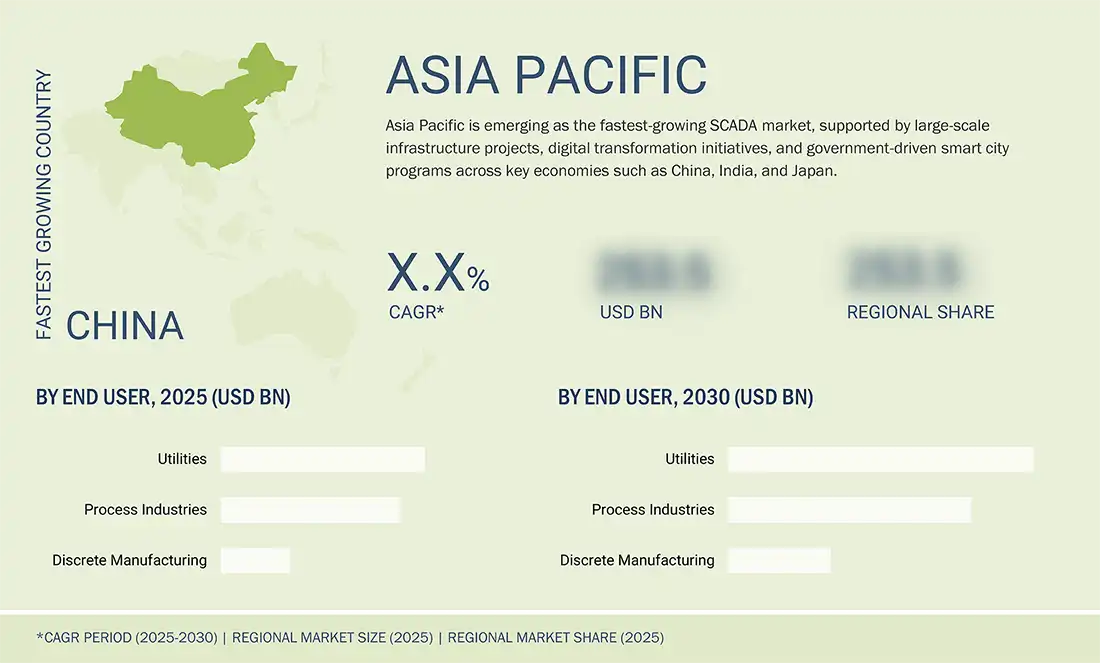
BY REGIONAsia Pacific is estimated to be the fastest-growing SCADA market, with a CAGR of 10.2%. Growth is fuelled by rapid industrialization, strong adoption of automation in manufacturing, energy, and transportation sectors, and increasing investment in smart infrastructure across China, Japan, and India.
-
COMPETITIVE LANDSCAPELeading players such as Schneider Electric, ABB, and Siemens are pursuing organic and inorganic growth strategies, including product innovation, strategic partnerships, and investments, to strengthen their market presence and address the growing demand for SCADA solutions across industries.
The SCADA market is projected to grow steadily over the next decade, driven by the increasing demand for automation, real-time monitoring, and operational efficiency. Integrating cloud platforms, IIoT, and AI-based analytics enhances system capabilities, positioning SCADA as a critical tool for managing complex industrial operations, improving asset reliability, and reducing operational costs across industries.
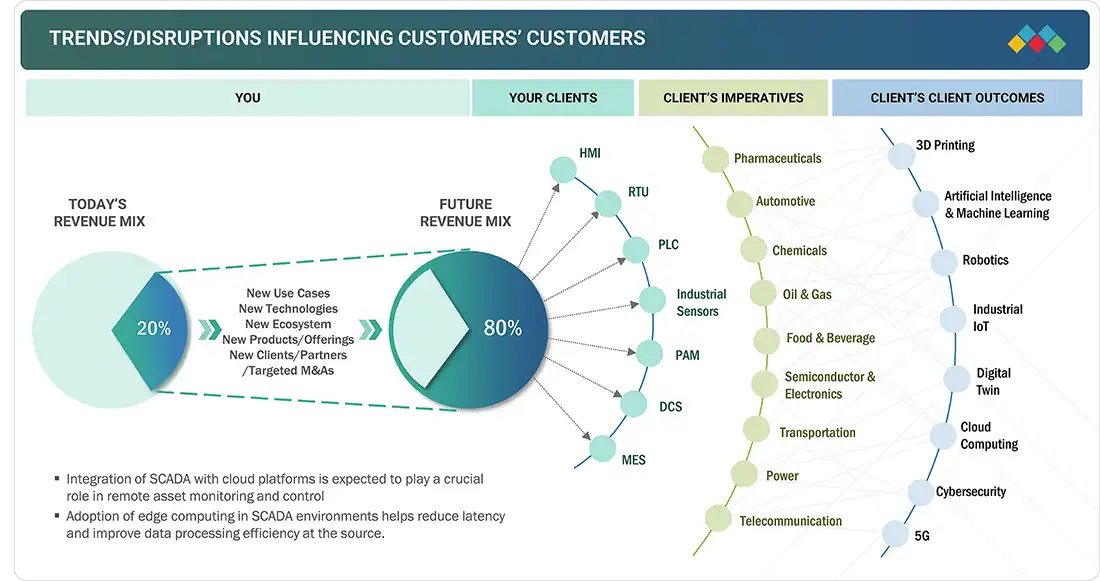
TRENDS & DISRUPTIONS IMPACTING CUSTOMERS' CUSTOMERS
The impact on consumers' business in the SCADA market stems from evolving customer needs and industry disruptions. Utilities, manufacturing, oil & gas, and transportation companies are the primary users of SCADA solutions, with critical infrastructure management as the key focus area. Shifts toward automation, digital monitoring, and stricter regulatory compliance directly influence the operational performance and revenues of end users. These impacts, in turn, drive the demand for advanced SCADA systems and services, shaping the market's growth trajectory.
Source: Secondary Research, Interviews with Experts, MarketsandMarkets Analysis
MARKET DYNAMICS
Level
-
Increased productivity and operational efficiency due to growing implementation of Industry 4.0

-
Unprecedented scale of renewable energy deployment

Level
-
Significant installation and maintenance costs associated with SCADA systems

-
High complexity and extensive customization requirements of SCADA systems

Level
-
Shift from on-premises SCADA infrastructure to cloud-based solutions

-
Increasing implementation of SCADA systems across transportation, smart buildings, and agricultural sectors

Level
-
Vulnerability of SCADA systems to cybersecurity threats

-
Incompatibility between communication protocols in SCADA systems

Source: Secondary Research, Interviews with Experts, MarketsandMarkets Analysis
Driver: Increased productivity and operational efficiency due to the growing implementation of Industry 4.0
The growing implementation of Industry 4.0 is a major driver for the SCADA market. By incorporating automation, IoT, and data-driven decision-making, SCADA systems enhance operational efficiency, minimize downtime, and optimize resource usage. Their capability to provide real-time process visibility makes them essential for smart factories and connected enterprises.
Restraint: Significant installation and maintenance costs associated with SCADA systems
One of the major restraints in the SCADA industry is the high capital investment required for installation and the ongoing maintenance cost. Advanced systems often demand specialized hardware, skilled professionals, and complex integration with existing infrastructure. This cost intensity discourages adoption, especially among small- and mid-sized enterprises with limited budgets.
Opportunity: Increasing implementation of SCADA systems across transportation, smart buildings, and agricultural sectors
Beyond traditional industries, SCADA increasingly finds applications in transportation, smart buildings, and agriculture. These sectors adopt SCADA to optimize energy use, automate operations, and improve system reliability. Expanding new verticals broadens the addressable market and strengthens SCADA's role as a versatile solution across diverse applications.
Challenge: Vulnerability of SCADA systems to cybersecurity threats
Cybersecurity is a significant challenge for SCADA systems, which oversee critical infrastructure such as power grids, water networks, and transportation systems. The increasing number of cyberattacks reveals vulnerabilities in older systems, making strong encryption, firewalls, and continuous monitoring essential. Neglecting these risks can lead to service disruptions and substantial financial losses.
SCADA Market: COMMERCIAL USE CASES ACROSS INDUSTRIES
| COMPANY | USE CASE DESCRIPTION | BENEFITS |
|---|---|---|
|
|
SIMATIC SCADA System, SIMATIC WinCC V7, SIMATIC HMI, and S7-1500 V Controller used across oil & gas, automotive, food & beverages, chemicals, power, and water industries for process visualization and control | Improved operational efficiency, real-time data insights, reduced downtime, and enhanced process automation |
|
|
EcoStruxure Geo SCADA Expert and ClearSCADA solutions for utilities, energy management, and water & wastewater sectors | Scalable architecture, remote monitoring, lower lifecycle costs, enhanced system reliability |
|
|
ABB Ability System 800xA and MicroSCADA X for power, oil & gas, and industrial manufacturing applications | Enhanced asset performance, reliable power distribution, improved safety and flexibility |
|
|
Ovation SCADA and DeltaV systems for process industries such as chemicals, pharmaceuticals, and power | Advanced process control, regulatory compliance, energy efficiency, and improved productivity |
|
|
FactoryTalk View SE SCADA platform for automotive, discrete manufacturing, and smart factory operations | Real-time visualization, predictive maintenance, higher equipment uptime, and reduced production losses |
Logos and trademarks shown above are the property of their respective owners. Their use here is for informational and illustrative purposes only.
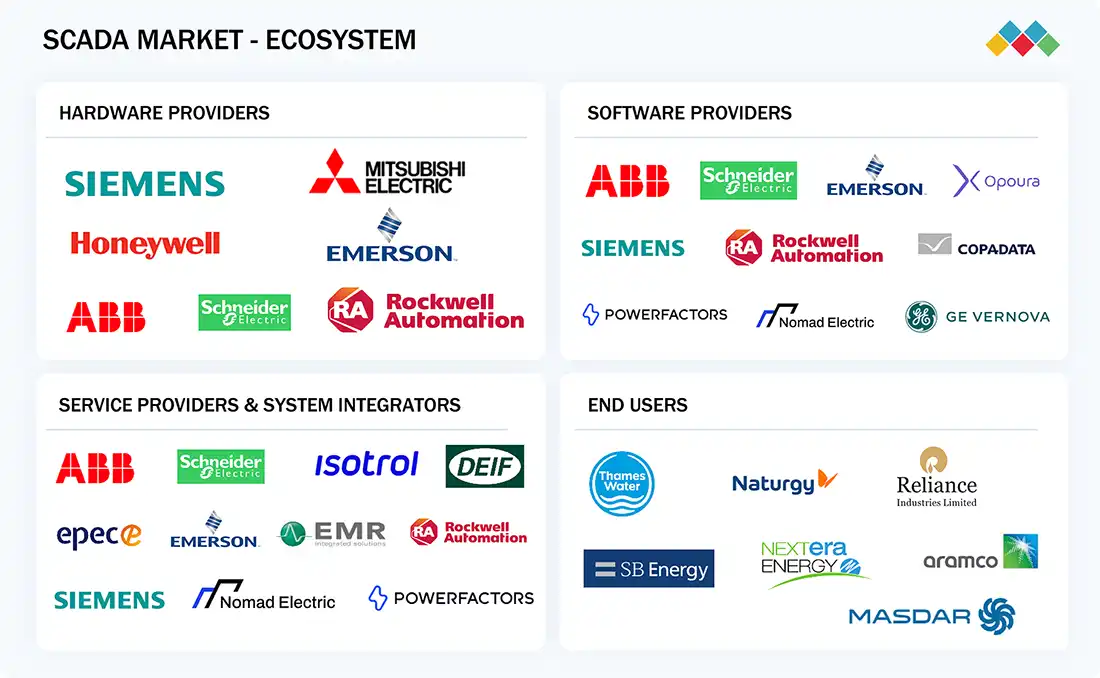
MARKET ECOSYSTEM
Key players operating in the SCADA companies are Rockwell Automation (US), Schneider Electric (France), ABB (Switzerland), Siemens (Germany), and Emerson Electric Co. (US). These companies not only boast a comprehensive product portfolio but also have a strong geographic footprint. Players in this market have adopted various growth strategies, including partnerships and expansions, to establish their foothold. The SCADA market ecosystem comprises multiple participants, each playing a vital role in designing, integrating, and deploying advanced supervisory control and data acquisition systems across industrial and infrastructure sectors worldwide.
Logos and trademarks shown above are the property of their respective owners. Their use here is for informational and illustrative purposes only.
MARKET SEGMENTS
Source: Secondary Research, Interviews with Experts, MarketsandMarkets Analysis
SCADA Market, By Offering
The services segment held the largest share in 2024, as installation, maintenance, system integration, and managed services are critical for effective SCADA deployment. Their role in ensuring seamless operation, cybersecurity, and scalability drives adoption across industries. Growing reliance on cloud-based SCADA platforms and increasing demand for remote monitoring further reinforce the dominance of services in the market.
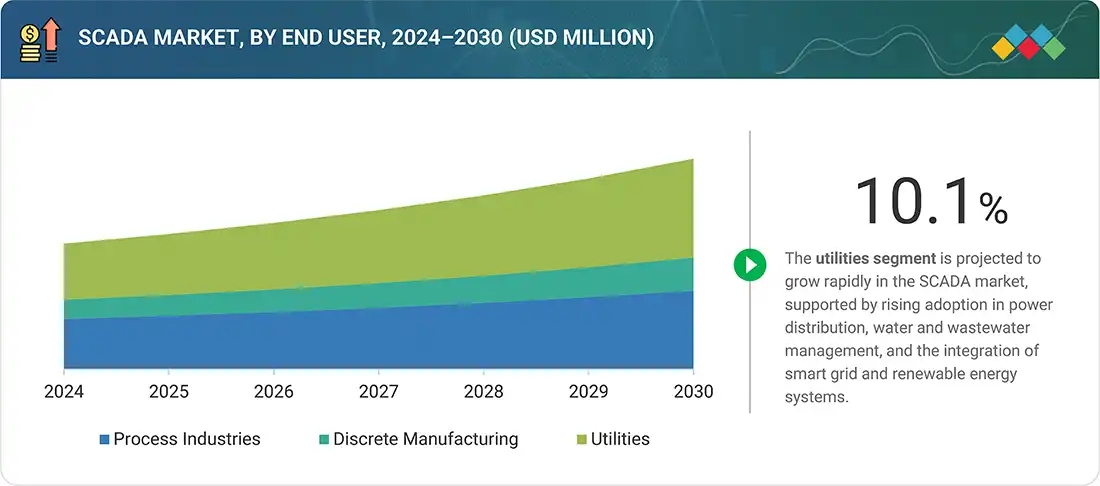
SCADA Market, By End User
The utilities segment accounted for the largest share in 2024, as SCADA systems are widely adopted in power generation, water and wastewater management, and transportation networks. Their ability to enhance grid reliability, optimize resource distribution, and support smart infrastructure initiatives drives strong demand. Increasing investments in renewable integration and modernizing utility infrastructure further reinforce the dominance of this segment.
REGION
Asia Pacific to be the fastest-growing region in the global SCADA market during the forecast period
The Asia Pacific region is projected to be the fastest-growing market for SCADA systems, fueled by rapid industrialization, the expansion of manufacturing and energy sectors, and an increasing adoption of automation technologies. Additionally, significant investments in smart infrastructure and the integration of IoT-enabled SCADA solutions in countries such as China, India, and Japan enhance the region's positive growth prospects.
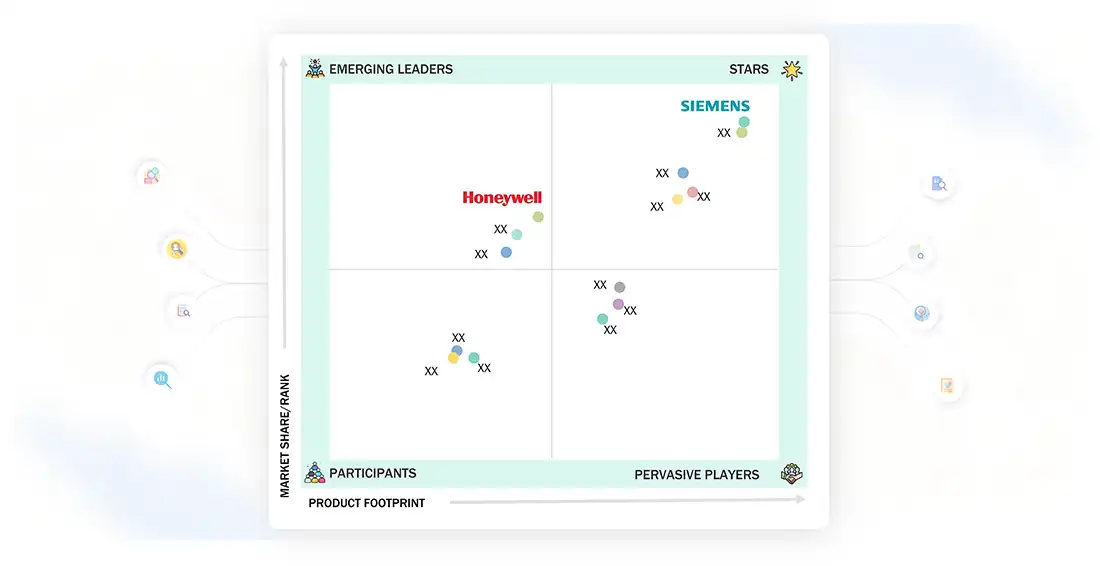
SCADA Market: COMPANY EVALUATION MATRIX
In the SCADA market matrix, Siemens (Star) leads with a strong market presence and a comprehensive portfolio of automation and control solutions, driving large-scale adoption across utilities, manufacturing, and energy sectors. Honeywell International Inc. (Emerging Leader) is gaining traction with advanced SCADA platforms that integrate IoT, cloud, and cybersecurity features. While Siemens dominates with scale and established industry reach, Honeywell shows strong growth potential to advance toward the leaders' quadrant.
Source: Secondary Research, Interviews with Experts, MarketsandMarkets Analysis
KEY MARKET PLAYERS
MARKET SCOPE
| REPORT METRIC | DETAILS |
|---|---|
| Market Size in 2024 (Value) | USD 11.96 Billion |
| Market Forecast in 2030 (Value) | USD 20.05 Billion |
| Growth Rate | CAGR of 9.2% from 2025 to 2030 |
| Years Considered | 2021–2030 |
| Base Year | 2024 |
| Forecast Period | 2025–2030 |
| Units Considered | Value (USD Thousand) and Volume (Thousand) |
| Report Coverage | Revenue Forecast, Company Ranking, Competitive Landscape, Growth Factors, and Trends |
| Segments Covered |
|
| Regional Scope | North America, Asia Pacific, Europe, the Middle East & Africa, and Latin America |
WHAT IS IN IT FOR YOU: SCADA Market REPORT CONTENT GUIDE
DELIVERED CUSTOMIZATIONS
We have successfully delivered the following deep-dive customizations:
| CLIENT REQUEST | CUSTOMIZATION DELIVERED | VALUE ADDS |
|---|---|---|
| Utility Operator (Power & Water) | Assessment of SCADA applications in power grids and water treatment, including ROI modeling for smart grid integration | Optimize vendor selection, justify investment in grid modernization, and strengthen long-term digital transformation strategies |
| Global SCADA System Provider | Detailed analysis of SCADA deployment in renewable projects across key regions - Forecast of SCADA-enabled smart grid integration by 2030 - Identification of cost-saving opportunities via real-time monitoring & predictive control |
|
| European Client – SME Mapping in Renewable Energy SCADA |
|
|
| Transportation & Smart City Authority | SCADA integration analysis for mass transit systems and urban infrastructure – Evaluation of communication protocol interoperability – Smart city SCADA adoption roadmaps |
|
RECENT DEVELOPMENTS
- April 2025 : Emerson Electric Co. launched DeltaV, a SaaS SCADA solution integrated with Edge Connect, designed to streamline SCADA architectures by securely linking field devices to the cloud within minutes. Built on PACEdge software, the solution supports native protocol communication, low-code customization, and strong cybersecurity features. This preconfigured edge device enables industrial operators to achieve real-time data visibility, enhanced operational flexibility, and seamless integration between IT and OT environments.
- February 2025 : Schneider Electric upgraded its SCADAPack 470i and 474i smart Remote Terminal Units (RTUs) to include advanced operational technology (OT) cybersecurity features. The enhancements consist of role-based access control (RBAC), integration with standard IT tools such as Active Directory, and support for secure communication protocols. These improvements aim to provide stronger, IT-aligned protection for critical infrastructure operating in remote and harsh environments.
- October 2024 : Rockwell Automation enhanced its FactoryTalk Optix (HMI and Data Platform) by integrating DataReady smart machines to support real-time machine-level visualization, seamless data transfer, and edge-to-cloud analytics. This product update is designed to improve operational efficiency by contextualizing data for enterprise applications, optimizing production workflows, and enabling smooth integration within Rockwell's ecosystem, including DataMosaix, Plex Smart Manufacturing Platform, and Fiix maintenance software.
- July 2024 : ABB partnered with China Machinery Engineering Corporation (CMEC) to automate the Al Dhafra PV2 Solar Project, the world's largest single-site solar plant in Abu Dhabi. The project utilizes ABB's Ability Symphony Plus system to improve plant efficiency and reliability, aligning with the UAE's Energy Strategy 2050. The 2 GW facility is designed to power 200,000 homes and reduce CO2 emissions by 2.4 million metric tons annually.
- February 2024 : Emerson Electric Co. launched the PACSystems IPC 2010 Compact Industrial PC (IPC), a rugged, space-saving solution designed for machine and discrete part manufacturing environments. Built to support Industrial Internet of Things (IIoT) applications, the compact IPC offers reliable performance for automation tasks in manufacturing facilities and OEM machine builders. The product enables cost-effective digital transformation by providing a resilient platform for industrial control, data processing, and connectivity in space-constrained settings.
Table of Contents
 Exclusive indicates content/data unique to MarketsandMarkets and not available with any competitors.
Methodology
The study involved four main activities to estimate the current size of the SCADA market. Extensive secondary research was conducted to gather information on the market, related markets, and the overall SCADA landscape. These findings, along with assumptions and projections, were validated through primary research involving interviews with industry experts and key stakeholders across the value chain. Both top-down and bottom-up approaches were used to estimate the total market size. Then, market breakdown and data triangulation techniques were applied to determine the sizes of various segments and subsegments. Two key sources, secondary and primary, were relied upon to conduct a comprehensive technical and commercial assessment of the SCADA market.
Secondary Research
Various secondary sources have been consulted during the research process to gather important information for this study. These sources include annual reports, press releases, investor presentations, white papers, journals, certified publications, and articles from recognized authors, websites, directories, and databases. The secondary research aimed to gather key details about the industry’s supply chain, the market’s value chain, the main players, market segmentation based on industry trends (down to the most detailed level), regional markets, and significant developments from market and technology perspectives. The collected secondary data was analyzed to determine the overall market size, which was further validated through primary research.
Primary Research
Extensive primary research was conducted after gathering knowledge about the current SCADA market situation through secondary research. Several primary interviews were carried out with experts from the demand and supply sides across four major regions—North America, Europe, Asia Pacific, and RoW. This primary data was collected through questionnaires, emails, and telephonic interviews.

Note: Other designations include sales and product managers and project engineers. The three tiers of the companies are defined based on their total revenue in 2024: Tier 1 - revenue greater than or equal to USD 1 billion; Tier 2 - revenue between USD 100 million and USD 1 billion; and Tier 3 revenue less than or equal to USD 100 million.
To know about the assumptions considered for the study, download the pdf brochure
Market Size Estimation
Both, the top-down and bottom-up approaches have been used to estimate and validate the total size of the SCADA market. These methods have also been extensively employed to determine the size of various subsegments within the market. The following research methodology has been used to estimate the market size:
- Major players in the industry and markets have been identified through extensive secondary research.
- The industry’s value chain and market size (in terms of value) have been determined through primary and secondary research processes.
- All percentage shares, splits, and breakdowns have been determined using secondary sources and verified through primary sources.
SCADA Market : Top-Down and Bottom-Up Approach

Data Triangulation
After arriving at the overall size of the SCADA market from the market size estimation process explained above, the total market has been split into several segments and subsegments. Data triangulation and market breakdown procedures have been employed, wherever applicable, to complete the overall market engineering process and arrive at the exact statistics for all segments and subsegments of the market. The data has been triangulated by studying various factors and trends from both the demand and supply sides. Along with this, the market size has been validated using both top-down and bottom-up approaches.
Market Definition
The SCADA (Supervisory Control and Data Acquisition) market comprises integrated hardware and software systems designed to monitor, control, and optimize industrial and infrastructure operations through real-time data acquisition and centralized supervision. These solutions are widely deployed across process industries such as oil and gas, chemicals, pharmaceuticals, food and beverage; discrete manufacturing sectors including automotive, semiconductor, and electronics; and utility segments encompassing power, water and wastewater treatment, telecommunications, and transportation. SCADA systems utilize components such as programmable logic controllers (PLCs), remote terminal units (RTUs), and human-machine interfaces (HMIs), and are increasingly supported by technologies like Industrial IoT, cloud platforms, and advanced analytics. With rising emphasis on automation, infrastructure resilience, and secure data communication, SCADA plays a vital role in enhancing operational efficiency, enabling predictive maintenance, and supporting the digital transformation of industrial and utility ecosystems.
The market includes first-level packaged MEMS devices (sensors and actuators) sold by IDMs and fabless companies to OEMs/integrators.
Key Stakeholders
- Application providers
- Automation consultants
- Integrators of automation systems
- Distributors and providers of SCADA
- Companies developing and integrating industrial software
- Companies providing industrial control systems (ICS) cybersecurity
- Vendors of SCADA software package
- Suppliers of SCADA components
- Providers of professional services/solutions
- Research organizations and consulting companies
- Technology investors
- Technology standards organizations, forums, alliances, and associations
Report Objectives
- To define, describe and forecast the SCADA market, in terms of offering, end user and region.
- To describe and forecast the market, in terms of value, with regard to four main regions: North America, Europe, Asia Pacific, and Rest of the World (RoW) along with their respective countries
- To provide detailed information regarding major factors influencing the market growth (drivers, restraints, opportunities, and challenges)
- To provide a detailed overview of the value chain of SCADA market.
- To strategically analyze micromarkets with respect to individual growth trends, prospects, and contributions to the SCADA market
- To analyze opportunities in the market for stakeholders by identifying high-growth segments of the SCADA market.
- To strategically profile key players and comprehensively analyze their market position in terms of ranking and core competencies, along with detailing the competitive landscape for market leaders
- To analyze competitive strategies, such as product launches, expansions, mergers and acquisitions, adopted by key market players in the SCADA market.
Available customizations:
With the given market data, MarketsandMarkets offers customizations according to the company’s specific needs. The following customization options are available for the report:
Company Information:
- Detailed analysis and profiling of additional market players (up to 5)
Key Questions Addressed by the Report
What is the total CAGR expected to be recorded for the SCADA market during 2025–2030?
The global SCADA Market is expected to record a CAGR of 9.2% from 2025 to 2030.
What are the driving factors for the SCADA market?
The SCADA market is fueled by the growing need for real-time monitoring, automation, and centralized control in vital sectors like power, water and wastewater, oil and gas, and manufacturing. The expansion of smart infrastructure projects, the integration of renewable energy, and digital transformation efforts are speeding up SCADA adoption worldwide. Advances in IoT, cloud computing, and AI are improving the scalability, intelligence, and responsiveness of SCADA systems. Moreover, increasing focus on operational efficiency, predictive maintenance, and cybersecurity compliance is strengthening the demand for sophisticated SCADA platforms. As industries emphasize connected and resilient infrastructure, SCADA systems are becoming crucial for data-driven decision-making and maintaining long-term operational continuity.
What is the impact of AI on the SCADA market?
Artificial Intelligence (AI) is transforming the SCADA market by enabling smarter, faster, and more autonomous industrial operations. AI-powered SCADA systems improve real-time data analysis, detect anomalies, and predict equipment failures, allowing for proactive maintenance and reduced downtime. By utilizing machine learning algorithms, these systems can recognize patterns and optimize control strategies across complex processes in sectors such as energy, water, oil and gas, and manufacturing. Additionally, AI enhances decision-making by providing actionable insights through advanced analytics and visualizations. This results in increased operational efficiency, better resource utilization, and improved safety. As industries move forward with digital transformation, integrating AI into SCADA is becoming essential for creating resilient, adaptive, and intelligent control systems.
Which are the significant players operating in the SCADA Market?
Rockwell Automation (US), ABB (Switzerland), Schneider Electric (France), Emerson Electric Co. (US), and Siemens (Germany) are some of the major companies operating in the SCADA Market.
Which region offers lucrative growth potential for the SCADA market by 2030?
During the projected period, Asia Pacific is expected to offer lucrative opportunities in the SCADA market.
Need a Tailored Report?
Customize this report to your needs
Get 10% FREE Customization
Customize This ReportPersonalize This Research
- Triangulate with your Own Data
- Get Data as per your Format and Definition
- Gain a Deeper Dive on a Specific Application, Geography, Customer or Competitor
- Any level of Personalization
Let Us Help You
- What are the Known and Unknown Adjacencies Impacting the SCADA Market
- What will your New Revenue Sources be?
- Who will be your Top Customer; what will make them switch?
- Defend your Market Share or Win Competitors
- Get a Scorecard for Target Partners

Custom Market Research Services
We Will Customise The Research For You, In Case The Report Listed Above Does Not Meet With Your Requirements
Get 10% Free CustomisationGrowth opportunities and latent adjacency in SCADA Market


Lynda
Aug, 2022
"Benchmarking the rapid strategy shifts of the Top 100 companies in the SCADA Market - on pricing and sales/revenue." Need special pricing on SCADA for companies in this industry..