Revenue Assurance Market by Component (Software and Services), End-User (TSPs, and Enterprises), Deployment Mode (Cloud and On-premises), Vertical (Telecom, Utilities, BFSI, Hospitality, and Others), and Region - Global Forecast to 2025


Revenue Assurance Market Growth & Trends
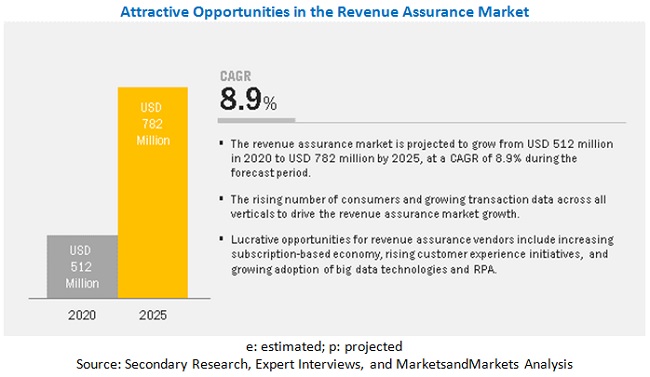
The global Revenue Assurance Market size was valued at $512 million in 2020 and it is projected to reach $782 million by the end of 2025 at a CAGR of 8.9% during the forecast period. Revenue assurance includes the major factors driving the growth are the rise in the internet penetration, an increase in the generation of transaction data, development of SMEs offering digital solutions for service delivery, increase in subscription-based business models, and adoption of advanced technologies, such as big data, ML, and IoT.
Revenue Assurance Market Dynamics
Latest Trends
Based on services, the revenue assurance market is segment into planning and consulting, implementation and customization, support and maintenance, and managed services. Companies that lack in-house capabilities for revenue assurance of an organization outsource the functionality from expert Managed Service Providers (MSPs). Owing to the high costs and resource constraints, organizations are expected to increase their demand for revenue assurance managed services
Technology Insights
Based on the deployment model, the cloud segment is expected to grow at a higher CAGR during the forecast period. The rising adoption of revenue assurance solutions among small and mid-scale businesses is leading to a significant rise in the cloud-based deployment of revenue assurance solutions. These businesses lack resources and capital to invest in physical servers and IT resources to support locally hosted solutions, hence cloud-based revenue assurance solutions are preferred.
End-Use Insights
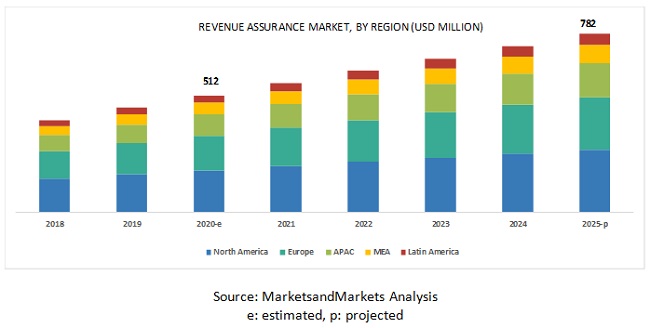
North America consists of developed countries with well-established infrastructures, ISPs, and CSPs that generate a huge demand for revenue assurance solutions in the region. Countries that contribute the most to the market in North America include the US and Canada; the reason for the dominance of these countries is their well-established economies, which enable notable investments in new technologies, such as 5G and virtualization of networks. The rise in subscription-based data, presence of major revenue assurance vendors, and enhanced telecom network infrastructure are other major factors that influence the adoption of the revenue assurance solutions in the region.
Top Companies in Revenue Assurance Market
Top companies in revenue assurance market report include Amdocs (US), Araxxe Inc. (US), Adapt IT (South Africa), Cartesian (US), Digital Route (Sweden), eClerx (India), HPE (US) Itron (US), Nokia (Finland), Profit Insight (US), Sagacity Solutions (UK), Sandvine (Canada), Sigos (Germany), Subex (India), Synthesis Systems (US), TCS (India), Teoco (US), Transunion, (US), and WeDo (Portugal), and Xintec (Ireland).. These players have adopted various growth strategies, such as partnerships and new service launches, to expand their presence further in the MEA WaaS market and broaden their customer base.
Subex is an India-based revenue assurance solution provider, founded in 1994 Subex was founded in 1992 and is headquartered in Karnataka, India. It is a leading global telecom analytics solutions provider. The company caters to TSPs by offering them services for optimizing their revenue models and support their transformation from communications service providers into digital enterprises. The company has a global presence of North America, the UK, and APAC. In the revenue assurance market, Subex offers the Revenue Assurance Center (ROC) platform to focus on monitoring and monetizing content-based services with capabilities to enhance the usability and value of automated RA technology. As components of the ROC platform for RA, Subex provides the Dynamic Network Analytics (DNA) auto-configuration solution, RevenuePad enterprise-wide RA command center through visual RA, and Zen the virtual analyst for RA to provide solutions for the root cause of revenue leakages.
Revenue Assurance Market Report Scope
|
Report Metrics |
Details |
|
Revenue forecast in 2025 |
USD 782 Million |
|
Market size value in 2020 |
USD 512 Million |
|
Market Growth Rate |
8.9% CAGR |
|
Market size available for years |
2018-2025 |
|
Base year considered |
2019 |
|
Forecast period |
2020-2025 |
|
Forecast units |
Value (USD Million) |
|
Segments covered |
Component, Solution, Deployment Mode, End User, Vertical and Region |
|
Country covered |
North America, Europe, APAC, MEA, and Latin America |
|
Companies covered |
Amdocs (US), Araxxe Inc. (US), Adapt IT (South Africa), Cartesian (US), Digital Route (Sweden), eClerx (India), HPE (US) Itron (US), Nokia (Finland), Profit Insight (US), Sagacity Solutions (UK), Sandvine (Canada), Sigos (Germany), Subex (India), Synthesis Systems (US), TCS (India), Teoco (US), Transunion, (US), and WeDo (Portugal), and Xintec (Ireland) |
This research report categorizes the revenue assurance market to forecast revenue and analyze trends in each of the following submarkets:
Based on the component:
- Software
- Services
- Planning and Consulting
- Implementation and Customization
- Support and Maintenance
- Managed Services
Based on Deployment Mode:
- Cloud
- On-premises
Based on End User:
- TSPs
- Enterprises
Based on Verticals:
- Telecom
- Utilities
- BFSI
- Hospitality
- Others (logistics, aviation, healthcare, eCommerce and retail)
Based on Region:
-
North America
- US
- Canada
-
Europe
- UK
- Germany
- Rest of Europe
-
APAC
- China
- India
- Rest of APAC
-
MEA
- Middle East
- Africa
-
Latin America
- Brazil
- Mexico
- Rest of Latin America
Recent Developments
- In January 2020, Subex partnered with Jawwal, a Palestine based MNO to offer its ROC RA platform while extending the partnership for the next five years. The partnership involves the implementation of the ROC revenue assurance platform, enabling Jawwal to cover its recently launched digital services along with optimizing revenue streams and reduce risks.
- In August 2018, Subex partnered with Türk Telekom, a Turkey-based telecom operator for providing its ROC RA platform, while extending the partnership for the next five years. The partnership involves upgrading the existing Moneta deployments to ROC Revenue Assurance v6 platform and utilize the myriad of capabilities, such as Hadoop architecture, ML, and processing of more than 30B CDRs per day.
- In May 2018, Amdocs partnered with Safaricom, a Kenya-based MNO. The partnership helped Safaricom for the launch of its innovative digital services that aimed to meet the 29.5 million customers, by utilizing Amdocs assurance technology and expertise. The partnership will also safeguard the comprehensive and adaptive revenues for the entire lifecycle of new services.
Frequently Asked Questions (FAQ):
What is the growth of Revenue Assurance Market?
What is the growth rate of Revenue Assurance Market in next 5 years?
What region holds the highest market share in the Revenue Assurance market?
What are the major components in the Revenue Assurance market?
What are the key vendors in the Revenue Assurance market?
To speak to our analyst for a discussion on the above findings, click Speak to Analyst
 Exclusive indicates content/data unique to MarketsandMarkets and not available with any competitors.
TABLE OF CONTENTS
1 INTRODUCTION (Page No. - 16)
1.1 OBJECTIVES OF THE STUDY
1.2 MARKET DEFINITION
1.2.1 INCLUSIONS AND EXCLUSIONS
1.3 MARKET SCOPE
1.3.1 MARKET SEGMENTATION
1.3.2 REGIONS COVERED
1.4 YEARS CONSIDERED FOR THE STUDY
1.5 CURRENCY CONSIDERED
1.6 STAKEHOLDERS
2 RESEARCH METHODOLOGY (Page No. - 20)
2.1 RESEARCH DATA
2.1.1 SECONDARY DATA
2.1.2 PRIMARY DATA
2.1.2.1 Breakup of primary profiles
2.1.2.2 Key industry insights
2.2 MARKET BREAKUP AND DATA TRIANGULATION
2.3 MARKET SIZE ESTIMATION
2.4 MARKET FORECAST
2.5 RESEARCH ASSUMPTIONS AND LIMITATIONS
2.5.1 ASSUMPTIONS FOR THE STUDY
2.5.2 LIMITATIONS OF THE STUDY
3 EXECUTIVE SUMMARY (Page No. - 28)
4 PREMIUM INSIGHTS (Page No. - 31)
4.1 ATTRACTIVE OPPORTUNITIES IN THE MARKET
4.2 REVENUE ASSURANCE MARKET IN ASIA PACIFIC, BY COMPONENT AND COUNTRY
4.3 MARKET SHARE, BY VERTICAL
5 MARKET OVERVIEW AND INDUSTRY TRENDS (Page No. - 33)
5.1 MARKET OVERVIEW
5.2 MARKET DYNAMICS
5.2.1 DRIVERS
5.2.1.1 Rise in the use of subscription-based economy
5.2.1.2 Rising focus of businesses on enhancing customer experience
5.2.1.3 Need for automation solutions for revenue assurance: RPA
5.2.2 RESTRAINTS
5.2.2.1 Dependency on human-led services for market development
5.2.3 OPPORTUNITIES
5.2.3.1 Rising adoption of BDT
5.2.3.2 Rising demand for innovative payment services: Telco-OTT partnerships
5.2.4 CHALLENGES
5.2.4.1 Rising demand for business assurance solutions
5.2.4.2 Economic slowdown: Outbreak of Coronavirus
5.3 USE CASES
5.3.1 USE CASE 1: CENTRALIZED REVENUE ASSURANCE
5.3.2 USE CASE 2: BILLING AUTOMATION
5.3.3 USE CASE 3: REVENUE LEAKAGE IDENTIFICATION
5.4 INDUSTRY TRENDS
5.5 REGULATORY LANDSCAPE
5.5.1 HEALTH INSURANCE PORTABILITY AND ACCOUNTABILITY ACT
5.5.2 CALIFORNIA CONSUMER PRIVACY ACT
5.5.3 GENERAL DATA PROTECTION REGULATION
5.5.4 GRAMM–LEACH–BLILEY ACT
6 REVENUE ASSURANCE MARKET, BY COMPONENT (Page No. - 41)
6.1 INTRODUCTION
6.2 SOFTWARE
6.2.1 SOFTWARE: MARKET DRIVERS
6.3 SERVICES
6.3.1 PLANNING AND CONSULTING
6.3.1.1 PLANNING AND CONSULTING: MARKET DRIVERS
6.3.2 IMPLEMENTATION AND CUSTOMIZATION
6.3.2.1 IMPLEMENTATION AND CUSTOMIZATION: MARKET DRIVERS
6.3.3 SUPPORT AND MAINTENANCE
6.3.3.1 SUPPORT AND MAINTENANCE: MARKET DRIVERS
6.3.4 MANAGED SERVICES
6.3.4.1 MANAGED SERVICES: MARKET DRIVERS
7 REVENUE ASSURANCE MARKET, BY SOLUTION (Page No. - 49)
7.1 INTRODUCTION
7.2 MIGRATION ASSURANCE
7.3 USAGE ASSURANCE
7.4 PROVISIONING ASSURANCE
7.5 BILLING AND RATING VALIDATION
7.6 ROAMING AND INTERCONNECT PARTNER ASSURANCE
8 REVENUE ASSURANCE MARKET, BY DEPLOYMENT MODE (Page No. - 51)
8.1 INTRODUCTION
8.2 CLOUD
8.2.1 CLOUD: MARKET DRIVERS
8.3 ON-PREMISES
8.3.1 ON-PREMISES: MARKET DRIVERS
9 REVENUE ASSURANCE MARKET, BY END USER (Page No. - 55)
9.1 INTRODUCTION
9.2 TELECOMMUNICATION SERVICE PROVIDERS
9.2.1 TELECOMMUNICATION SERVICE PROVIDERS: MARKET DRIVERS
9.3 ENTERPRISES
9.3.1 ENTERPRISES: MARKET DRIVERS
10 REVENUE ASSURANCE MARKET, BY VERTICAL (Page No. - 59)
10.1 INTRODUCTION
10.2 TELECOM
10.3 UTILITIES
10.4 BANKING, FINANCIAL SERVICES AND INSURANCE
10.5 HOSPITALITY
10.6 OTHERS
11 REVENUE ASSURANCE MARKET, BY REGION (Page No. - 66)
11.1 INTRODUCTION
11.2 NORTH AMERICA
11.2.1 UNITED STATES
11.2.2 CANADA
11.3 EUROPE
11.3.1 UNITED KINGDOM
11.3.2 GERMANY
11.3.3 REST OF EUROPE
11.4 ASIA PACIFIC
11.4.1 CHINA
11.4.2 INDIA
11.4.3 REST OF ASIA PACIFIC
11.5 MIDDLE EAST AND AFRICA
11.5.1 MIDDLE EAST
11.5.2 AFRICA
11.6 LATIN AMERICA
11.6.1 BRAZIL
11.6.2 MEXICO
11.6.3 EST OF LATIN AMERICA
12 COMPETITIVE LANDSCAPE (Page No. - 107)
12.1 OVERVIEW
12.2 COMPETITIVE SCENARIO
12.2.1 PARTNERSHIPS
12.2.2 ACQUISITIONS
13 COMPANY PROFILES (Page No. - 110)
13.1 INTRODUCTION
(Business Overview, Products, Solutions & Services, Key Insights, Recent Developments, SWOT Analysis, MnM View)*
13.2 AMDOCS
13.3 TCS
13.4 NOKIA
13.5 SUBEX
13.6 WEDO
13.7 HPE
13.8 ITRON
13.9 CARTESIAN
13.10 TEOCO
13.11 XINTEC
13.12 TRANSUNION
13.13 SANDVINE
13.14 ARAXXE
13.15 SIGOS
13.16 SAGACITY SOLUTIONS
13.17 DIGITAL ROUTE
13.18 SYNTHESIS SYSTEMS
13.19 ADAPT IT
13.20 PROFIT INSIGHT
13.21 ECLERX
*Details on Business Overview, Products, Solutions & Services, Key Insights, Recent Developments, SWOT Analysis, MnM View might not be captured in case of unlisted companies.
14 APPENDIX (Page No. - 136)
14.1 DISCUSSION GUIDE
14.2 KNOWLEDGE STORE: MARKETSANDMARKETS’ SUBSCRIPTION PORTAL
14.3 AVAILABLE CUSTOMIZATIONS
14.4 RELATED REPORTS
14.5 AUTHOR DETAILS
LIST OF TABLES (106 Tables)
TABLE 1 UNITED STATES DOLLAR EXCHANGE RATE, 2016–2019
TABLE 2 FACTOR ANALYSIS
TABLE 3 REVENUE ASSURANCE MARKET SIZE, GLOBAL, 2018–2025 (USD MILLION)
TABLE 4 MARKET SIZE, BY COMPONENT, 2018–2025 (USD MILLION)
TABLE 5 SOFTWARE: MARKET SIZE, BY REGION, 2018–2025 (USD MILLION)
TABLE 6 SERVICES: MARKET SIZE, BY REGION, 2018–2025 (USD MILLION)
TABLE 7 SERVICES: MARKET SIZE, BY TYPE, 2018–2025 (USD MILLION)
TABLE 8 PLANNING AND CONSULTING MARKET SIZE, BY REGION, 2018–2025 (USD MILLION)
TABLE 9 IMPLEMENTATION AND CUSTOMIZATION MARKET SIZE, BY REGION, 2018–2025 (USD MILLION)
TABLE 10 SUPPORT AND MAINTENANCE MARKET SIZE, BY REGION, 2018–2025 (USD MILLION)
TABLE 11 MANAGED SERVICES MARKET SIZE, BY REGION, 2018–2025 (USD MILLION)
TABLE 12 REVENUE ASSURANCE MARKET SIZE, BY DEPLOYMENT MODE, 2018–2025 (USD MILLION)
TABLE 13 CLOUD: MARKET SIZE, BY REGION, 2018–2025 (USD MILLION)
TABLE 14 ON-PREMISES: MARKET SIZE, BY REGION, 2018–2025 (USD MILLION)
TABLE 15 MARKET SIZE, BY END USER, 2018–2025 (USD MILLION)
TABLE 16 TELECOMMUNICATION SERVICE PROVIDERS: MARKET SIZE, BY REGION, 2018–2025 (USD MILLION)
TABLE 17 ENTERPRISES: MARKET SIZE, BY REGION, 2018–2025 (USD MILLION)
TABLE 18 REVENUE ASSURANCE MARKET SIZE, BY VERTICAL, 2018–2025 (USD MILLION)
TABLE 19 TELECOM: MARKET SIZE, BY REGION, 2018–2025 (USD MILLION)
TABLE 20 UTILITIES: MARKET SIZE, BY REGION, 2018–2025 (USD MILLION)
TABLE 21 BANKING, FINANCIAL SERVICES AND INSURANCE: MARKET SIZE, BY REGION, 2018–2025 (USD MILLION)
TABLE 22 HOSPITALITY: MARKET SIZE, BY REGION, 2018–2025 (USD MILLION)
TABLE 23 OTHERS: MARKET SIZE, BY REGION, 2018–2025 (USD MILLION)
TABLE 24 REVENUE ASSURANCE MARKET SIZE, BY REGION, 2018–2025 (USD MILLION)
TABLE 25 NORTH AMERICA: MARKET SIZE, BY VERTICAL, 2018–2025 (USD MILLION)
TABLE 26 NORTH AMERICA: MARKET SIZE, BY COMPONENT, 2018–2025 (USD MILLION)
TABLE 27 NORTH AMERICA: MARKET SIZE, BY SERVICE, 2018–2025 (USD MILLION)
TABLE 28 NORTH AMERICA: MARKET SIZE, BY DEPLOYMENT MODE, 2018–2025 (USD MILLION)
TABLE 29 NORTH AMERICA: MARKET SIZE, BY END USER, 2018–2025 (USD MILLION)
TABLE 30 NORTH AMERICA: MARKET SIZE, BY COUNTRY, 2018–2025 (USD MILLION)
TABLE 31 UNITED STATES: REVENUE ASSURANCE MARKET SIZE, BY VERTICAL, 2018–2025 (USD MILLION)
TABLE 32 UNITED STATES: MARKET SIZE, BY COMPONENT, 2018–2025 (USD MILLION)
TABLE 33 UNITED STATES: MARKET SIZE, BY SERVICE, 2018–2025 (USD MILLION)
TABLE 34 UNITED STATES: MARKET SIZE, BY DEPLOYMENT MODE, 2018–2025 (USD MILLION)
TABLE 35 UNITED STATES: MARKET SIZE, BY END USER, 2018–2025 (USD MILLION)
TABLE 36 CANADA: MARKET SIZE, BY VERTICAL, 2018–2025 (USD MILLION)
TABLE 37 CANADA: MARKET SIZE, BY COMPONENT, 2018–2025 (USD MILLION)
TABLE 38 CANADA: MARKET SIZE, BY SERVICE, 2018–2025 (USD MILLION)
TABLE 39 CANADA: MARKET SIZE, BY DEPLOYMENT MODE, 2018–2025 (USD MILLION)
TABLE 40 CANADA: MARKET SIZE, BY END USER, 2018–2025 (USD MILLION)
TABLE 41 EUROPE: REVENUE ASSURANCE MARKET SIZE, BY VERTICAL, 2018–2025 (USD MILLION)
TABLE 42 EUROPE: MARKET SIZE, BY COMPONENT, 2018–2025 (USD MILLION)
TABLE 43 EUROPE: MARKET SIZE, BY SERVICE, 2018–2025 (USD MILLION)
TABLE 44 EUROPE: MARKET SIZE, BY DEPLOYMENT MODE, 2018–2025 (USD MILLION)
TABLE 45 EUROPE: MARKET SIZE, BY END USER, 2018–2025 (USD MILLION)
TABLE 46 EUROPE: MARKET SIZE, BY COUNTRY, 2018–2025 (USD MILLION)
TABLE 47 UNITED KINGDOM: MARKET SIZE, BY VERTICAL, 2018–2025 (USD MILLION)
TABLE 48 UNITED KINGDOM: MARKET SIZE, BY COMPONENT, 2018–2025 (USD MILLION)
TABLE 49 UNITED KINGDOM: MARKET SIZE, BY SERVICE, 2018–2025 (USD MILLION)
TABLE 50 UNITED KINGDOM: MARKET SIZE, BY DEPLOYMENT MODE, 2018–2025 (USD MILLION)
TABLE 51 UNITED KINGDOM: MARKET SIZE, BY END USER, 2018–2025 (USD MILLION)
TABLE 52 GERMANY: MARKET SIZE, BY VERTICAL, 2018–2025 (USD MILLION)
TABLE 53 GERMANY: MARKET SIZE, BY COMPONENT, 2018–2025 (USD MILLION)
TABLE 54 GERMANY: MARKET SIZE, BY SERVICE, 2018–2025 (USD MILLION)
TABLE 55 GERMANY: MARKET SIZE, BY DEPLOYMENT MODE, 2018–2025 (USD MILLION)
TABLE 56 GERMANY: MARKET SIZE, BY END USER, 2018–2025 (USD MILLION)
TABLE 57 ASIA PACIFIC: REVENUE ASSURANCE MARKET SIZE, BY VERTICAL, 2018–2025 (USD MILLION)
TABLE 58 ASIA PACIFIC: MARKET SIZE, BY COMPONENT, 2018–2025 (USD MILLION)
TABLE 59 ASIA PACIFIC: MARKET SIZE, BY SERVICE, 2018–2025 (USD MILLION)
TABLE 60 ASIA PACIFIC: MARKET SIZE, BY DEPLOYMENT MODE, 2018–2025 (USD MILLION)
TABLE 61 ASIA PACIFIC: MARKET SIZE, BY END USER, 2018–2025 (USD MILLION)
TABLE 62 ASIA PACIFIC: MARKET SIZE, BY COUNTRY, 2018–2025 (USD MILLION)
TABLE 63 CHINA: MARKET SIZE, BY VERTICAL, 2018–2025 (USD MILLION)
TABLE 64 CHINA: MARKET SIZE, BY COMPONENT, 2018–2025 (USD MILLION)
TABLE 65 CHINA: MARKET SIZE, BY SERVICE, 2018–2025 (USD MILLION)
TABLE 66 CHINA: MARKET SIZE, BY DEPLOYMENT MODE, 2018–2025 (USD MILLION)
TABLE 67 CHINA: MARKET SIZE, BY END USER, 2018–2025 (USD MILLION)
TABLE 68 INDIA: MARKET SIZE, BY VERTICAL, 2018–2025 (USD MILLION)
TABLE 69 INDIA: MARKET SIZE, BY COMPONENT, 2018–2025 (USD MILLION)
TABLE 70 INDIA: MARKET SIZE, BY SERVICE, 2018–2025 (USD MILLION)
TABLE 71 INDIA: MARKET SIZE, BY DEPLOYMENT MODE, 2018–2025 (USD MILLION)
TABLE 72 INDIA: MARKET SIZE, BY END USER, 2018–2025 (USD MILLION)
TABLE 73 MIDDLE EAST AND AFRICA: REVENUE ASSURANCE MARKET SIZE, BY VERTICAL, 2018–2025 (USD MILLION)
TABLE 74 MIDDLE EAST AND AFRICA: MARKET SIZE, BY COMPONENT, 2018–2025 (USD MILLION)
TABLE 75 MIDDLE EAST AND AFRICA: MARKET SIZE, BY SERVICE, 2018–2025 (USD MILLION)
TABLE 76 MIDDLE EAST AND AFRICA: MARKET SIZE, BY DEPLOYMENT MODE, 2018–2025 (USD MILLION)
TABLE 77 MIDDLE EAST AND AFRICA: MARKET SIZE, BY END USER, 2018–2025 (USD MILLION)
TABLE 78 MIDDLE EAST AND AFRICA: MARKET SIZE, BY COUNTRY, 2018–2025 (USD MILLION)
TABLE 79 MIDDLE EAST: MARKET SIZE, BY VERTICAL, 2018–2025 (USD MILLION)
TABLE 80 MIDDLE EAST: MARKET SIZE, BY COMPONENT, 2018–2025 (USD MILLION)
TABLE 81 MIDDLE EAST: MARKET SIZE, BY SERVICE, 2018–2025 (USD MILLION)
TABLE 82 MIDDLE EAST: MARKET SIZE, BY DEPLOYMENT MODE, 2018–2025 (USD MILLION)
TABLE 83 MIDDLE EAST: MARKET SIZE, BY END USER, 2018–2025 (USD MILLION)
TABLE 84 AFRICA: REVENUE ASSURANCE MARKET SIZE, BY VERTICAL, 2018–2025 (USD MILLION)
TABLE 85 AFRICA: MARKET SIZE, BY COMPONENT, 2018–2025 (USD MILLION)
TABLE 86 AFRICA: MARKET SIZE, BY SERVICE, 2018–2025 (USD MILLION)
TABLE 87 AFRICA: MARKET SIZE, BY DEPLOYMENT MODE, 2018–2025 (USD MILLION)
TABLE 88 AFRICA: MARKET SIZE, BY END USER, 2018–2025 (USD MILLION)
TABLE 89 LATIN AMERICA: REVENUE ASSURANCE MARKET SIZE, BY COUNTRY, 2018–2025 (USD MILLION)
TABLE 90 LATIN AMERICA: MARKET SIZE, BY VERTICAL, 2018–2025 (USD MILLION)
TABLE 91 LATIN AMERICA: MARKET SIZE, BY COMPONENT, 2018–2025 (USD MILLION)
TABLE 92 LATIN AMERICA: MARKET SIZE, BY SERVICE, 2018–2025 (USD MILLION)
TABLE 93 LATIN AMERICA: MARKET SIZE, BY DEPLOYMENT MODE, 2018–2025 (USD MILLION)
TABLE 94 LATIN AMERICA: MARKET SIZE, BY END USER, 2018–2025 (USD MILLION)
TABLE 95 BRAZIL: MARKET SIZE, BY VERTICAL, 2018–2025 (USD MILLION)
TABLE 96 BRAZIL: MARKET SIZE, BY COMPONENT, 2018–2025 (USD MILLION)
TABLE 97 BRAZIL: MARKET SIZE, BY SERVICE, 2018–2025 (USD MILLION)
TABLE 98 BRAZIL: MARKET SIZE, BY DEPLOYMENT MODE, 2018–2025 (USD MILLION)
TABLE 99 BRAZIL: MARKET SIZE, BY END USER, 2018–2025 (USD MILLION)
TABLE 100 MEXICO: MARKET SIZE, BY VERTICAL, 2018–2025 (USD MILLION)
TABLE 101 MEXICO: MARKET SIZE, BY COMPONENT, 2018–2025 (USD MILLION)
TABLE 102 MEXICO: MARKET SIZE, BY SERVICE, 2018–2025 (USD MILLION)
TABLE 103 MEXICO: MARKET SIZE, BY DEPLOYMENT MODE, 2018–2025 (USD MILLION)
TABLE 104 MEXICO: MARKET SIZE, BY END USER, 2018–2025 (USD MILLION)
TABLE 105 PARTNERSHIPS, 2018–2019
TABLE 106 ACQUISITIONS, 2019
LIST OF FIGURES (29 Figures)
FIGURE 1 REVENUE ASSURANCE MARKET: RESEARCH DESIGN
FIGURE 2 DATA TRIANGULATION
FIGURE 3 MARKET SIZE ESTIMATION METHODOLOGY: SUPPLY SIDE: REVENUE OF SOFTWARE AND SERVICES OF THE REVENUE ASSURANCE MARKET
FIGURE 4 MARKET SIZE ESTIMATION METHODOLOGY: APPROACH 1 BOTTOM-UP (SUPPLY SIDE): COLLECTIVE REVENUE OF ALL SOFTWARE AND SERVICES OF THE REVENUE ASSURANCE MARKET
FIGURE 5 SERVICES SEGMENT TO HOLD A LARGER MARKET SIZE IN 2020
FIGURE 6 ON-PREMISES DEPLOYMENT MODE TO HOLD A HIGHER MARKET SHARE IN 2020
FIGURE 7 TELECOMMUNICATION SERVICE PROVIDERS SEGMENT TO HOLD A LARGER MARKET SIZE IN 2020
FIGURE 8 RISE IN TRANSACTION DATA AND NEED FOR IMPROVING CUSTOMER SATISFACTION TO DRIVE THE REVENUE ASSURANCE MARKET GROWTH
FIGURE 9 ASIA PACIFIC TO GROW AT THE HIGHEST CAGR IN THE REVENUE ASSURANCE MARKET
FIGURE 10 SERVICES SEGMENT AND CHINA TO ACCOUNT FOR HIGHEST MARKET SHARES IN ASIA PACIFIC IN 2020
FIGURE 11 TELECOM VERTICAL TO ACCOUNT FOR THE HIGHEST MARKET SHARE DURING THE FORECAST PERIOD
FIGURE 12 DRIVERS, RESTRAINTS, OPPORTUNITIES, AND CHALLENGES: REVENUE ASSURANCE MARKET
FIGURE 13 SUBSCRIPTION ECONOMY INDEX, 2019
FIGURE 14 REVENUE ASSURANCE: PROCESS
FIGURE 15 SERVICES SEGMENT TO GROW AT A HIGHER CAGR DURING THE FORECAST PERIOD
FIGURE 16 MANAGED SERVICES TO HOLD THE LARGEST MARKET SIZE DURING THE FORECAST PERIOD
FIGURE 17 CLOUD SEGMENT TO GROW AT A HIGHER CAGR DURING THE FORECAST PERIOD
FIGURE 18 ENTERPRISES SEGMENT TO GROW AT A HIGHER CAGR DURING THE FORECAST PERIOD
FIGURE 19 TELECOM VERTICAL TO HOLD THE HIGHEST SHARE DURING THE FORECAST PERIOD
FIGURE 20 ASIA PACIFIC TO GROW AT THE HIGHEST CAGR DURING THE FORECAST PERIOD
FIGURE 21 NORTH AMERICA: MARKET SNAPSHOT
FIGURE 22 ASIA PACIFIC: MARKET SNAPSHOT
FIGURE 23 MARKET EVALUATION FRAMEWORK, 2018–2019
FIGURE 24 AMDOCS: COMPANY SNAPSHOT
FIGURE 25 TCS: COMPANY SNAPSHOT
FIGURE 26 NOKIA: COMPANY SNAPSHOT
FIGURE 27 SUBEX: COMPANY SNAPSHOT
FIGURE 28 HPE: COMPANY SNAPSHOT
FIGURE 29 ITRON: COMPANY SNAPSHOT
The study involved four major activities in estimating the current market size for the revenue assurance market. An exhaustive secondary research was done to collect information on the market. The next step was to validate these findings, assumptions, and sizing with industry experts across the value chain using primary research. Both top-down and bottom-up approaches were employed to estimate the total market size. After that, the market breakup and data triangulation procedures were used to estimate the market size of the segments and sub-segments of the market for revenue assurance.
Secondary Research
In the secondary research process, various secondary sources, such as D&B Hoovers, Bloomberg BusinessWeek, and Dun & Bradstreet, were referred to identify and collect information for this study. These secondary sources included annual reports, press releases, and investor presentations of companies; whitepapers, certified publications (Institute of Electrical and Electronics Engineers [IEEE]), and articles by recognized authors; gold standard and silver standard websites; regulatory bodies; trade directories; and databases.
Primary Research
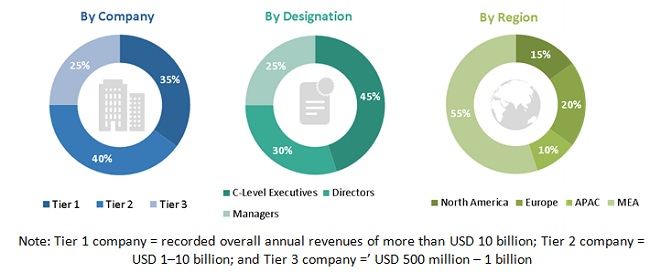
The revenue assurance market comprises several stakeholders, such as revenue assurance software vendors, system integrators, managed service providers, government and regulatory authorities, investors and venture capitalists, technology providers, suppliers, distributors, and contractors, telecommunication service providers (TSPs) and enterprise users. Various primary sources from both the supply and demand sides of the market were interviewed to obtain qualitative and quantitative information. Given below is the breakup of the primary respondents:
Market Size Estimation
The top-down and bottom-up approaches were used to estimate and validate the size of the revenue assurance market and various other dependent submarkets in the overall market. An exhaustive list of all the vendors who offer solutions and services in the revenue assurance market was prepared while using the top-down approach. The market share for all the vendors in the market was estimated through annual reports, press releases, funding, investor presentations, paid databases, and primary interviews. Each vendor was evaluated based on its components (hardware, software, and services). The aggregate of all companies’ revenues was extrapolated to reach the overall market size.
Further, each sub-segment was studied and analyzed for its regional market size and country-level penetration. The markets were triangulated through both primary and secondary research. The primary procedure included extensive interviews for key insights from the industry leaders, such as Chief Executive Officers (CEOs), Vice Presidents (VPs), directors, and managers.
Data Triangulation
After arriving at the overall market size using the market size estimation processes as explained above, the market was split into several segments and sub-segments. The data triangulation and market breakup procedures were employed, wherever applicable, to complete the overall market engineering process and arrive at the exact statistics of each market segment and sub-segment. The data was triangulated by studying various factors and trends from both the demand and supply sides.
Report Objectives
- To determine and forecast revenue assurance market by component, solution, deployment model, end-user, vertical and region during the forecast period, and analyze the various macroeconomic and microeconomic factors that affect the market growth
- To forecast the size of the market segments with respect to five regions: North America, Europe, APAC, MEA, and Latin America
- To provide detailed information about the major factors (drivers, restraints, opportunities, and challenges) influencing the growth of the market for revenue assurance
- To analyze each submarket with respect to individual growth trends, prospects, and contribution to the overall market
- To analyze the opportunities in the market for stakeholders by identifying the high-growth segments of the market
- To profile key market players; provide a comparative analysis based on business overview, regional presence, product offerings, business strategies, and key financials; and illustrate the competitive landscape of the market
- To track and analyze competitive developments, such as mergers and acquisitions, product developments, partnerships and collaborations, and Research and Development (R&D) activities, in the market
Key questions addressed by the report
- What are the growth opportunities in the revenue assurance market?
- What is the competitive landscape scenario in the market?
- What are the regulations that are expected to have an impact on the market for revenue assurance?
- How have revenue assurance model evolved from traditional technologies?
- What are the market dynamics of the market?
Available customizations
Along with the market data, MarketsandMarkets offers customizations as per the company’s specific needs. The following customization options are available for the report:
Company information
- Detailed analysis and profiling of additional market players (Up to 5)


Growth opportunities and latent adjacency in Revenue Assurance Market