Telecom Billing and Revenue Management Market by Solution (Software (Mediation, Billing and Charging, Revenue Assurance, and Fraud Management) and Services), Deployment Type, Telecom Operator Type, and Region - Global Forecast to 2024


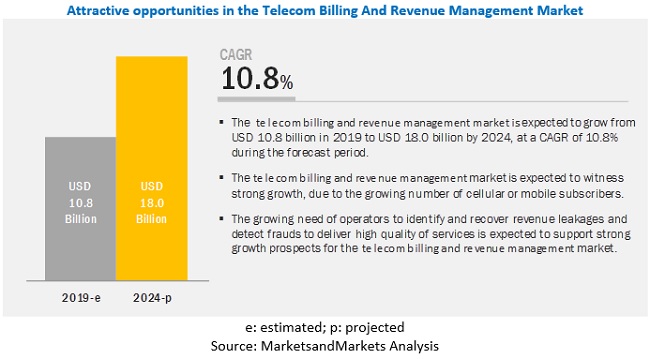
The global Telecom Billing and Revenue Management Market size is projected to expand at a CAGR of 10.8% during the forecast period to reach USD 18.0 billion by 2024, size was valued USD 10.8 billion in 2019. Major factors expected to drive the growth of the market include the growing number of cellular or mobile subscribers, the evolution of Communications Service Providers (CSPs) to Digital Services Providers (DSPs), and increasing complexities in revenue sharing across the telecom ecosystem.
By deployment type, on-premises segment to hold a larger market size during the forecast period
Based on the deployment type, the global telecom billing and revenue management market is segmented into on-premises and cloud. The on-premises segment is expected to hold a larger market size during the forecast period. On-premises telecom billing and revenue management solutions are also known as customer premises solutions. This is the most demanded, traditional, and popular deployment type among operators. The majority of telecom operators stick to on-premises systems, as the infrastructure is already present and can be reused, thereby saving a substantial amount on infrastructural change. Telecom billing and revenue management solutions are available as standalone modules or as an integrated platform, which is mostly deployed on the end-users’ premises. An on-premises solution typically involves the procurement of dedicated hardware, a software license, and annual support and maintenance fees; therefore, these modes of deployments are popular across large enterprises. On-premises deployment type brings in better control over system and data and requires dedicated IT staff for maintenance and support, and high-end IT and networking infrastructure. The solution providers have full control over the infrastructure, software, hardware, data, maintenance, and support. All the operational activities, such as setup, configuration, maintenance, and deployment of the solution, are handled locally on the end-users’ premises. The on-premises deployment involves low degree of data security concerns, which are expected to drive the customers to adopt on-premises telecom billing and revenue management solutions.
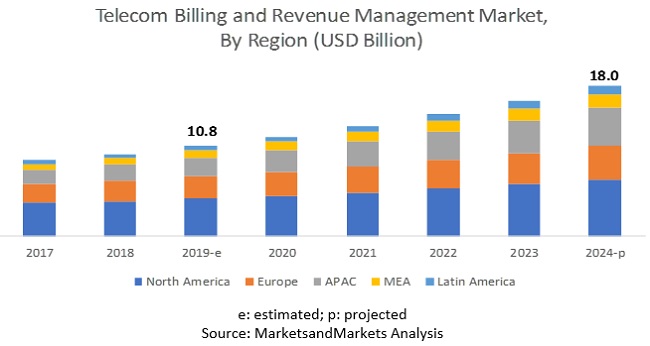
North America to account for the largest market size during the forecast period.
North America is one of the prominent regions in the global telecom billing and revenue management market in terms of market size with large-scale implementations in the telecom industry over the last decade. Some of the top companies, such as HPE and Enghouse Networks, are headquartered in North America. However, the growth of the market in North America is declining as the North American telecom industry is saturated as compared to the telecom industry in developing countries. The prominent telecom companies in North America are Amdocs, CSG Systems International, and Oracle. Mobile penetration in the region is very high. According to the report Mobile Economy North America 2019, published by GSMA, unique mobile subscribers in North America were 321 million, and mobile penetration rate was 83% of the population in 2018. As the telecom industry in North America is more saturated than other regions, there is a high demand for telecom billing and revenue management solutions.
Telecom Billing and Revenue Management Companies
Key and emerging market players include Amdocs (US), Netcracker (NEC Corporation [Japan]), CSG Systems International (US), Oracle (US), Ericsson (Sweden), Huawei (China), Cerillion (UK), Mahindra Comviva (India), Optiva (Canada), Comarch S.A. (Poland), Nokia (Finland), SAP (Germany), HPE (US), Openet (Ireland), TEOCO (US), Intracom Telecom (Greece), Enghouse Networks (Canada), Nexign (Russia), Bearing Point (Netherlands), FTS (Israel), Subex (India), Sterlite Technologies (India), Tecnotree (Finland), Zuora (US), and Apttus (US). These players have adopted various strategies to grow in the telecom billing and revenue management market. The companies are focused on inorganic and organic growth strategies to strengthen their market position.
The partnership is the key strategy of Amdocs in the market. In November 2019, Amdocs and AT&T partnered to modernize and upgrade AT&T’s digital business support systems under a multi-year managed services agreement. This partnership will help AT&T to offer enhanced customer experience and data analytics and security to its customers. In November 2019, Amdocs partnered with Vodafone Germany to modernize its digital business, Operations Systems (OS), and business processes across all touchpoints and channels, while actively reducing business complexity. Amdocs provided Vodafone Germany with its end-to-end digital cloud-native and open platform to launch new services at speed. The company offers Kenan to service providers, which is an open and efficient solution. It is also tightly coupled with customer care, and ordering and billing of solutions to reduce deployment time and risk. Amdocs Kenan focuses on quick, reliable, and secure monetization of services, including comprehensive revenue and customer management. It also provides support for any combination of voice, video, messaging, content, or Internet Protocol (IP) for Business-to-Business (B2B) customers and traditional Business-to-Consumer (B2C) services. Kenan offers various features, such as advanced rating, accurate Configure Price Quote (CPQ), cloud readiness, invoice aggregation, robust billing and invoicing, rating flexibility, complete financial management, automated business process, and equipment and inventory management. The company offers the AmdocsC1 platform especially for digital service providers that offer unifying sales, marketing, customer management, charging and billing, and pre-integrated policy management on a single platform.
Key focus areas of Huawei in the telecom billing and revenue management market are data charging for mobile, online charging for mobile, convergent billing for mobile, and convergent billing for fixed-mobile convergence. Huawei provides end-to-end solutions for telcos to manage its revenues. Its product portfolio includes Convergent Billing System, Online Charging System, Data Charging System, Value Distribution and Settlement, Authentication, Authorization and Accounting, and Mediation. These solutions enable telcos to monetize network assets and services efficiently, thereby optimizing business costs. Huawei’s revenue management solution serves 2.1 billion subscribers from more than 200 cloud service providers across 114 countries in the world. The company’s Data Charging System focuses on 3G/4G/Long Term Evolution (LTE) network traffic operations, which provides high performance, reliability, and real-time data service online charging provision for telcos. This helps them realize data service monetization. Convergent Billing System solution helps telcos monetize all commodities, such as voice, Short Message Service (SMS), Value Added Service (VAS), digital products, Internet of Things (IoT), and 5G products. The Online Charging System offers telcos online charging capabilities to prevent revenue leakage and enhance their product. Value Distribution and Settlement is a unified platform that supports all types of settlement businesses, such as internetwork, roaming, Over The Top (OTT), mobile payment, and eCommerce.
Scope of the Report
|
Report Metrics |
Details |
|
Market size available for years |
2017–2024 |
|
Base year considered |
2018 |
|
Forecast period |
2019–2024 |
|
Forecast units |
Billion (USD) |
|
Segments covered |
Solutions (Software [Mediation, Billing and Charging, Partner and Interconnect Management, Revenue Assurance, and Fraud Management], Services [Professional Services and Managed Services]), Telecom Operator Types (Mobile Operators [Mobile Network Operator (MNO), Mobile Virtual Network Operator (MVNO), and Mobile Virtual Network Enabler (MVNE)], Internet Service Providers [ISPs], Satellite Communication Providers, and Cable Network Providers), Deployment Types (On-premises and Cloud), and regions. |
|
Geographies covered |
North America, Europe, APAC, MEA, and Latin America |
|
List of Comapnies in Telecom Billing and Revenue Management |
Key and emerging market players include Amdocs (US), Netcracker (NEC Corporation [Japan]), CSG International (US), Oracle (US), Ericsson (Sweden), Huawei (China), Cerillion (UK), Mahindra Comviva (India), Optiva (Canada), Comarch S.A. (Poland), Nokia (Finland), SAP (Germany), HPE (US), Openet (Ireland), TEOCO (US), Intracom Telecom (Greece), Enghouse Networks (Canada), Nexign (Russia), Bearing Point (Netherlands), FTS (Israel), Subex (India), Sterlite Technologies (India), Tecnotree (Finland), Zuora (US), and Apttus (US). |
The research report categorizes the telecom billing and revenue management market to forecast the revenues and analyze trends in each of the following subsegments:
Telecom Billing and Revenue Management Market By Solution
-
Software
Mediation
- Billing and Charging
- Partner and Interconnect Management
- Revenue Assurance
- Fraud Management
-
Services
- Professional Services
- Managed Services
By Deployment Type
- On-Premises
- Cloud
By Telecom Operator
- Mobile Operators (Mobile Network Operator [MNO], Mobile Virtual Network Operator [MVNO], and Mobile Virtual Network Enabler [MVNE])
- Internet Service Providers (ISPs), Satellite Communication Providers, and Cable Network Providers
By Region
- North America
- Europe
- APAC
- MEA
- Latin America
Recent Developments
- In January 2020, Mobility partnered with Ericsson to empower Saudi Arabia’s government and private sectors for the digital transformation with the help of Ericsson’s end-to-end solutions. The partnership is expected to accelerate the deployment of digital services and expand the use of IoT.
- In October 2019, Vast Broadband selected Netcracker to deliver a Business Support System (BSS) and Operations Support Systems (OSS) transformation program, which will automate Vast Broadband’s end-to-end fulfillment processes and reduce operational costs. Netcracker will provide a solution to enhance its customer experience, managing and automating billing, inventory, service fulfillment, and product management.
- In October 2019, CSG Systems International launched Ascendon Communications, which is a SaaS and cloud-based BSS solution. This solution helps CSPs retain and expand their customer base, increase revenues by accelerating the launch of new services, support the new business model and offering innovation, and reduce costs through a cloud-based architecture.
- In September 2019, Schurz Communications partnered with Netcracker and used its revenue management solution for the longline business to streamline, simplify, and standardize the billing processes across different properties.
- In May 2019, CSG Systems International launched the Mediation platform as a cloud-based solution. CSG Mediation leverages both cloud and native Amazon Web Services (AWS) tools to help CSPs meet demands in real time. It also provides a cost-effective and efficient way for service providers to seize 5G opportunities with minimal risk and disruption to existing systems.
Frequently Asked Questions (FAQ):
What is growth rate of Telecom Billing and Revenue Management market in the next five years?
The telecom billing and revenue management market to grow from USD 10.8 billion in 2019 to USD 18.0 billion by 2024, at a Compound Annual Growth Rate (CAGR) of 10.8% during the forecast period.
What region holds the largest market size in the Telecom Billing and Revenue Management market?
North America is expected to grow at the largest market size during the forecast period. North America is one of the prominent regions in the global telecom billing and revenue management market in terms of market size with large-scale implementations in the telecom industry over the last decade. Some of the top companies, such as HPE and Enghouse Networks, are headquartered in North America. North America can be considered one of the leading regions in the adoption of 5G and IoT technologies.
What are the major factors driving the Telecom Billing and Revenue Management market?
Major factors expected to drive the growth of the market include the growing number of cellular or mobile subscribers, the evolution of Communications Service Providers (CSPs) to Digital Services Providers (DSPs), and increasing complexities in revenue sharing across the telecom ecosystem.
What are the key vendors in the Telecom Billing and Revenue Management market?
The major telecom billing and revenue management vendors include Amdocs (US), Netcracker (NEC Corporation [Japan]), CSG Systems International (US), Oracle (US), Ericsson (Sweden), Huawei (China), Cerillion (UK), Mahindra Comviva (India), Optiva (Canada), Comarch S.A. (Poland), Nokia (Finland), SAP (Germany), HPE (US), Openet (Ireland), TEOCO (US), Intracom Telecom (Greece), Enghouse Networks (Canada), Nexign (Russia), Bearing Point (Netherlands), FTS (Israel), Subex (India), Sterlite Technologies (India), Tecnotree (Finland), Zuora (US), and Apttus (US). .
To speak to our analyst for a discussion on the above findings, click Speak to Analyst
 Exclusive indicates content/data unique to MarketsandMarkets and not available with any competitors.
Table of Contents
1 Introduction (Page No. - 18)
1.1 Objectives of the Study
1.2 Market Definition
1.2.1 Inclusions and Exclusions
1.3 Market Scope
1.3.1 Market Segmentation
1.3.2 Regions Covered
1.3.3 Years Considered for the Study
1.4 Currency Considered
1.5 Stakeholders
2 Research Methodology (Page No. - 22)
2.1 Research Data
2.1.1 Secondary Data
2.1.2 Primary Data
2.1.2.1 Breakup of Primary Profiles
2.1.2.2 Key Industry Insights
2.2 Market Breakup and Data Triangulation
2.3 Market Size Estimation
2.4 Market Forecast
2.5 Assumptions for the Study
2.6 Limitations of the Study
3 Executive Summary (Page No. - 30)
4 Premium Insights (Page No. - 34)
4.1 Attractive Opportunities in the Global Telecom Billing and Revenue Management Market
4.2 Market By Solution, 2019
4.3 North America: Market By Telecom Operator Type and Deployment Type, 2019
4.4 Asia Pacific: Market By Telecom Operator Type and Deployment Type, 2019
5 Market Overview (Page No. - 36)
5.1 Introduction
5.2 Market Dynamics
5.2.1 Drivers
5.2.1.1 Growing Number of Cellular or Mobile Subscribers
5.2.1.2 Evolution of CSPs to DSPs
5.2.1.3 Increasing Complexities in Revenue Sharing Across the Telecom Ecosystem
5.2.2 Restraints
5.2.2.1 Presence of Stringent Telecom Regulations
5.2.3 Opportunities
5.2.3.1 Operators Taking Service Innovation to the Next Level for Monetizing and Marketing 5g and Iot
5.2.3.2 Need to Maximize Revenue Streams With Efficient AI and ML in Existing Revenue Management Systems
5.2.4 Challenges
5.2.4.1 High Volume of Customer Transactions and Continued Change in Network Technologies
5.2.4.2 Lack of Technical Proficiency in Implementing Billing and Revenue Assurance Solutions
5.3 Regulatory Landscape
5.3.1 Federal Communications Commission
5.3.2 Office of Communications
5.3.3 Ministry of Industry and Information Technology
5.3.4 Telecommunications Regulatory Authority
5.3.5 Federal Telecommunications Institute
5.3.6 General Data Protection Regulation
5.3.7 The International Organization for Standardization 27001
5.4 Use Cases
6 Telecom Billing and Revenue Management Market, By Solution (Page No. - 46)
6.1 Introduction
6.2 Software
6.2.1 Mediation
6.2.1.1 Mediation: Market Drivers
6.2.2 Billing and Charging
6.2.2.1 Billing and Charging: Market Drivers
6.2.3 Partner and Interconnect Management
6.2.3.1 Partner and Interconnect Management: Market Drivers
6.2.4 Revenue Assurance
6.2.4.1 Revenue Assurance: Market Drivers
6.2.5 Fraud Management
6.2.5.1 Fraud Management: Market Drivers
6.3 Services
6.3.1 Professional Services
6.3.1.1 Professional Services: Market Drivers
6.3.2 Managed Services
6.3.2.1 Managed Services: Market Drivers
7 Market, By Telecom Operator Type (Page No. - 57)
7.1 Introduction
7.2 Mobile Operators (MNO, MVNO, and MVNE)
7.2.1 Mobile Operators (MNO, MVNO, and MVNE): Market Drivers
7.3 Internet Service Providers, Satellite Communication Providers, and Cable Network Providers
7.3.1 Internet Service Providers, Satellite Communication Providers, and Cable Network Providers: Market Drivers
8 Market By Deployment Type (Page No. - 62)
8.1 Introduction
8.2 On-Premises
8.2.1 On-Premises: Market Drivers
8.3 Cloud
8.3.1 Cloud: Market Drivers
9 Telecom Billing and Revenue Management Market, By Region (Page No. - 66)
9.1 Introduction
9.2 North America
9.2.1 North America: Market Drivers
9.2.2 United States
9.2.3 Canada
9.3 Europe
9.3.1 Europe: Market Drivers
9.3.2 United Kingdom
9.3.3 Germany
9.3.4 France
9.3.5 Rest of Europe
9.4 Asia Pacific
9.4.1 Asia Pacific: Market Drivers
9.4.2 China
9.4.3 Japan
9.4.4 India
9.4.5 Rest of Asia Pacific
9.5 Middle East and Africa
9.5.1 Middle East and Africa: Market Drivers
9.5.2 Middle East and North Africa
9.5.3 Sub-Saharan Africa
9.6 Latin America
9.6.1 Latin America: Market Drivers
9.6.2 Mexico
9.6.3 Brazil
9.6.4 Rest of Latin America
10 Competitive Landscape (Page No. - 102)
10.1 Overview
10.2 Competitive Scenario
10.2.1 Partnerships
10.2.2 New Product Launches
11 Company Profiles (Page No. - 106)
11.1 Introduction
11.2 Amdocs
(Business Overview, Products Offered, Recent Developments, and SWOT Analysis)*
11.3 Netcracker
11.4 CSG Systems International
11.5 Oracle
11.6 Ericsson
11.7 Huawei
11.8 SAP
11.9 HPE
11.10 Nokia
11.11 Cerillion
11.12 Comarch
11.13 Mahindra Comviva
11.14 Optiva
11.15 Openet
11.16 Enghouse Networks
11.17 Sterlite Technologies
11.18 TEOCO Corporation
11.19 Intracom Telecom
11.20 Subex
11.21 Bearingpoint
11.22 FTS
11.23 Nexign
11.24 Tecnotree
11.25 Zuora
11.26 Apttus
*Details on Business Overview, Products Offered, Recent Developments, and SWOT Analysis Might Not be Captured in Case of Unlisted Companies.
11.27 Right- To-Win
12 Appendix (Page No. - 147)
12.1 Discussion Guide
12.2 Knowledge Store: Marketsandmarkets’ Subscription Portal
12.3 Available Customizations
12.4 Related Reports
12.5 Author Details
List of Tables (103 Tables)
Table 1 United States Dollar Exchange Rate, 2016–2019
Table 2 Factor Analysis
Table 3 Use Case 1: Nexign
Table 4 Use Case 2: Subex
Table 5 Use Case 3: FTS
Table 6 Use Case 4: Comarch
Table 7 Use Case 5: CSG
Table 8 Telecom Billing and Revenue Management Market Size, By Solution, 2017–2024 (USD Million)
Table 9 Market Size, By Software, 2017–2024 (USD Million)
Table 10 Mediation Market Size, By Region, 2017–2024 (USD Million)
Table 11 Billing and Charging Market Size, By Region, 2017–2024 (USD Million)
Table 12 Partner and Interconnect Management Market Size, By Region, 2017–2024 (USD Million)
Table 13 Revenue Assurance Market Size, By Region, 2017–2024 (USD Million)
Table 14 Fraud Management Market Size, By Region, 2017–2024 (USD Million)
Table 15 Telecom Billing and Revenue Management Market Size, By Service, 2017–2024 (USD Million)
Table 16 Professional Services Market Size, By Region, 2017–2024 (USD Million)
Table 17 Managed Services Market Size, By Region, 2017–2024 (USD Million)
Table 18 Market Size, By Telecom Operator Type, 2017–2024 (USD Million)
Table 19 Mobile Operators (MNO, MVNO, and MVNE) : Market Size, By Region, 2017–2024 (USD Million)
Table 20 Internet Service Providers, Satellite Communication Providers, and Cable Network Providers: Telecom Market Size, By Region, 2017–2024 (USD Million)
Table 21 Market Size, By Deployment Type, 2017–2024 (USD Million)
Table 22 On-Premises: Market Size, By Region, 2017–2024 (USD Million)
Table 23 Cloud: Market Size, By Region, 2017–2024 (USD Million)
Table 24 Telecom Billing and Revenue Management Market Size, By Region, 2017–2024 (USD Million)
Table 25 North America: Market Size, By Solution, 2017–2024 (USD Million)
Table 26 North America: Market Size, By Software, 2017–2024 (USD Million)
Table 27 North America: Market Size, By Service, 2017–2024 (USD Million)
Table 28 North America: Market Size, By Deployment Type, 2017–2024 (USD Million)
Table 29 North America: Market Size, By Telecom Operator Type, 2017–2024 (USD Million)
Table 30 North America: Telecom Billing and Revenue Management Market Size, By Country, 2017–2024 (USD Million)
Table 31 North America: Mediation Market Size, By Country, 2017–2024 (USD Million)
Table 32 North America: Billing and Charging Market Size, By Country, 2017–2024 (USD Million)
Table 33 North America: Partner and Interconnect Management Market Size, By Country, 2017–2024 (USD Million)
Table 34 North America: Revenue Assurance Market Size, By Country, 2017–2024 (USD Million)
Table 35 North America: Fraud Management Market Size, By Country, 2017–2024 (USD Million)
Table 36 North America: Professional Services Market Size, By Country, 2017–2024 (USD Million)
Table 37 North America: Managed Services Market Size, By Country, 2017–2024 (USD Million)
Table 38 United States: Telecom Billing and Revenue Management Market Size, By Solution, 2017–2024 (USD Million)
Table 39 United States: Market Size, By Software, 2017–2024 (USD Million)
Table 40 United States: Market Size, By Service, 2017–2024 (USD Million)
Table 41 United States: Market Size, By Deployment Type, 2017–2024 (USD Million)
Table 42 United States: Market Size, By Telecom Operator Type, 2017–2024 (USD Million)
Table 43 Canada: Telecom Billing and Revenue Management Market Size, By Solution, 2017–2024 (USD Million)
Table 44 Canada: Market Size, By Software, 2017–2024 (USD Million)
Table 45 Canada: Market Size, By Service, 2017–2024 (USD Million)
Table 46 Canada: Market Size, By Deployment Type, 2017–2024 (USD Million)
Table 47 Canada: Market Size, By Telecom Operator Type, 2017–2024 (USD Million)
Table 48 Europe: Telecom Billing and Revenue Management Market Size, By Solution, 2017–2024 (USD Million)
Table 49 Europe: Market Size, By Software, 2017–2024 (USD Million)
Table 50 Europe: Market Size, By Service, 2017–2024 (USD Million)
Table 51 Europe: Market Size, By Deployment Type, 2017–2024 (USD Million)
Table 52 Europe: Market Size, By Telecom Operator Type, 2017–2024 (USD Million)
Table 53 Europe: Market Size, By Country, 2017–2024 (USD Million)
Table 54 United Kingdom: Telecom Billing and Revenue Management Market Size, By Solution, 2017–2024 (USD Million)
Table 55 United Kingdom: Market Size, By Software, 2017–2024 (USD Million)
Table 56 United Kingdom: Market Size, By Service, 2017–2024 (USD Million)
Table 57 United Kingdom: Market Size, By Deployment Type, 2017–2024 (USD Million)
Table 58 United Kingdom: Market Size, By Telecom Operator Type, 2017–2024 (USD Million)
Table 59 Germany: Telecom Billing and Revenue Management Market Size, By Solution, 2017–2024 (USD Million)
Table 60 Germany: Market Size, By Software, 2017–2024 (USD Million)
Table 61 Germany: Market Size, By Service, 2017–2024 (USD Million)
Table 62 Germany: Market Size, By Deployment Type, 2017–2024 (USD Million)
Table 63 Germany: Market Size, By Telecom Operator Type, 2017–2024 (USD Million)
Table 64 France: Telecom Billing and Revenue Management Market Size, By Solution, 2017–2024 (USD Million)
Table 65 France: Market Size, By Software, 2017–2024 (USD Million)
Table 66 France: Market Size, By Service, 2017–2024 (USD Million)
Table 67 France: Market Size, By Deployment Type, 2017–2024 (USD Million)
Table 68 France: Market Size, By Telecom Operator Type, 2017–2024 (USD Million)
Table 69 Asia Pacific: Telecom Billing and Revenue Management Market Size, By Solution, 2017–2024 (USD Million)
Table 70 Asia Pacific: Market Size, By Software, 2017–2024 (USD Million)
Table 71 Asia Pacific: Market Size, By Service, 2017–2024 (USD Million)
Table 72 Asia Pacific: Market Size, By Deployment Type, 2017–2024 (USD Million)
Table 73 Asia Pacific: Market Size, By Telecom Operator Type, 2017–2024 (USD Million)
Table 74 Asia Pacific: Market Size, By Country, 2017–2024 (USD Million)
Table 75 China: Telecom Billing and Revenue Management Market Size, By Solution, 2017–2024 (USD Million)
Table 76 China: Market Size, By Software, 2017–2024 (USD Million)
Table 77 China: Market Size, By Service, 2017–2024 (USD Million)
Table 78 China: Market Size, By Deployment Type, 2017–2024 (USD Million)
Table 79 China: Market Size, By Telecom Operator Type, 2017–2024 (USD Million)
Table 80 Middle East and Africa: Telecom Billing and Revenue Management Market Size, By Solution, 2017–2024 (USD Million)
Table 81 Middle East and Africa: Market Size, By Software, 2017–2024 (USD Million)
Table 82 Middle East and Africa: Market Size, By Service, 2017–2024 (USD Million)
Table 83 Middle East and Africa: Market Size, By Deployment Type, 2017–2024 (USD Million)
Table 84 Middle East and Africa: Market Size, By Telecom Operator Type, 2017–2024 (USD Million)
Table 85 Middle East and Africa: Telecom Billing and Revenue Management Size, By Sub-Region, 2017–2024 (USD Million)
Table 86 Middle East and North Africa: Market Size, By Solution, 2017–2024 (USD Million)
Table 87 Middle East and North Africa: Market Size, By Software, 2017–2024 (USD Million)
Table 88 Middle East and North Africa: Market Size, By Service, 2017–2024 (USD Million)
Table 89 Middle East and North Africa: Market Size, By Deployment Type, 2017–2024 (USD Million)
Table 90 Middle East and North Africa: Market Size, By Telecom Operator Type, 2017–2024 (USD Million)
Table 91 Latin America: Telecom Billing and Revenue Management Market Size, By Solution, 2017–2024 (USD Million)
Table 92 Latin America: Market Size, By Software, 2017–2024 (USD Million)
Table 93 Latin America: Market Size, By Service, 2017–2024 (USD Million)
Table 94 Latin America: Market Size, By Deployment Type, 2017–2024 (USD Million)
Table 95 Latin America: Market Size, By Telecom Operator Type, 2017–2024 (USD Million)
Table 96 Latin America: Market Size, By Country, 2017–2024 (USD Million)
Table 97 Mexico: Telecom Billing and Revenue Management Market Size, By Solution, 2017–2024 (USD Million)
Table 98 Mexico: Market Size, By Software, 2017–2024 (USD Million)
Table 99 Mexico: Market Size, By Service, 2017–2024 (USD Million)
Table 100 Mexico: Market Size, By Deployment Type, 2017–2024 (USD Million)
Table 101 Mexico: Market Size, By Telecom Operator Type, 2017–2024 (USD Million)
Table 102 Partnership, 2018–2020
Table 103 New Service Launches and Service Enhancements, 2019
List of Figures (43 Figures)
Figure 1 Global Market: Research Design
Figure 2 Market Size Estimation Methodology: Approach 1 (Supply Side): Revenue of Solutions and Services of the Telecom Billing and Revenue Management Market
Figure 3 Market Size Estimation Methodology: Approach 1 Bottom-Up (Supply Side): Collective Revenue of All Software of the Market
Figure 4 Market Size Estimation Methodology: Approach 2 Top-Down (Demand Side): Share of the Overall Market
Figure 5 Software Segment to Hold a Larger Market Size During the Forecast Period
Figure 6 Mobile Operators (MNO, MVNO, and MVNE) Segment to Hold a Larger Market Size During the Forecast Period
Figure 7 Cloud Segment to Hold a Higher CAGR During the Forecast Period
Figure 8 Asia Pacific to Witness the Highest Growth Rate During the Forecast Period
Figure 9 Growing Number of Mobile Subscribers to Support Market Growth
Figure 10 Software Segment to Account for a Higher Market Share
Figure 11 Mobile Operators (MNO, MVNO, and MVNE) Segment and On-Premises Deployment Type to Record Higher Market Shares in North America
Figure 12 Mobile Operators (MNO, MVNO, and MVNE) Segment and On-Premises Deployment Type to Record Higher Market Shares in Asia Pacific
Figure 13 Telecom Billing and Revenue Management Market: Drivers, Restraints, Opportunities, and Challenges
Figure 14 Subscriber Penetration and Smartphone Adoption Trends, By 2025
Figure 15 Number of IoT Connections, By 2025 (Billion)
Figure 16 Services Segment to Grow at a Higher CAGR During the Forecast Period
Figure 17 Billing and Charging Segment to Grow at the Highest CAGR During the Forecast Period
Figure 18 Managed Services Segment to Grow at a Higher CAGR During the Forecast Period
Figure 19 Mobile Operators (MNO, MVNO, and MVNE) Segment to Grow at a Higher CAGR During the Forecast Period
Figure 20 Cloud Segment to Grow at a Higher CAGR During the Forecast Period
Figure 21 North America to be the Largest Market During the Forecast Period
Figure 22 North America: Market Snapshot
Figure 23 Asia Pacific: Market Snapshot
Figure 24 Key Strategies Adopted By the Leading Players in the Telecom Billing and Revenue Management Market During 2018–2019
Figure 25 Market Evaluation Framework, 2018–2019
Figure 26 Amdocs: Company Snapshot
Figure 27 Amdocs: SWOT Analysis
Figure 28 NEC: Company Snapshot
Figure 29 Netcracker: SWOT Analysis
Figure 30 CSG Systems International: Company Snapshot
Figure 31 CSG Systems International: SWOT Analysis
Figure 32 Oracle: Company Snapshot
Figure 33 Oracle: SWOT Analysis
Figure 34 Ericsson: Company Snapshot
Figure 35 Ericsson: SWOT Analysis
Figure 36 Huawei: Company Snapshot
Figure 37 SAP: Company Snapshot
Figure 38 HPE: Company Snapshot
Figure 39 Nokia: Company Snapshot
Figure 40 Cerillion: Company Snapshot
Figure 41 Comarch: Company Snapshot
Figure 42 Mahindra Comviva: Company Snapshot
Figure 43 Optiva: Company Snapshot
The study involved four major activities in estimating the current size of the telecom billing and revenue management market. Extensive secondary research was done to collect information on the market, the peer market, and the parent market. The next step was to validate these findings, assumptions, and sizing with industry experts across the value chain through primary research. Both top-down and bottom-up approaches were employed to estimate the complete market size. After that, the market breakup and data triangulation procedures were used to estimate the market size of segments and subsegments of the market.
Secondary Research
In the secondary research process, various secondary sources were referred to for identifying and collecting information for the study. The secondary sources included annual reports; press releases and investor presentations of companies; and white papers, certified publications, and articles from recognized associations and government publishing sources. Journals and telecom blogs, such as GSMA Intelligence, Farm Journal Media, AI Time Journal, Mobile Marketing Association, and The Next Web, have been referred to, for consolidating the report. Secondary research was mainly used to obtain key information about the industry insights, market’s monetary chain, overall pool of key players, market classification, and segmentation according to industry trends to the bottom-most level, regional markets, and key developments from both the market and technology-oriented perspectives.
Primary Research
In the primary research process, various primary sources from both the demand and supply sides were interviewed to obtain qualitative and quantitative information for the global telecom billing and revenue management report. The primary sources from the supply side included industry experts, such as Chief Executive Officers (CEOs), Vice Presidents (VPs), marketing directors, technology and innovation directors, and related key executives from various key companies and organizations operating in the global telecom billing and revenue management market. After the complete market engineering process (which included calculations for market statistics, market breakup, market size estimation, market forecasting, and data triangulation), extensive primary research was conducted to gather information, and verify and validate the numbers arrived at, through the estimation process. Primary research was also conducted to identify the segmentation types; industry trends; key players; a competitive landscape of the major market vendors; and key market dynamics, such as drivers, restraints, opportunities, challenges, industry trends, and key strategies.
The following is the breakup of the primary respondents’ profiles:
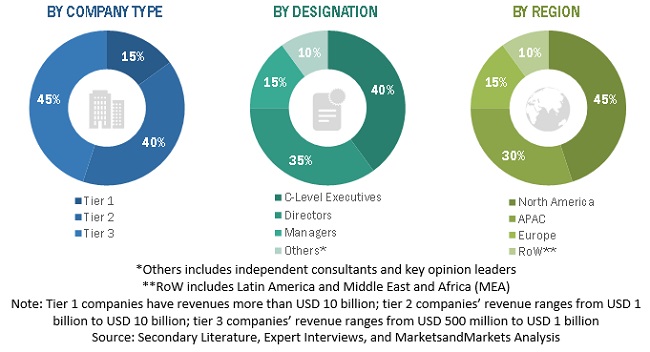
To know about the assumptions considered for the study, download the pdf brochure
Market Size Estimation
The top-down and bottom-up approaches were used to estimate and validate the size of the global market and its various other dependent subsegments. The key players in the market were identified through secondary research, and their revenue contribution in the respective regions was determined through primary and secondary research. The entire procedure included the study of annual and financial reports of top market players and extensive interviews for key insights from industry leaders, such as CEOs, VPs, directors, and marketing executives. All percentage splits and breakups were determined using secondary sources and verified through primary sources. All the possible parameters that affect the market covered in this research study have been accounted for, viewed in extensive detail, verified through primary research, and analyzed to arrive at the final quantitative and qualitative data. This data is consolidated and added with detailed inputs and analysis from MarketsandMarkets.
Data Triangulation
With data triangulation and validation through primary interviews, the exact value of the overall parent market size was determined and confirmed using this study. The overall market size was then used in the top-down procedure to estimate the size of other individual markets via percentage splits of the market segmentation.
Report Objectives
- To determine and forecast the global telecom billing and revenue management market based on solutions, telecom operator types, deployment types, and regions during the forecast period, and analyze various macro and microeconomic factors that affect the market growth
- To forecast the size of the market segments with respect to five main regions: North America, Europe, Asia Pacific (APAC), Latin America, and the Middle East and Africa (MEA)
- To provide detailed information about the major factors (drivers, opportunities, threats, and challenges) influencing the growth of the market
- To analyze each subsegment with respect to individual growth trends, prospects, and contribution to the total market
- To analyze opportunities in the market for stakeholders by identifying the high-growth segments of the market
- To profile key market players comprising top vendors and startups; provide comparative analysis based on business overview, regional presence, product offerings, business strategies, and key financials; and illustrate the market’s competitive landscapes
- To track and analyze competitive developments, such as mergers and acquisitions, product developments, partnerships and collaborations, and Research and Development (R&D) activities, in the market
Critical questions the report answers:
- Where will all these developments take the industry in the long term?
- What are the upcoming trends for the telecom billing and revenue management market?
- Which segment provides the most opportunity for growth?
- Who are the leading vendors operating in this market?
- What are the opportunities for new market entrants?
Available Customizations
With the given market data, MarketsandMarkets offers customizations as per the company’s specific requirements. The following customization options are available for the report:
Product Analysis
- Product matrix provides detailed product information and comparisons
Geographic Analysis
- Further breakup of the North American telecom billing and revenue management market
- Further breakup of the European market
- Further breakup of the APAC market
- Further breakup of the MEA market
- Further breakup of the Latin American market
Company Information
- Detailed analysis and profiling of additional market players


Growth opportunities and latent adjacency in Telecom Billing and Revenue Management Market