Potash Fertilizers Market by Type (Potassium Chloride, Sulfate of Potash, Potassium Nitrate), Crop Type (Cereals & Grains, Oilseeds & Pulses, Fruits & Vegetables), Application Method, Form, and Region - Global Forecast to 2022


[138 Pages Report] The potash fertilizers market was valued at USD 20.72 Billion in 2016. It is projected to grow at a CAGR of 4.47% from 2017, to reach USD 26.87 Billion by 2022. The base year considered for this study is 2016, and the forecast period is from 2017 to 2022. The objectives of the study are to define, segment, and measure the size of the market with respect to type, crop type, application method, form, and region. The report also aims to provide detailed information about the crucial factors influencing the growth of the market, strategical analysis of micromarkets, opportunities for stakeholders, details of the competitive landscape, and profile of the key players with respect to their market share and competencies.
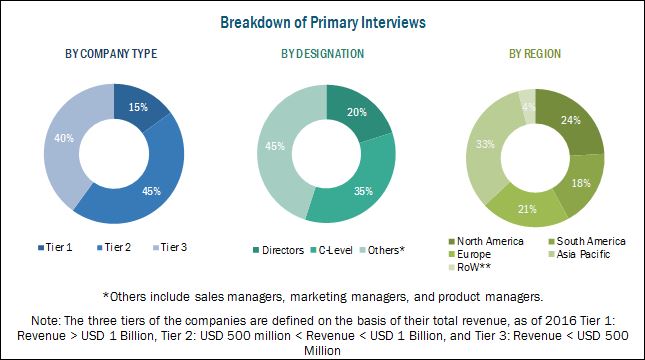
This report includes estimations of the market size in terms of value (USD million). Both, top-down and bottom-up approaches have been used to estimate and validate the size of the global market and to estimate the size of various other dependent submarkets in the overall market. Key players in the market have been identified through secondary research; some of the sources are press releases, annual reports, and financial journals, and paid databases such as Factiva and Bloomberg. All percentage shares, splits, and breakdowns have been determined using secondary sources and verified through primary sources. The figure below shows the breakdown of profiles of industry experts that participated in the primary discussions.
To know about the assumptions considered for the study, download the pdf brochure
The key players in this market include Yara International ASA (Norway), Agrium Inc. (Canada), Potash Corporation of Saskatchewan Inc. (Canada) EuroChem Group AG (Switzerland), The Mosaic Company (U.S.), JSC Belaruskali (Belarus), HELM AG (Germany), Israel Chemicals Ltd.(Israel), Sociedad Qu�mica y Minera de Chile(Chile) S.A, Borealis AG (Austria) , Sinofert Holdings Limited (Hong Kong) and K+S AKTIENGESELLSCHAFT (Germany).
This report is targeted at the existing players in the industry, which are as follows:
- Potash fertilizer manufacturers, suppliers, and formulators
- Potash fertilizer traders, suppliers, and distributors
- Professional potash fertilizer providers, associations, and industry bodies
- Research and development organizations
- Government authorities and agencies related to public health, environment, and agriculture
�The study answers several questions for stakeholders, primarily which market segments to focus on in the next two to five years for prioritizing efforts and investments.�
Scope of the report
On the basis of Crop Type, the market for potash fertilizers has been segmented as follows:
- Cereals & grains
- Rice
- Corn
- Wheat
- Barley
- Oilseeds & pulses
- Soybean
- Canola
- Sunflower
- Others (Peas and palm oil)
- Fruits & vegetables
- Apples
- Tomato
- Citrus
- Others (Brassica and berry )
- Others (Sugarcane, sugar beet, and fiber crops)
On the basis of Application Method, the market for potash fertilizers has been segmented as follows:
- Broadcasting
- Foliar
- Fertigation
On the basis of Type, the market for potash fertilizers has been segmented as follows:
- Potassium chloride
- Sulfate of Potash (SOP)
- Potassium nitrate
- Others
On the basis of Form, the market for potash fertilizers has been segmented as follows:
- Solid
- Liquid
On the basis of Region, the market for potash fertilizers has been segmented as follows:
- North America
- South America
- Europe
- Asia Pacific
- Rest of the World (RoW)
Available Customizations
With the given market data, MarketsandMarkets offers customizations according to the company�s specific scientific needs.
The following customization options are available for the report:
Segment Analysis
- Product matrix, which gives a detailed comparison of the product portfolio of each company
- Detailed analysis at volume level can also be provided
Geographic Analysis
- Further breakdown of the Rest of Europe potash fertilizers market into Poland, Ireland,Ukarine and Hungary.
- Further breakdown of the Rest of Asia Pacific potash fertilizers market into Thailand, Vietnam, Malaysia, and New Zealand.
- Further breakdown of other countries in the Rest of the World potash fertilizers market into include Middle East and Africa.
Company Information
- Detailed analyses and profiling of additional market players (up to five)
The potash fertilizers market is projected to grow at a CAGR of 4.47% from USD 21.6 Billion in 2017, to USD 26.87 Billion by 2022. The growth of this market can be attributed to rise in need for higher productivity using limited land area and increase in applicability of potash fertilizers. The benefits of using these fertilizers are driving the market growth as an increasing number of agricultural producers are adopting these products.
The potassium chloride segment, on the basis of type, accounted for the largest market share in 2016. Potassium chloride is mainly used as a source of potassium for agricultural crops. Potassium also plays an important role in increasing the protein, vitamin C, and solid soluble content in fruits, and starch content in grains & tubers. It also helps to improve fruit color & flavor, increases the size of fruits, reduces the incidences of pests & diseases, and enhances storage & shipping quality. The Sulfate of Potash segment, on the basis of type, accounted for the second-largest market share in 2016, owing to its increasing application to crops such as tobacco, pineapple, and avocado, or any crop suffering from sulfur deficiency.
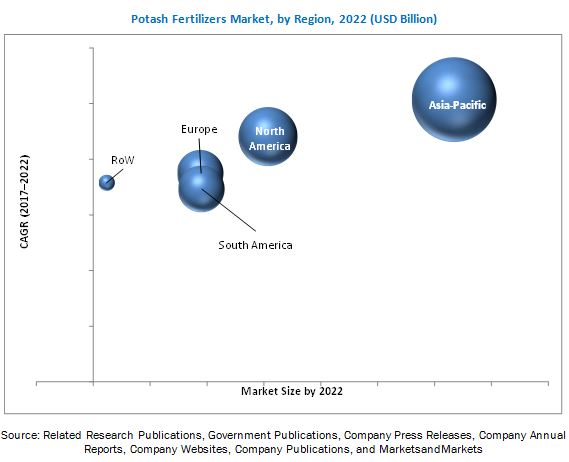
Asia Pacific accounted for the largest market share in 2016; this can be attributed to the high population in the region leading to an increased demand for food grains and growth in awareness among farmers about the efficient use of land through fertilizers. Asia Pacific is projected to be the fastest-growing region from 2017 to 2022 due to increase in consumption of vegetable crops that require potash fertilizers for maintaining their potassium content, which also fuels the growth of the potassium fertilizers market in the region.
Potash fertilizers are primarily consumed by cereals & grains and fruits & vegetables. Among the application in cereals, rice, wheat, and corn are the major consumers of potash fertilizers. Moreover, rise in population and growth in demand for improved diet have increased the need to increase yields that contain essential nutrients. Increase in the trend of organic food products that do not require chemical inputs is the major factor that is expected to hinder the potash fertilizers market globally.
The market is dominated by key players such as Yara International ASA (Norway), Agrium Inc. (Canada), Potashcorp Corporation Of Saskatchewan Inc. (Canada), EuroChem Group AG (Switzerland), The Mosaic Company (U.S.), JSC Belaruskali (Belarus), HELM AG (Germany), Israel Chemicals Ltd. (Israel), Sociedad Qu�mica y Minera de Chile (Chile) S.A, Borealis AG (Austria), Sinofert Holdings Limited (Hong Kong), and K+S AKTIENGESELLSCHAFT (Germany). The key players adopted strategic developments such as mergers & acquisitions, expansions, investments, collaborations and agreements in order to explore the market in new geographies.
To speak to our analyst for a discussion on the above findings, click Speak to Analyst
 Exclusive indicates content/data unique to MarketsandMarkets and not available with any competitors.
Table of Contents
1 Introduction (Page No. - 13)
1.1 Objectives of the Study
1.2 Market Definition
1.3 Markets Scope
1.4 Periodization
1.5 Currency
1.6 Unit
1.7 Stakeholders
2 Research Methodology (Page No. - 16)
2.1 Research Data
2.1.1 Secondary Data
2.1.1.1 Key Data From Secondary Sources
2.1.2 Primary Data
2.1.2.1 Key Data From Primary Sources
2.1.2.2 Key Industry Insights
2.1.2.3 Breakdown of Primaries
2.2 Macroindicators
2.2.1 Rising Global Population
2.2.2 Decreasing Arable Land Area
2.2.3 Increasing Reliance on the Use of Fertilizers for Productivity Enhancement
2.2.4 Regulatory, Fiscal, and Trade Policy Developments
2.3 Market Size Estimation
2.4 Market Breakdown & Data Triangulation
2.5 Assumptions and Limitations
2.5.1 Assumptions
2.5.2 Limitations
3 Executive Summary (Page No. - 28)
4 Premium Insights (Page No. - 32)
4.1 Attractive Opportunities in the Potash Fertilizers Market
4.2 Market Size, By Crop Type
4.3 Asia Pacific Potash Fertilizers Market, By Country & Type
5 Market Overview (Page No. - 34)
5.1 Introduction
5.2 Market Dynamics
5.2.1 Drivers
5.2.1.1 Need for Higher Productivity Using Limited Land Area
5.2.1.2 Increase in Applicability of Potash Fertilizers
5.2.2 Restraints
5.2.2.1 Increase in the Trend of Organic Food Consumption
5.2.3 Opportunities
5.2.3.1 Need to Improve Pasture Production
5.2.3.2 Rise in Investments in Agricultural Activities
5.2.4 Challenges
5.2.4.1 Unfavorable Regulatory Standards
5.2.4.2 Environmental Concerns
6 Market for Potash Fertilizers, By Type (Page No. - 38)
6.1 Introduction
6.2 Potassium Chloride (KCL)
6.3 Sulfate of Potash (SOP)
6.4 Potassium Nitrate
6.5 Others
7 Market for Potash Fertilizers, By Crop Type (Page No. - 45)
7.1 Introduction
7.2 Cereals and Grains
7.3 Oilseeds and Pulses
7.4 Fruits and Vegetables
7.5 Others
8 Market for Potash Fertilizers, By Application Method (Page No. - 51)
8.1 Introduction
8.2 Broadcasting
8.3 Foliar
8.4 Fertigation
9 Market for Potash Fertilizers, By Form (Page No. - 57)
9.1 Introduction
9.2 Liquid
9.3 Solid
10 Global Market for Potash Fertilizers, By Region (Page No. - 62)
10.1 Introduction
10.2 North America
10.2.1 US
10.2.2 Canada
10.2.3 Mexico
10.3 South America
10.3.1 Brazil
10.3.2 Colombia
10.3.3 Paraguay
10.3.4 Rest of South America
10.4 Europe
10.4.1 Germany
10.4.2 France
10.4.3 Spain
10.4.4 UK
10.4.5 Italy
10.4.6 Russia
10.4.7 Belarus
10.4.8 Rest of Europe
10.5 Asia Pacific
10.5.1 China
10.5.2 India
10.5.3 Japan
10.5.4 Australia
10.5.5 Indonesia
10.5.6 Rest of Asia Pacific
10.6 RoW
10.6.1 Middle East
10.6.2 Africa
11 Competitive Landscape (Page No. - 93)
11.1 Introduction
11.2 Competitive Leadership Mapping
11.2.1 Visionary Leaders
11.2.2 Innovators
11.2.3 Dynamic Differentiators
11.2.4 Emerging Companies
11.3 Competitive Benchmarking
11.3.1 Strength of Product Portfolio
11.3.2 Business Strategy Excellence
12 Company Profiles (Page No. - 99)
(Business Overview, Strength of Product Portfolio, Product Portfolio, Business Strategy Excellence, and Recent Developments)*
12.1 Yara International Asa
12.2 Agrium Inc.
12.3 Potash Corporation of Saskatchewan Inc
12.4 Eurochem Group AG
12.5 The Mosaic Company
12.6 JSC Belaruskali
12.7 Helm AG
12.8 Israel Chemicals Ltd.
12.9 Sociedad Qu�mica Y Minera De Chile S.A. (SQM)
12.10 Borealis AG
12.11 Sinofert Holdings Limited
12.12 K+S Aktiengesellschaft
*Details on Business Overview, Strength of Product Portfolio, Product Portfolio, Business Strategy Excellence, and Recent Developments might not be captured in case of unlisted companies.
13 Appendix (Page No. - 132)
13.1 Discussion Guide
13.2 Knowledge Store: Marketsandmarkets� Subscription Portal
13.3 Introducing RT: Real-Time Market Intelligence
13.4 Available Customizations
13.5 Related Reports
13.6 Author Details
List of Tables (85 Tables)
Table 1 Potash Fertilizers Market Size, By Type, 2015�2022 (USD Million)
Table 2 Potash Fertilizers Market Size, By Type, 2015�2022 (KT)
Table 3 Potassium Chloride: Market Size for Potash Fertilizers, By Region, 2015�2022 (USD Million)
Table 4 Potassium Chloride: Market Size, By Region, 2015�2022 (KT)
Table 5 Sulfate of Potash: Market Size for Potash Fertilizers, By Region, 2015�2022 (USD Million)
Table 6 Sulfate of Potash: Market Size, By Region, 2015�2022 (KT)
Table 7 Potassium Nitrate: Market Size for Potash Fertilizers, By Region, 2015�2022 (USD Million)
Table 8 Potassium Nitrate: Market Size, By Region, 2015�2022 (KT)
Table 9 Others: Market Size for Potash Fertilizers, By Region, 2015�2022 (USD Million)
Table 10 Others: Market Size, By Region, 2015�2022 (KT)
Table 11 Market Size for Potash Fertilizers, By Crop Type, 2015�2022 (USD Million)
Table 12 Market Size, By Crop Type, 2015�2022 (KT)
Table 13 Market Size, By Cereals and Grains Sub-Crop Type, 2015�2022 (USD Million)
Table 14 Market Size, By Cereals and Grains Sub-Crop Type, 2015�2022 (KT)
Table 15 Market Size for Potash Fertilizers, By Oilseeds and Pulses Sub-Crop Type, 2015�2022 (USD Million)
Table 16 Market Size, By Oilseeds and Pulses Sub-Crop Type, 2015�2022 (KT)
Table 17 Market Size for Potash Fertilizers, By Fruits and Vegetables Sub-Crop Type, 2015�2022 (USD Million)
Table 18 Market Size, By Fruits and Vegetables Sub-Crop Type, 2015�2022 (KT)
Table 19 Market Size, By Application Method, 2015�2022 (USD Million)
Table 20 Market Size, By Application Method, 2015�2022 (KT)
Table 21 Broadcasting: Market Size for Potash Fertilizers, By Region, 2015�2022 (USD Million)
Table 22 Broadcasting: Market Size, By Region, 2015�2022 (KT)
Table 23 Foliar: Potash Fertilizers Market Size, By Region, 2015�2022 (USD Million)
Table 24 Foliar: Market Size, By Region, 2015�2022 (KT)
Table 25 Fertigation: Market Size for Potash Fertilizers, By Region, 2015�2022 (USD Million)
Table 26 Fertigation: Market Size, By Region, 2015�2022 (KT)
Table 27 Market Size for Potash Fertilizers, By Form, 2015�2022 (USD Million)
Table 28 Market Size, By Form, 2015�2022 (KT)
Table 29 Liquid Potash Fertilizers Market Size, By Region, 2015�2022 (USD Million)
Table 30 Liquid Potash Fertilizers Market Size, By Region, 2015�2022 (KT)
Table 31 Solid Potash Fertilizers Market Size, By Region, 2015�2022 (USD Million)
Table 32 Solid Potash Fertilizers Market Size, By Region, 2015�2022 (KT)
Table 33 Market Size for Potash Fertilizers, By Region, 2015�2022 (USD Million)
Table 34 Market Size for Potash Fertilizers, By Region, 2015�2022 (KT)
Table 35 North America: Potash Fertilizers Market Size, By Country, 2015�2022 (USD Million)
Table 36 North America: Market Size, By Country, 2015�2022 (KT)
Table 37 North America: Market Size, By Type, 2015�2022 (USD Million)
Table 38 North America: Market Size, By Type, 2015�2022 (KT)
Table 39 North America: Market Size, By Crop Type, 2015�2022 (USD Million)
Table 40 North America: Market Size, By Crop Type, 2015�2022 (KT)
Table 41 North America: Market Size, By Application Method, 2015�2022 (USD Million)
Table 42 North America: Market Size, By Application Method, 2015�2022 (KT)
Table 43 North America: Market Size, By Form, 2015�2022 (USD Million)
Table 44 North America: Market Size, By Form, 2015�2022 (KT)
Table 45 South America: Market Size for Potash Fertilizers, By Country, 2015�2022 (USD Million)
Table 46 South America: Market Size, By Country, 2015�2022 (KT)
Table 47 South America: Market Size, By Type, 2015�2022 (USD Million)
Table 48 South America: Market Size, By Type, 2015�2022 (KT)
Table 49 South America: Market Size, By Crop Type, 2015�2022 (USD Million)
Table 50 South America: Market Size, By Crop Type, 2014�2022 (KT)
Table 51 South America: Market Size, By Application Method, 2015�2022 (USD Million)
Table 52 South America: Market Size, By Application Method, 2015�2022 (KT)
Table 53 South America: Market Size, By Form, 2015�2022 (USD Million)
Table 54 South America: Market Size, By Form, 2015�2022 (KT)
Table 55 Europe: Potash Fertilizers Market Size, By Country, 2015�2022 (USD Million)
Table 56 Europe: Market Size, By Country, 2015�2022 (KT)
Table 57 Europe: Market Size, By Type, 2015�2022 (USD Million)
Table 58 Europe: Market Size, By Type, 2015�2022 (KT)
Table 59 Europe: Market Size, By Crop Type, 2015�2022 (USD Million)
Table 60 Europe: Market Size, By Crop Type, 2015�2022 (KT)
Table 61 Europe: Market Size, By Application Method, 2015�2022 (USD Million)
Table 62 Europe: Market Size, By Application Method, 2015�2022 (KT)
Table 63 Europe: Market Size, By Form, 2015�2022 (USD Million)
Table 64 Europe: Market Size, By Form, 2015�2022 (KT)
Table 65 Asia Pacific: Market Size for Potash Fertilizers, By Country, 2015�2022 (USD Million)
Table 66 Asia Pacific: Market Size, By Country, 2015�2022 (KT)
Table 67 Asia Pacific: Market Size, By Type, 2015�2022 (USD Million)
Table 68 Asia Pacific: Market Size, By Type, 2015�2022 (KT)
Table 69 Asia Pacific: Market Size, By Crop Type, 2015�2022 (USD Million)
Table 70 Asia Pacific: Market Size, By Crop Type, 2015�2022 (KT)
Table 71 Asia Pacific: Market Size, By Application Method, 2015�2022 (USD Million)
Table 72 Asia Pacific: Market Size, By Application Method, 2015�2022 (KT)
Table 73 Asia Pacific: Market Size, By Form, 2015�2022 (USD Million)
Table 74 Asia Pacific: Market Size, By Form, 2015�2022 (KT)
Table 75 RoW: Potash Fertilizers Market Size, By Country, 2015�2022 (USD Million)
Table 76 RoW: Market Size, By Country, 2015�2022 (KT)
Table 77 RoW: Market Size, By Type, 2015�2022 (USD Million)
Table 78 RoW: Market Size, By Type, 2015�2022 (KT)
Table 79 RoW: Market Size, By Crop Type, 2015�2022 (USD Million)
Table 80 RoW: Market Size, By Crop Type, 2015�2022 (KT)
Table 81 RoW: Market Size, By Application Method, 2015�2022 (USD Million)
Table 82 RoW: Market Size, By Application Method, 2015�2022 (KT)
Table 83 RoW: Market Size, By Form, 2015�2022 (USD Million)
Table 84 RoW: Market Size, By Form, 2015�2022 (KT)
Table 85 Ranking Analysis
List of Figures (38 Figures)
Figure 1 Potash Fertilizers Market Segmentation
Figure 2 Market: Research Design
Figure 3 Breakdown of Primary Interviews: By Company Type, Designation, Region
Figure 4 Population Growth Trend, 1950�2100 (Billion)
Figure 5 Arable Land Area, 1965�2014 (Million Hectares)
Figure 6 Per Capita Arable Land, 1961�2014 (Hectare/Person)
Figure 7 Fertilizer Consumption (Kilograms/Hectare of Arable Land)
Figure 8 Market Size Estimation Methodology: Bottom-Up Approach
Figure 9 Market Size Estimation Methodology: Top-Down Approach
Figure 10 Market Breakdown & Data Triangulation
Figure 11 Market for Potash Fertilizers, By Type, 2017 vs 2022 (USD Million)
Figure 12 Market for Potash Fertilizers, By Application Method, 2017 vs 2022 (USD Billion)
Figure 13 Market for Potash Fertilizers, By Crop Type, 2017 vs 2022 (USD Billion)
Figure 14 Asia Pacific to Be the Fastest-Growing Region in the Market, By Value, From 2017 to 2022
Figure 15 Key Strategies, 2012�2017
Figure 16 Market for Potash Fertilizers: Emerging Market With Promising Growth Potential
Figure 17 Cereals & Grains Segment to Lead the Market, 2017�2022
Figure 18 Potassium Chloride Segment Held Largest Share in the Asia Pacific Potash Fertilizers Market in 2016
Figure 19 Potash Fertilizers: Drivers, Restraints, Opportunities, and Challenges
Figure 20 Potassium Chloride Segment to Lead Market, 2017�2022 (USD Million)
Figure 21 Cereals & Grains Segment to Lead Potash Fertilizers Market, 2017�2022 (USD Million)
Figure 22 Broadcasting Segment to Record Highest CAGR, 2017�2022 (USD Million)
Figure 23 Liquid Segment to Record Higher CAGR, 2017�2022 (USD Million)
Figure 24 Geographic Snapshot: India to Record Highest CAGR, Globally, 2017�2022
Figure 25 North American Potash Fertilizers Market: US Accounted for the Largest Market Share
Figure 26 Asia Pacific Market: China Accounted for the Largest Market Share
Figure 27 Potash Fertilizers Market (Global): Competitive Leadership Mapping, 2017
Figure 28 Yara International ASA: Company Snapshot
Figure 29 Agrium Inc.: Company Snapshot
Figure 30 Potash Corporation of Saskatchewan Inc.: Company Snapshot
Figure 31 Eurochem Group AG: Company Snapshot
Figure 32 The Mosaic Company: Company Snapshot
Figure 33 Helm AG: Company Snapshot
Figure 34 Israel Chemicals Ltd.: Company Snapshot
Figure 35 SQM: Company Snapshot
Figure 36 Borealis AG: Company Snapshot
Figure 37 Sinofert Holdings Limited: Company Snapshot
Figure 38 K+S Aktiengesellschaft: Company Snapshot

 Generating Response ...


Growth opportunities and latent adjacency in Potash Fertilizers Market