Phosphate Fertilizers Market By Active Ingredient (Diammonium Phosphate, Monoammonium Phosphate, Triple Superphosphate, Single Superphosphate, Superphosphate, Calcium Phosphate), By Crop Type Cereals & Grains, Oil Seeds, Fruits & Vegetables), By Geography: Trends & Forecasts To 2018


Phosphorus is an essential macronutrient required for optimum crop production with respect to fertilizer use. Phosphorus is obtained from bone meal, fertilizer, and rock superphosphate. Rock phosphate is the raw material used to manufacture most commercial phosphate fertilizers in the market.
Rapid growth in population necessitates higher food production. This is motivating farmers to utilize optimum quality fertilizers to procurehigher yields. The key phosphatic fertilizers are diammonium phosphate (DAP), monoammonium phosphate (MAP), and superphosphates. The consumption of DAP and superphosphate fertilizers is comparatively higher among phosphatic fertilizers to the extent of 30% and 38%, respectively. Geographically, the Asia-Pacific region has the highest demand for phosphatic fertilizers, which accounted for a share of 63.09% in 2012. After Asia-Pacific, the Latin American regions have great potential for future growth of the phosphatic fertilizers market.
This report provides a comprehensive review of major phosphatic fertilizers consumed across regions. A detailed analysis of the competitive landscape of key market players with their developments, mergers, acquisitions, expansions, and new product developments are furnished in the report. Quantitative data with regards to all the segmentations mentioned above is given in terms of both-revenue and volume. Furthermore, the different key market players within the phosphatic fertilizers market have been profiled in this report. It also includes details such as company overview, financial details, products, strategy, and recent developments.
Phosphatic Fertilizers Market Share (Revenue), by Application, 2012
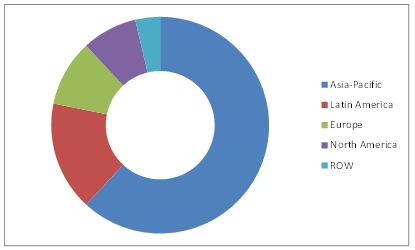
Source: MarketsandMarkets Analysis
The overall phosphatic fertilizer market is calculated by segmenting the market into micro-markets, based on the share of each application, product, and region. The key players in the market are identified through secondary and primary researches. Based on that, their market shares have been evaluated. This includes a study of the annual reports of top market players and interviews with key opinion leaders such as CEOs, directors, and marketing executives.
The overall size of the market is determined by forecasting techniques based on the consumption of phosphatic fertilizers in different applications, regions, and data validated through primary sources. The volume market for phosphatic fertilizers is determined, and the value market is reflected by the average price of the phosphatic fertilizer, which is evaluated using primary and secondary research. The market data is available from 2011 to 2018 with a forecasted CAGR from 2013 to2018.
The regions covered include North America (U.S., Canada, and Mexico), Europe (the U.K., Germany, France, Italy, and Spain), Asia-Pacific (China, Japan, and India), Latin America (Brazil and Argentina), and the Rest of the World. The key players covered in this report are Yara International ASA (Norway), Agrium Inc., (Canada), Coromandel International Ltd. (India), Potash Corp. of Saskatchewan (Canada), CF Industries Holdings Inc. (U.S.), Eurochem (Russia), OCP (Morocco), Mosaic (U.S.), ICL (Israel), and Phosagro (Russia).The global phosphatic fertilizers market is expected to grow at a CAGR of 3.2% to be valued at $61,623.5million by 2018.
Scope of the report
This report focuses on the global phosphatic fertilizers market. This research categorizes the global phosphatic fertilizers market based on geography, type, and application:
Based on geography:
- North America
- Europe
- Asia-Pacific
- ROW
Based on type:
- Diammonium phosphate
- Monoammonium phosphate
- Superphosphate
- Others
Based on crop types:
- Grain & oilseed
- Fruit & vegetable
- Other
Ground rock phosphate has been used as a source of phosphorous for acid soils in the past. However, due to the low availability of phosphorous in rock phosphate, high transportation costs and small crop responses have reduced the usage of rock phosphate in agriculture. Alternatively, the rising diversified food demand amid rising population factors have challenged farmers to increase the crop output from the limited arable land. These factors have made farmers use chemical fertilizers, which increased the demand for the phosphatic fertilizers market.
After nitrogen, phosphorus is an essential macronutrient required for the optimum crop production with respect to fertilizer utilization. Phosphorus nutrient is a component of the complex nucleic acid structure of plants, which regulates protein synthesis. Phosphorus in plants is involved in the formation of sugars, oils, starches, etc., and it also helps with the rapid growth of plants. Various forms of phosphorous are applied to overcome the specific phosphorous nutrient deficiency in soils.
Phosphatic Fertilizers Market Size, by Geography, 2012 (KT)
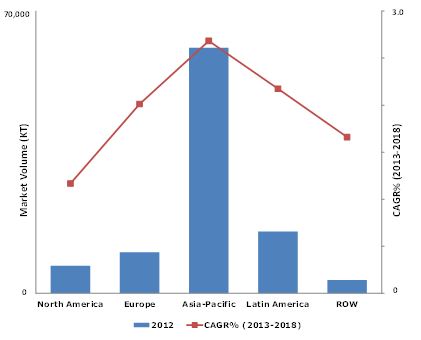
Source: MarketsandMarkets Analysis
The major phosphatic fertilizers used are diammonium phosphate (DAP), monoammonium phosphate (MAP), superphosphates, and others. The global phosphatic fertilizer consumption market is expected to grow at a CAGR of 2.4% by volume and 3.2% by value from 2013 to 2018. The Asia-Pacific region is a larger consumer of phosphatic fertilizers, which is expected to rise at a CAGR of 2.7% by volume and 3.5% by value for the forecasted period. Latin America demonstrates a strong growth potential in phosphatic fertilizer consumption after the Asia-Pacific region.
Yara International ASA (Norway), Agrium Inc., (Canada), Coromandel International Ltd. (India), Potash Corp. of Saskatchewan (Canada), CF Industries Holdings Inc. (U.S.), Eurochem(Russia), OCP (Morocco), Mosaic(U.S.), ICL (Israel), and Phosagro (Russia) are key players in the phosphatic fertilizers market and their recent development strategies have been studied. In 2012, the grain & oil seeds segment held a greater share of the phosphatic fertilizers market of 52.2% by volume, in terms of application. Asia-Pacific holds a major market share of nearly 58.3%, by volume in the grain & oil seeds segment.
 Exclusive indicates content/data unique to MarketsandMarkets and not available with any competitors.
Table of Contents
1 Introduction (Page No. - 17)
1.1 Objective
1.2 Report Description
1.3 Markets Covered
1.4 Stakeholders
1.5 Research Methodology
1.5.1 Key Data Points Taken From Secondary Sources
1.5.2 Key Data Points Taken From Primary Sources
1.5.3 Assumptions
1.5.4 Key Questions Answered
2 Executive Summary (Page No. - 25)
3 Premium Insights (Page No. - 27)
3.1 Market Segment
3.2 Market Overview
3.2.1 Phosphatic Fertilizers Market Size, By Geography (KT)
3.2.2 Phosphatic Fertilizer Market Size, By Geography ($Million)
3.2.3 Posphatic Fertilizers Market Size, By Type & Geography, 2012 ($Million)
3.2.4 Phosphatic Fertilizers Market Size, By Application, 2012 (KT)
3.3 Asia-Pacific: Market Life Cycle
3.3.1 Asia-Pacific: Posphatic Fertilizers Market Size, By Countrycountry ($Million)
3.3.2 Asia-Pacific: Phosphatic Fertilizers Market Size, By Type, 2012 (KT)
3.3.3 Asia-Pacific: Phosphatic Fertilizer Market Size, By Application, 2012 ($Million)
4 Market Overview (Page No. - 36)
4.1 Introduction
4.2 Phosphate Fertilizers Market: An Overview
4.3 Types of Phosphate Fertilizers
4.3.1 Diammonium Phosphate (DAP)
4.3.2 Monoammonium Phosphate (MAP)
4.3.3 Superphosphate
4.3.4 Others
4.4 Burning Issues
4.4.1 Restricting Factors That Lead to Production Stoppage
4.5 Winning Imperatives
4.5.1 Government Subsidies
4.5.2 Investments in R&D
4.5.3 Soil Degradation
4.6 Market Dynamics
4.6.1 Drivers
4.6.1.1 Rise in Population & Diversified Food Demand
4.6.1.2 Growing Meat Consumption Fuels The Demand For Fertilizers
4.6.1.3 Limited Availability of Arable Land
4.6.2 Restraints
4.6.2.1 Growth of The Organic Fertilizers Industry
4.6.2.2 Government Policies & Pricing Volatility
4.6.3 Opportunities
4.6.3.1 Growth Potential in Asia-Pacific & The Latin American Market
4.7 Porter’s Five Forces Analysis
4.7.1.1 Supplier’s Power
4.7.1.2 Threat of Substitutes
4.7.1.3 Threat of New Entrants
4.7.1.4 Buyer’s Power
4.7.1.5 Degree of Competition
4.8 Supply Chain Analysis
4.9 Value Chain Analysis
5 Phosphatic Fertilizers Market, By Type (Page No. - 54)
5.1 Introduction
5.2 Diammonium Phosphate (DAP)
5.3 Monoammonium Phosphate (MAP)
5.4 Superphosphate
5.5 Others
6 Phosphatic Fertilizers Market, By Application (Page No. - 73)
6.1 Introduction
6.2 Grains & Oilseeds
6.3 Fruits & Vegetables
6.4 Others
7 Phosphatic Fertilizers Market, By Geography (Page No. - 87)
7.1 Introduction
7.2 North America
7.2.1 U.S.
7.2.2 Mexico
7.2.3 Canada
7.3 Europe
7.3.1 France
7.3.2 Germany
7.3.3 U.K.
7.3.4 Spain
7.3.5 Italy
7.3.6 Others
7.4 Asia-Pacific
7.4.1 China
7.4.2 Japan
7.4.3 India
7.4.4 Others
7.5 Latin America
7.5.1 Brazil
7.5.2 Argentina
7.5.3 Others
7.6 ROW
8 Competitive Landscape (Page No. - 199)
8.1 Introduction
8.2 Acquisitions: Most Preferred Strategic Approach
8.3 Key Market Strategies
8.4 Acquistions
8.5 Agreements, Partnerships & Joint Ventures
8.6 Expansions
9 Company Profiles (Page No. - 210)
9.1 Potash Corp. of Saskatchewan Inc.
9.1.1 Overview
9.1.2 Products & Services
9.1.3 Strategies and Insights
9.1.4 Developments
9.1.5 MNM View
9.1.5.1 SWOT Analysis
9.2 Agrium Inc.
9.2.1 Overview
9.2.2 Products & Services
9.2.3 Strategies and Insights
9.2.4 Developments
9.2.5 MNM View
9.2.5.1 SWOT Analysis
9.3 Eurochem
9.3.1 Overview
9.3.2 Products & Services
9.3.3 Strategies and Insights
9.3.4 Developments
9.3.5 MNM View
9.3.5.1 SWOT Analysis
9.4 Yara International ASA
9.4.1 Overview
9.4.2 Products & Services
9.4.3 Strategy and Insights
9.4.4 Developments
9.4.5 MNM View
9.4.5.1 SWOT Analysis
9.5 Coromandel International Ltd.
9.5.1 Overview
9.5.2 Products & Services
9.5.3 Strategy & Insights
9.5.4 Developments
9.6 CF Industries Holdings Inc.
9.6.1 Overview
9.6.2 Products & Services
9.6.3 Strategies and Insights
9.6.4 Developments
9.7 office Cherifien Des Phosphates
9.7.1 Overview
9.7.2 Products & Services
9.7.3 Strategies and Insights
9.7.4 Developments
9.8 The Mosaic Co.
9.8.1 Overview
9.8.2 Products & Services
9.8.3 Strategy & Insights
9.8.4 Developments
9.8.5 MNM View
9.8.5.1 SWOT Analysis
9.9 Israel Chemicals Limited
9.9.1 Overview
9.9.2 Products & Description
9.9.3 Strategy & Insights
9.9.4 Developments
9.10 Phosagro
9.10.1 Overview
9.10.2 Products & Services
9.10.3 Strategies and Insights
9.10.4 Developments
List of Tables (122 Tables)
Table 1 Assumptions For The Phosphatic Fertilizers Market
Table 2 Phosphatic Fertilizers Market Size, By Geography, 2011-2018 ($Million)
Table 3 Seed Safety Guidelines
Table 4 Types & Concentrations of Phosphatic Fertilizer
Table 5 Phosphatic Fertilizer Market Size, By Type, 2011-2018 ($Million)
Table 6 Phosphatic Fertilizer Market Size, By Type, 2011-2018 (KT)
Table 7 Diammonium Phosphate (DAP): Phosphatic Fertilizer Market Size, By Geography, 2011-2018 ($Million)
Table 8 Diammonium Phosphate (DAP): Phosphatic Fertilizer Market Size, By Geography, 2011-2018 (KT)
Table 9 Monoammonium Phosphate (MAP): Phosphatic Fertilizer Market Size, By Geography, 2011-2018 ($Million)
Table 10 Monoammonium Phosphate (MAP): Phosphatic Fertilizer Market Size, By Geography, 2011-2018 (KT)
Table 11 Superphosphate: Phosphatic Fertilizers Market Size, By Geography, 2011-2018 ($Million)
Table 12 Superphosphate: Phosphatic Fertilizer Market Size, By Geography, 2011-2018 (KT)
Table 13 Others: Phosphatic Fertilizers Market Value, By Geography, 2011-2018 ($Million)
Table 14 Others: Phosphatic Fertilizer Market Value, By Geography, 2011-2018 (KT)
Table 15 Phosphatic Fertilizers Market Size, By Application, 2011-2018 ($Million)
Table 16 Phosphatic Fertilizer Market Size, By Application, 2011-2018 (KT)
Table 17 Grains & Oilseeds: Phosphatic Fertilizers Market Size, By Geography, 2011-2018 ($Million)
Table 18 Grains & Oilseeds: Phosphatic Fertilizer Market Size, By Geography, 2011-2018 (KT)
Table 19 Fruit & Vegetables: Phosphatic Fertilizer Market Size, By Geography, 2011-2018 ($Million)
Table 20 Fruit & Vegetables: Phosphatic Fertilizer Market Size, By Geography, 2011-2018 (KT)
Table 21 Other: Phosphatic Fertilizer Market Size, By Geography, 2011-2018 ($Million)
Table 22 Others: Phosphatic Fertilizer Market Size, By Geography, 2011-2018 (KT)
Table 23 Crops Grown in Different Regions With The Use of Phosphatic Fertilizer
Table 24 Phosphatic Fertilizer Market Size, By Geography, 2011-2018 ($Million)
Table 25 Phosphatic Fertilizer Market Size, By Geography, 2011-2018 (KT)
Table 26 Phosphatic Fertilizer Market Size, By Type, 2011-2018 ($Million)
Table 27 Phosphatic Fertilizers Market Size, By Type, 2011-2018 (KT)
Table 28 Phosphatic Fertilizer Market Size, By Crop Type, 2011-2018 ($Million)
Table 29 Phosphatic Fertilizers Market Size, By Crop Type, 2011-2018 (KT)
Table 30 North America: Phosphatic Fertilizer Market Size, By Country, 2011-2018 ($Million)
Table 31 North America: Phosphatic Fertilizers Market Size, By Country, 2011-2018 (KT)
Table 32 North America: Phosphatic Fertilizer Market Size, By Crop Type, 2011-2018 ($Million)
Table 33 North America: Phosphatic Fertilizer Market Size, By Crop Type, 2011-2018 (KT)
Table 34 U.S.: Phosphatic Fertilizer Market Size, By Type, 2011-2018 ($Million)
Table 35 U.S.: Phosphatic Fertilizers Market Size, By Type, 2011-2018 (KT)
Table 36 U.S.: Phosphatic Fertilizer Market Size, By Crop Type, 2011-2018 ($Million)
Table 37 U.S.: Phosphatic Fertilizer Market Size, By Crop Type, 2011-2018 (KT)
Table 38 Mexico: Phosphatic Fertilizers Market Size, By Type, 2011-2018 ($Million)
Table 39 Mexico: Phosphatic Fertilizer Market Size, By Type, 2011-2018 (KT)
Table 40 Mexico: Phosphatic Fertilizer Market Size, By Crop Type, 2011-2018 ($Million)
Table 41 Mexico: Phosphatic Fertilizer Market Size, By Crop Type, 2011-2018 (KT)
Table 42 Canada: Phosphatic Fertilizers Market Size, By Type, 2011-2018($Million)
Table 43 Canada: Phosphatic Fertilizer Market Size, By Type, 2011-2018(KT)
Table 44 Canada: Phosphatic Fertilizer Market Size, By Crop Type, 2011-2018 ($Million)
Table 45 Canada: Phosphatic Fertilizers Market Size, By Crop Type, 2011-2018 (KT)
Table 46 Europe: Phosphatic Fertilizer Market Size, By Country, 2011-2018 ($Million)
Table 47 Europe: Phosphatic Fertilizer Market Size, By Country, 2011-2018(KT)
Table 48 Europe: Phosphatic Fertilizers Market Size, By Crop Type, 2011-2018 ($Million)
Table 49 Europe: Phosphatic Fertilizer Market Size, By Crop Type, 2011-2018 (KT)
Table 50 France: Phosphatic Fertilizers Market Size, By Type, 2011-2018 ($Million)
Table 51 France: Phosphatic Fertilizer Market Size, By Type, 2011-2018(KT)
Table 52 France: Phosphatic Fertilizer Market Size, By Crop Type, 2011-2018 ($Million)
Table 53 France: Phosphatic Fertilizer Market Size, By Crop Type, 2011-2018 (KT)
Table 54 Germany: Phosphatic Fertilizer Market Size, By Type, 2011-2018($Million)
Table 55 Germany: Phosphatic Fertilizer Market Size, By Type, 2011-2018(KT)
Table 56 Germany: Phosphatic Fertilizer Market Size, By Crop Type, 2011-2018 ($Million)
Table 57 Germany: Phosphatic Fertilizers Market Size, By Crop Type, 2011-2018 (KT)
Table 58 U.K.: Phosphatic Fertilizer Market Size, By Type, 2011-2018 ($Million)
Table 59 U.K.: Phosphatic Fertilizers Market Size, By Type, 2011-2018 (KT)
Table 60 U.K.: Phosphatic Fertilizer Market Size, By Crop Type, 2011-2018 ($Million)
Table 61 U.K.: Phosphatic Fertilizer Market Size, By Crop Type, 2011-2018 (KT)
Table 62 Spain: Phosphatic Fertilizers Market Size, By Type, 2011-2018($Million)
Table 63 Spain: Phosphatic Fertilizer Market Size, By Type, 2011-2018(KT)
Table 64 Spain.: Phosphatic Fertilizer Market Size, By Crop Type, 2011-2018 ($Million)
Table 65 Spain: Phosphatic Fertilizer Market Size, By Crop Type, 2011-2018 (KT)
Table 66 Italy: Phosphatic Fertilizer Market Size, By Type, 2011-2018 ($Million)
Table 67 Italy: Phosphatic Fertilizers Market Size, By Type, 2011-2018(KT)
Table 68 Italy: Phosphatic Fertilizer Market Size, By Crop Type, 2011-2018 ($Million)
Table 69 Italy: Phosphatic Fertilizer Market Size, By Crop Type, 2011-2018 (KT)
Table 70 Others: Phosphatic Fertilizers Market Size, By Type, 2011-2018($Million)
Table 71 Others: Phosphatic Fertilizer Market Size, By Type, 2011-2018(KT)
Table 72 Others: Phosphatic Fertilizer Market Size, By Crop Type, 2011-2018 ($Million)
Table 73 Others: Phosphatic Fertilizer Marketsize, By Crop Type, 2011-2018 (KT)
Table 74 Asia-Pacific: Phosphatic Fertilizer Market Size, By Country, 2011-2018 ($Million)
Table 75 Asia-Pacific: Phosphatic Fertilizer Market Size, By Country, 2011-2018(KT)
Table 76 Asia-Pacific: Phosphatic Fertilizer Market Size, By Crop Type, 2011-2018 ($Million)
Table 77 Asia-Pacific: Phosphatic Fertilizers Market Size, By Crop Type, 2011-2018 (KT)
Table 78 China: Phosphatic Fertilizer Market Size, By Type, 2011-2018 ($Million)
Table 79 China: Phosphatic Fertilizer Market Size, By Type, 2011-2018 (KT)
Table 80 China: Phosphatic Fertilizers Market Size, By Crop Type, 2011-2018 ($Million)
Table 81 China: Phosphatic Fertilizer Market Size, By Crop Type, 2011-2018 (KT)
Table 82 Japan: Phosphatic Fertilizer Market Size, By Type, 2012 (KT)
Table 83 Japan: Phosphatic Fertilizer Market Size, By Type, 2011-2018 ($Million)
Table 84 Japan: Phosphatic Fertilizers Market Size, By Type, 2011-2018(KT)
Table 85 Japan: Phosphatic Fertilizer Market Size, By Crop Type, 2011-2018 ($Million)
Table 86 Japan: Phosphatic Fertilizer Market Size, By Crop Type, 2011-2018 (KT)
Table 87 India: Phosphatic Fertilizers Market Size, By Type, 2011-2018 ($Million)
Table 88 India: Phosphatic Fertilizer Market Size, By Type, 2011-2018(KT)
Table 89 India: Phosphatic Fertilizer Market Size, By Crop Type, 2011-2018 ($Million)
Table 90 India: Phosphatic Fertilizer Market Size, By Crop Type, 2011-2018 (KT)
Table 91 Others: Phosphatic Fertilizer Market Size, By Type, 2011-2018 ($Million)
Table 92 Others: Phosphatic Fertilizers Market Size, By Type, 2011-2018(KT)
Table 93 Others: Phosphatic Fertilizer Market Size, By Crop Type, 2011-2018 ($Million)
Table 94 Others: Phosphatic Fertilizer Market Size, By Crop Type, 2011-2018 (KT)
Table 95 Latin America: Phosphatic Fertilizer Market Size, By Country, 2011-2018 ($Million)
Table 96 Latin America: Phosphatic Fertilizer Market Size, By Country, 2011-2018 (KT)
Table 97 Latin America: Phosphatic Fertilizers Market Size, By Crop Type, 2011-2018 ($Million)
Table 98 Latin America: Phosphatic Fertilizer Market Size, By Crop Type, 2011-2018 (KT)
Table 99 Brazil: Phosphatic Fertilizers Market Size, By Type, 2011-2018 ($Million)
Table 100 Brazil: Phosphatic Fertilizer Market Size, By Type, 2011-2018(KT)
Table 101 Brazil: Phosphatic Fertilizer Market Size, By Crop Type, 2011-2018 ($Million)
Table 102 Brazil: Phosphatic Fertilizer Market Size, By Crop Type, 2011-2018 (KT)
Table 103 Argentina: Phosphatic Fertilizers Market Size, By Type, 2011-2018 ($Million)
Table 104 Argentina: Phosphatic Fertilizer Market Size, By Type, 2011-2018 (KT)
Table 105 Argentina: Phosphatic Fertilizer Market Size, By Crop Type, 2011-2018 ($Million)
Table 106 Argentina: Phosphatic Fertilizer Market Size, By Crop Type, 2011-2018 (KT)
Table 107 Others: Phosphatic Fertilizer Market Size, By Type, 2011-2018 ($Million)
Table 108 Others: Phosphatic Fertilizers Market Size, By Type, 2011-2018(KT)
Table 109 Others: Phosphatic Fertilizer Market Size, By Crop Type, 2011-2018 ($Million)
Table 110 Others: Phosphatic Fertilizers Market Size, By Crop Type, 2011-2018 (KT)
Table 111 ROW: Phosphatic Fertilizer Market Size, By Crop Type, 2011-2018 ($Million)
Table 112 ROW: Phosphatic Fertilizers Market Size, By Crop Type, 2011-2018 (KT)
Table 113 Acquisitions, 2009–2013
Table 114 Agreements,Partnerships & Joint Ventures 2009–2013
Table 115 Expansions 2009–2013
Table 116 Potash Corp.: Products & Their Description
Table 117 Yara : Products & Their Description
Table 118 Coromandel: Products & Their Description
Table 119 CF Industries Holdings Inc.: Products & Their Description
Table 120 OCP: Products & Their Description
Table 121 The Mosaic Co. : Products & Their Description
Table 122 Phosagro: Products & Their Description
List of Figures (50 Figures)
Figure 1 Phosphatic Fertilizers Market Segmentation
Figure 2 Asia-Pacific: Phosphatic Fertilizer Market Segmentation
Figure 3 Phosphatic Fertilizer Market Size, By Geography, 2012 (KT)
Figure 4 Phosphatic Fertilizer Market Size, By Geography, 2012 ($Million)
Figure 5 Posphatic Fertilizers Market Size, By Type & Geography, 2012 ($Million)
Figure 6 Phosphatic Fertilizer Market Size, By Application, 2012 (KT)
Figure 7 Phosphatic Fertilizer: Market Life Cycle in Asia-Pacific, By Country, 2012
Figure 8 Asia-Pacific: Posphatic Fertilizers Market Size, By Country, 2012 ($Million)
Figure 9 Asia-Pacific: Phosphatic Fertilizers Market Size, By Type, 2012 (KT)
Figure 10 Asia-Pacific: Phosphatic Fertilizer Market Size, By Application, 2012 ($Million)
Figure 11 Heading Missing
Figure 12 Market Dynamics- Phosphatic Fertilizer
Figure 13 Phosphatic Fertilizer Supply Chain Analysis
Figure 14 Phosphatic Fertilizer Value Chain Analysis
Figure 15 Phosphatic Fertilizer Market, By Type
Figure 16 Phosphatic Fertilizer Market Share, By Type, 2012 ($Million)
Figure 17 Factors That Affect The Phosphorous Diffusion in Soil
Figure 18 Phosphatic Fertilizer Market Share (Revenue), By Application, 2012
Figure 19 Grains & Oilseeds: Phosphatic Fertilizer Market Share (Revenue), By Geography, 2012
Figure 20 Fruit & Vegetables: Phosphatic Fertilizer Market Share (Volume), By Geography, 2012
Figure 21 Other: Phosphatic Fertilizer Market Share (Revenue), By Geography, 2012
Figure 22 Phosphatic Fertilizer: Key Drivers For Its Demand
Figure 23 Phosphatic Fertilizer Market Size, By Geography, 2012 (KT)
Figure 24 North America: Phosphatic Fertilizer Market Size, By Country, 2012 (KT)
Figure 25 U.S.: Phosphatic Fertilizers Market Size, By Type, 2012 (KT)
Figure 26 Mexico: Phosphatic Fertilizer Market Size, By Type, 2012 (KT)
Figure 27 Canada: Phosphatic Fertilizer Market Size, By Type, 2012(KT)
Figure 28 Europe: Phosphatic Fertilizer Market Size, By Type, 2012 (KT)
Figure 29 France: Phosphatic Fertilizer Market Size, By Type, 2012 (KT)
Figure 30 Germany: Phosphatic Fertilizer Market Size (KT), By Type, 2012
Figure 31 U.K.: Phosphatic Fertilizer Market Size, By Type, 2012 (KT)
Figure 32 Spain: Phosphatic Fertilizers Market Size, By Type, 2012 (KT)
Figure 33 Italy: Phosphatic Fertilizer Market Size, By Type, 2012(KT)
Figure 34 Others Europe: Phosphatic Fertilizer Market Size, By Type, 2012 (KT)
Figure 35 Asia-Pacific: Phosphatic Fertilizer Market Size, By Type, 2012 (KT)
Figure 36 China: Phosphatic Fertilizer Market Size, By Type, 2012 (KT)
Figure 37 India: Phosphatic Fertilizer Market Size, By Type, 2012 (KT)
Figure 38 Others: Phosphatic Fertilizer Market Size, By Type, 2012 (KT)
Figure 39 Latin America: Phosphatic Fertilizer Market Size, By Type, 2012 (KT)
Figure 40 Brazil: Phosphatic Fertilizer Market Size, By Type, 2012 (KT)
Figure 41 Argentina: Phosphatic Fertilizer Market Size, By Type, 2012 (KT)
Figure 42 Others: Phosphatic Fertilizer Market Size, By Type, 2012 (KT)
Figure 43 Phosphatic Fertilizer Market Share, By Growth Strategy, 2009–2013
Figure 44 Phosphatic Fertiliser Market Developments, 2009–2013
Figure 45 Phosphatic Fertilizer Share, By Company, 2009-2013
Figure 46 Potash Corp.: SWOT Analysis
Figure 47 Agrium Inc.: SWOT Analysis
Figure 48 Eurochem: SWOT Analysis
Figure 49 Yara International: SWOT Analysis
Figure 50 The Mosaic Co.: SWOT Analysis


Growth opportunities and latent adjacency in Phosphate Fertilizers Market