Fertilizer Additives Market by Function (Anticaking, Dedusting, Antifoaming, Hydrophobic, and corrosion Inhibitor), Application (Urea, Ammonium Nitrate, DAP, MAP, Ammonium Sulphate, and TSP), Form of Application, and Region - Global Forecast to 2021


[146 Pages Report] The global fertilizer additives market is projected to grow from USD 2.6 billion in 2016 to USD 2.9 billion by 2021, at a CAGR of 3.1% during the forecast period. Fertilizer additives offer several advantages, such as it helps to stimulate the productivity of fertilizers. In addition, the growing need for primary nutrients and high quality of fertilizers have also led to a surge in demand for increasing agricultural yields. These factors are driving the demand for fertilizer additives across regions. The base year considered for the study is 2015, and the forecast has been provided for the period between 2016 and 2021.
Market Dynamics
Drivers
- Rising demand for agricultural commodities
- R&D in fertilizer manufacturing technology
- Ease of application and handling of fertilizers
Restraints
- Growth of the organic fertilizers industry
- Environmental impact of chemical fertilizers
Opportunities
- Growth potential in emerging markets
Challenges
- Adverse health effects of agrochemicals on human health
- Imposition of stringent regulations
Use of fertilizer additives in various applications to drive the global fertilizer additives market
Fertilizer additives are applied to various forms of fertilizers and ensure accurate application of fertilizers on the land. Depending on the manufacturing process, the particles of mineral fertilizers can be of various sizes and shapes, which include granules, pellets, ‘prills,’ crystals, and fine powder (dust). Most of the fertilizer additives are combined into granular fertilizers as compared to the other forms of application. The use of fertilizer additives during farming also helps the grower maintain the quality of produce. The combination of fertilizer additive and fertilizers helps in improving and increasing the yield. For instance, granular or dry fertilizers are available in the dry pelleted form, unlike spikes, liquid, and powder fertilizers. The main advantage of using granular fertilizers is that they are similar to time-release capsules, allowing nutrients to flow out over time, instead of flooding the plants with nutrients, as liquid fertilizers.
The following are the major objectives of the study
- To define, segment, and measure the fertilizer additives market based on its function, application, form of application, and region
- To provide detailed information regarding the crucial factors influencing the growth of the market (drivers, restraints, opportunities, and industry-specific challenges)
- To strategically analyze the micromarkets with respect to individual growth trends, future prospects, and contribution to the total fertilizer additives market
- To analyze opportunities in the market for stakeholders and provide details of the competitive landscape for market leaders
- To project the size of the market, in terms of value (USD million) and volume (KT) in the five main regions, namely, North America, Europe, Asia-Pacific, Latin America, and the Rest of the World (RoW)
- To project the market size, in terms of value (USD million), on the basis of function (anticaking agent, dedusting agent, antifoam agent, hydrophobic agent, corrosion inhibitors, and others), application (urea, ammonium nitrate, diammonium phosphate, monoammonium phosphate, ammonium sulfate, triple super phosphate, and others), and form (prills, granules, powders, and others)
- To strategically profile the key players, comprehensively analyze their market share and core competencies
- To analyze competitive developments such as new product launches, acquisitions, investments, expansions, partnerships, agreements, joint ventures, and collaborations in the fertilizer additives market
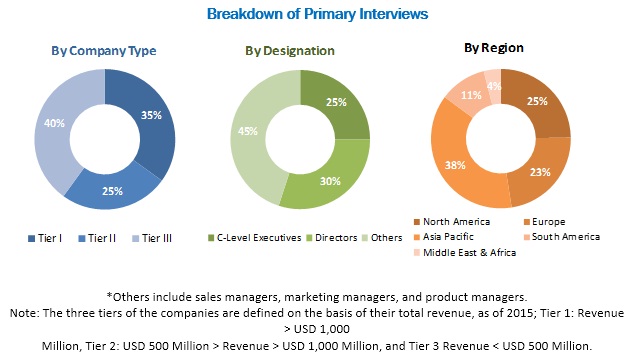
During this research study, major players operating in the fertilizer additives market in various regions were identified, and their offerings, regional presence, and distribution channels were analyzed through in-depth discussions. Top-down and bottom-up approaches were used to determine the overall market size. Sizes of the other individual markets were estimated using the percentage splits obtained through secondary sources such as Hoovers, Bloomberg BusinessWeek, and Factiva along with primary respondents. The entire procedure includes the study of the annual and financial reports of the top market players and extensive interviews with industry experts such as CEOs, VPs, directors, and marketing executives for key insights (both qualitative and quantitative) pertaining to the market. The figure below shows the breakdown of the primaries on the basis of the company type, designation, and region considered during the research study.
To know about the assumptions considered for the study, download the pdf brochure
The fertilizer additives market comprises a network of players involved in the research and product development, raw material supply, component manufacturing, distribution and sale, and post-sales services. Key players considered in the analysis of the fertilizer additives market are Clariant Mining Solutions (Switzerland), KAO Corporation (Japan), Novochem Group (Netherlands), and ArrMaz (US). Other players such as Filtra Catalysts & Chemicals Ltd. (India), Amit Trading LTD. (Israel), Chemipol (Spain), Michelman (US), Tolsa Group (Spain), and Forbon Technology (China).
Major Market Developments
- In April 2016, Clariant Mining Solutions set up additional production capacity for Phosphate Esters (P-Esters) at its plant in Gendorf, Germany, to extend its existing production capacity at its Knapsack facility. Phosphate Esters (PEsters) were used as emulsifiers, wetting and dispersing agents, antistatic agents, and as additives for fertilizers.
- In January 2016, Filtra Catalysts and Chemicals Ltd became a subsidiary of Dorf Ketal Chemicals. The acquisition helped Dorf Ketal Chemicals to expand its operations in India for adsorbents and catalysts for downstream hydrocarbon industries such as oil refineries, petrochemicals, and fertilizer plants.
- In November 2015, ArrMaz opened its new chemical manufacturing plant located at AL Jalamid in Saudi Arabia. The AL Jalamid plant produces a full range of custom formulated process aids, additives for the processing of phosphate ore, and the production of phosphate fertilizers to support the growth of the Saudi phosphate industry.
Target Audience
- Fertilizer/fertilizer additives manufacturers
- Research institutions
- Agrochemical manufacturers
- Distributors and traders
- Raw material suppliers
- Wholesalers
- Government bodies
- Agriculture institutions
- Farmers
Report Scope
By Function
- Anticaking agent
- Dedusting agent
- Antifoam agent
- Hydrophobic agent
- Corrosion inhibitors
- Others
By Form of Application
- Prills
- Granules
- Powders
- Others
By Application:
- Urea
- Ammonium nitrate
- Diammonium phosphate
- Monoammonium phosphate
- Ammonium sulfate
- Triple superphosphate
- Others
By Geography
- North America
- Europe
- Asia Pacific (APAC)
- Latin America
- Rest of the World (RoW)
Critical questions which the report answers
- What are new types of fertilizer additives, which the fertilizer companies are exploring?
- Which are the key players in the market and how intense is the competition?
Available Customizations
Based on the given market data, MarketsandMarkets offers customizations in the reports as per the client’s specific requirements. The available customization options are as follows:
Geographic Analysis
- Further country-wise breakdown of the market in APAC based on application
Company Information
- Detailed analysis and profiling of additional market players (Up to 5)
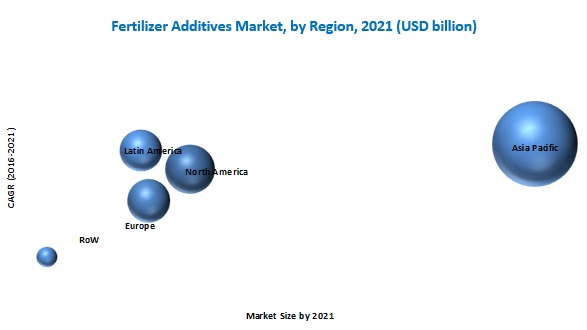
The global fertilizer additives market is projected to grow from USD 2.6 billion in 2016 to USD 2.9 billion by 2021, at a CAGR of 2.6% during the forecast period. The demand for fertilizer additives is mainly dependent on the growth of the fertilizer industry. Further, the shrinking arable land, adoption of new technology in fertilizer production, and the increasing willingness of farmers to spend more for increased productivity are some important factors that contribute to the growing demand for fertilizer additives.
Fertilizer additives are substances that enhance the quality and integrity of fertilizers. These are particularly engineered and developed to counter problems such as foaming, dedusting, moisture, and caking. Additives are effective tools for producers to improve the quality and integrity of their products and to reduce the damage caused during storage, transportation, and application.
The fertilizer additives market is segmented on the basis of function, into anticaking agent, dedusting agent, antifoam agent, hydrophobic agent, and corrosion inhibitors. The market for anticaking agent is projected to grow at the highest CAGR between 2016 and 2021. Among all fertilizer additives, the anticaking agent is the most common fertilizer additive. The consumption of fertilizer additive as an anticaking agent is growing rapidly as caking, or clumping is a major concern in dry fertilizer production, storage, transport, and application. Thus, anti-caking agents are essential for the growth of various agriculture products.
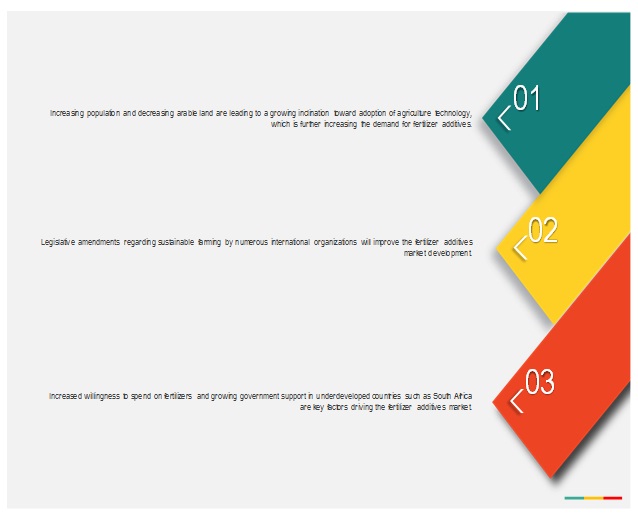
The fertilizer additives market in APAC is projected to grow at the highest CAGR during the forecast period. The increasing population and the increasing need to provide food to the growing population in the region continues to pose a major challenge, as arable land is limited and per capita arable land is decreasing in most of the Asian countries. This also encourages the application of fertilizer additives. Moreover, increasing farm expenditure has led to the increased market growth of fertilizer additives in this region.
Rising demand for agricultural commodities and increasing R&D activities in fertilizer manufacturing technology to drive the growth of the fertilizer additives market
Urea
Urea has the highest nitrogen content as compared to all solid fertilizers. It is a widely used source of fertilizer nitrogen globally. The critical relative humidity of urea is high compared to the ammonium nitrate and calcium ammonium nitrate (CAN). Due to this, it can withstand hot and humid climate conditions. Generally, granular urea has enhanced handling properties compared to prilled urea. Granular urea is resistant to degradation and crushing. Up to 0.3% moisture content of urea is ideal to avoid problems such as caking. Moisture content above 0.3% results in the deterioration of urea during storage.
Ammonium nitrate
Ammonium nitrate is the most widely used source of fertilizer nitrogen. Half of the nitrogen present in ammonium nitrate is in the ammoniacal form and half in the nitrate form. Granular ammonium nitrate has enhanced handling properties and is resistant to degradation and crushing. However, prilled ammonium nitrate is prone to considerable degradation and particle crushing when overused.
Diammonium phosphate
Diammonium phosphate (DAP) is a granular fertilizer, which is a widely used source of phosphorus in the world. It has enhanced handling properties and is fairly resistant to degradation and crushing particles during handling. The moisture content of DAP varies between 1% and 2% depending on its source material. Less caking and other physical problems were observed while storing DAP due to low moisture level.
Critical questions the report answers:
- Where will all these developments take the industry in the mid to long term?
- What are the upcoming types of fertilizer additives?
The growth of the organic fertilizers industry is a major factor restraining the market growth. The increasing awareness about health and wellness, the growing organic food industry, and significant increase in the cost of chemicals are factors that are fueling the growth of the global biofertilizers market. In addition, the affordable cost of biofertilizers, increasing focus on sustainable farming, rising government support, and environmental regulations are driving the biofertilizers market globally.
Biofertilizers witnesses a significant demand attributed to its properties such as integrated nutrient management, cost-effectiveness, and renewable sources of plant nutrients to supplement chemical fertilizers for sustainable agriculture. Organic fertilizers are environment-friendly and do not have an adverse impact on human health. Due to the growing awareness about the adverse impact of synthetic fertilizers, preference for biofertilizers is projected to remain low. However, increasing dependence of fertilizer additives on the production of synthetic fertilizers is projected to inhibit the market growth.
Key players in the market include Clariant Mining Solutions (Switzerland), KAO Corporation (Japan), Novochem Group (Netherlands), and ArrMaz (US). Other players such as Filtra Catalysts & Chemicals Ltd. (India), Amit Trading LTD. (Israel), Chemipol (Spain), Michelman (US), Tolsa Group (Spain), and Forbon Technology (China). These players are increasingly undertaking expansions and acquisitions to expand their market reach and increase product line.
To speak to our analyst for a discussion on the above findings, click Speak to Analyst
 Exclusive indicates content/data unique to MarketsandMarkets and not available with any competitors.
Table of Contents
1 Introduction (Page No. - 14)
1.1 Objectives of the Study
1.2 Market Definition
1.3 Study Scope
1.3.1 Periodization
1.4 Currency
1.5 Stakeholders
1.6 Limitations
2 Research Methodology (Page No. - 17)
2.1 Research Data
2.1.1 Secondary Data
2.1.1.1 Key Data From Secondary Sources
2.1.2 Primary Data
2.1.2.1 Key Data From Primary Sources
2.1.2.2 Key Industry Insights
2.1.2.3 Breakdown of Primary Interviews
2.2 Market Size Estimation
2.2.1 Bottom-Up Approach
2.2.2 Top-Down Approach
2.3 Market Breakdown & Data Triangulation
2.4 Research Assumptions
2.4.1 Assumptions
3 Executive Summary (Page No. - 25)
4 Premium Insights (Page No. - 29)
4.1 Attractive Opportunities in this Market
4.2 Fertilizer Additives Across Different Regions
4.3 Fertilizer Additives Market Potential
4.4 Fertilizer Additives Life Cycle Analysis, By Region
5 Market Overview (Page No. - 33)
5.1 Introduction
5.2 Macro Indicators
5.2.1 Growing Population and Decreasing Arable Land
5.2.2 Increasing Farm Expenditure
5.3 Market Segmentation
5.3.1 By Function
5.3.2 By Application
5.3.3 By Form of Application
5.4 Market Dynamics
5.4.1 Drivers
5.4.1.1 Rising Demand for Agricultural Commodities
5.4.1.2 Research & Development in Fertilizer Manufacturing Technology
5.4.1.3 Ease of Application and Handling of Fertilizers
5.4.2 Restraints
5.4.2.1 Growth of Organic Fertilizers Industry
5.4.2.2 Environmental Impact of Chemical Fertilizers
5.4.3 Opportunities
5.4.3.1 Growth Potential in Emerging Countries
5.4.4 Challenges
5.4.4.1 Adverse Effects of Agrochemicals on Human Health
5.4.4.2 Stringent Regulations
6 Industry Trends (Page No. - 42)
6.1 Value Chain Analysis
6.2 Supply Chain Analysis
6.2.1 Prominent Companies
6.2.2 Small & Medium Enterprises
6.3 Porter’s Five Forces Analysis
6.3.1 Intensity of Competitive Rivalry
6.3.2 Bargaining Power of Suppliers
6.3.3 Bargaining Power of Buyers
6.3.4 Threats of New Entrants
6.3.5 Threats of Substitutes
7 Fertilizer Additives Market, By Function (Page No. - 48)
7.1 Introduction
7.2 Anticaking Agents
7.3 Dedusting Agent
7.4 Antifoaming Agent
7.5 Hydrophobic Agent
7.6 Corrosion Inhibitors
8 Fertilizer Additives Market, By Application (Page No. - 59)
8.1 Introduction
8.2 Urea
8.3 Ammonium Nitrate
8.4 Diammonium Phosphate
8.5 Monoammonium Phosphate (MAP)
8.6 Ammonium Sulfate
8.7 Triple Super Phosphate
9 Fertilizer Additives Market, By Form of Application (Page No. - 72)
9.1 Introduction
9.2 Granular Fertilizers
9.3 Prilled Fertilizers
9.4 Powdered Fertilizers
10 Fertilizer Additives Market, By Region (Page No. - 79)
10.1 Introduction
10.2 North America
10.2.1 U.S.
10.2.2 Canada
10.2.3 Mexico
10.3 Europe
10.3.1 Russia
10.3.2 Germany
10.3.3 Spain
10.3.4 France
10.3.5 Italy
10.3.6 U.K.
10.3.7 Rest of Europe
10.4 Asia-Pacific
10.4.1 China
10.4.2 India
10.4.3 Japan
10.4.4 Australia
10.4.5 Rest of Asia-Pacific
10.5 Latin America
10.5.1 Brazil
10.5.2 Argentina
10.5.3 Rest of Latin America
10.6 Rest of the World
10.6.1 South Africa
11 Competitive Landscape (Page No. - 122)
11.1 Overview
11.2 Competitive Situation & Trends
11.2.1 Recent Developments
12 Company Profiles (Page No. - 124)
(Company at A Glance, Recent Financials, Products & Services, Strategies & Insights, & Recent Developments)*
12.1 Introduction
12.2 Clariant
12.3 KAO Corporation
12.4 Novochem Group
12.5 Filtra Catalysts & Chemicals Ltd.
12.6 Amit Trading Ltd.
12.7 Arrmaz
12.8 Chemipol
12.9 Forbon Technology
12.10 Michelman
12.11 Tolsa Group
*Details on Company at A Glance, Recent Financials, Products & Services, Strategies & Insights, & Recent Developments Might Not Be Captured in Case of Unlisted Companies.
13 Appendix (Page No. - 141)
13.1 Discussion Guide
13.2 Knowledge Store: Marketsandmarkets’ Subscription Portal
13.3 Introducing RT: Real Time Market Intelligence
13.4 Available Customizations
13.5 Related Reports
List of Tables (105 Tables)
Table 1 Fertilizer Additives Market Size, By Function, 2014–2021 (USD Million)
Table 2 Market Size, By Function, 2014–2021 (KT)
Table 3 Anticaking Agents Market Size, By Region, 2014–2021 (USD Million)
Table 4 Anticaking Agents Market Size, By Region, 2014–2021 (KT)
Table 5 Dedusting Agents Market Size, By Region, 2014–2021 (USD Million)
Table 6 Dedusting Agents Market Size, By Region, 2014–2021 (KT)
Table 7 Antifoaming Agents Market Size, By Region, 2014–2021 (USD Million)
Table 8 Antifoaming Agents Market Size, By Region, 2014–2021 (KT)
Table 9 Hydrophobic Agents Market Size, By Region, 2014–2021 (USD Million)
Table 10 Hydrophobic Agents Market Size, By Region, 2014–2021 (KT)
Table 11 Corrosion Inhibitors Market Size, By Region, 2014–2021 (USD Million)
Table 12 Corrosion Inhibitors Market Size, By Region, 2014–2021 (KT)
Table 13 Fertilizer Additives Market Size, By Application, 2014-2021 (USD Million)
Table 14 Market Size, By Application, 2014-2021 (KT)
Table 15 Market Size for Urea, By Region, 2014-2021 (USD Million)
Table 16 Market Size for Urea, By Region, 2014-2021 (KT)
Table 17 Fertilizer Additives Market Size for Ammonium Nitrate, By Region, 2014-2021 (USD Million)
Table 18 Market Size for Ammonium Nitrate, By Region, 2014-2021 (KT)
Table 19 Market Size for Diammonium Phosphate, By Region, 2014-2021 (USD Million)
Table 20 Market Size for Diammonium Phosphate, By Region, 2014-2021 (KT)
Table 21 Fertilizer Additives Market Size for Monoammonium Phosphate, By Region, 2014-2021 (USD Million)
Table 22 Fertilizer Additives Market Size for Monoammonium Phosphate, By Region, 2014-2021 (KT)
Table 23 Market Size for Ammonium Sulfate, By Region, 2014-2021 (USD Million)
Table 24 Market Size for Ammonium Sulfate, By Region, 2014-2021 (KT)
Table 25 Fertilizer Additives Market Size for Triple Super Phosphate, By Region, 2014-2021 (USD Million)
Table 26 Market Size for Triple Super Phosphate, By Region, 2014-2021 (KT)
Table 27 Fertilizer Additives Market Size, By Form of Application, 2014–2021 (USD Million)
Table 28 Market Size, By Form of Application, 2014–2021 (KT)
Table 29 Granular Fertilizer Additives Market Size, By Region, 2014–2021 (USD Million)
Table 30 Granular Fertilizer Additives Market Size, By Region, 2014–2021 (KT)
Table 31 Prilled Fertilizer Additives Market Size, By Region, 2014–2021 (USD Million)
Table 32 Prilled Fertilizer Additives Market Size, By Region, 2014–2021 (KT)
Table 33 Powdered Fertilizer Additives Market Size, By Region, 2014–2021 (USD Million)
Table 34 Powdered Fertilizer Additives Market Size, By Region, 2014–2021 (KT)
Table 35 Fertilizer Additives Market Size, By Region, 2014–2021 (USD Million)
Table 36 Fertilizer Additives Market Size, By Region, 2014–2021 (KT)
Table 37 North America: Fertilizer Additives Market Size, By Form of Application, 2014–2021 (USD Million)
Table 38 North America: Market Size, By Form of Application, 2014–2021 (KT)
Table 39 North America: Market Size, By Application, 2014–2021 (USD Million)
Table 40 North America: Market Size, By Application, 2014–2021 (KT)
Table 41 North America: Market Size, By Country, 2014–2021 (USD Million)
Table 42 North America: Market Size, By Country, 2014–2021 (KT)
Table 43 U.S.: Fertilizer Additives Market Size, By Application, 2014–2021 (USD Million)
Table 44 U.S.: Market Size, By Application, 2014–2021 (KT)
Table 45 Canada: Fertilizer Additives Market Size, By Application, 2014–2021 (USD Million)
Table 46 Canada: Market Size, By Application, 2014–2021 (KT)
Table 47 Mexico: Fertilizer Additives Market Size, By Application, 2014–2021 (USD Million)
Table 48 Mexico: Market Size, By Application, 2014–2021 (KT)
Table 49 Europe: Fertilizer Additives Market Size, By Form of Application, 2014-2021 (USD Million)
Table 50 Europe: Market Size, By Form of Application, 2014-2021 (KT)
Table 51 Europe: Market Size, By Application, 2014-2021 (USD Million)
Table 52 Europe: Market Size, By Application, 2014-2021 (KT)
Table 53 Europe: Market Size, By Country, 2014-2021 (USD Million)
Table 54 Europe: Market Size, By Country, 2014-2021 (KT)
Table 55 Russia: Fertilizer Additives Market Size, By Application, 2014-2021 (USD Million)
Table 56 Russia: Market Size, By Application, 2014-2021 (KT)
Table 57 Germany: Fertilizer Additives Market Size, By Application, 2014-2021 (USD Million)
Table 58 Germany: Market Size, By Application, 2014-2021 (KT)
Table 59 Spain: Fertilizer Additives Market Size, By Application, 2014-2021 (USD Million)
Table 60 Spain: Market Size, By Application, 2014-2021 (KT)
Table 61 France: Fertilizer Additives Market Size, By Application, 2014-2021 (USD Million)
Table 62 France: Market Size, By Application, 2014-2021 (KT)
Table 63 Italy: Fertilizer Additives Market Size, By Application, 2014-2021 (USD Million)
Table 64 Italy: Market Size, By Application, 2014-2021 (KT)
Table 65 U.K.: Fertilizer Additives Market Size, By Application, 2014-2021 (USD Million)
Table 66 U.K.: Market Size, By Application, 2014-2021 (KT)
Table 67 Rest of Europe: Fertilizer Additives Market Size, By Application, 2014-2021 (USD Million)
Table 68 Rest of Europe: Market Size, By Application, 2014-2021 (KT)
Table 69 Asia-Pacific: Fertilizer Additives Market Size, By Form of Application, 2014–2021 (USD Million)
Table 70 Asia-Pacific: Market Size, By Form of Application, 2014–2021 (KT)
Table 71 Asia-Pacific: Market Size, By Application, 2014–2021 (USD Million)
Table 72 Asia-Pacific: Market Size, By Application, 2014–2021 (KT)
Table 73 Asia-Pacific: Market Size, By Country, 2014–2021 (USD Million)
Table 74 Asia-Pacific: Market Size, By Country, 2014–2021 (KT)
Table 75 China: Fertilizer Additives Market Size, By Application, 2014–2021 (USD Million)
Table 76 China: Market Size, By Application, 2014–2021 (KT)
Table 77 India: Fertilizer Additives Market Size, By Application, 2014–2021 (USD Million)
Table 78 India: Market Size, By Application, 2014–2021 (KT)
Table 79 Japan: Fertilizer Additives Market Size, By Application, 2014–2021 (USD Million)
Table 80 Japan: Market Size, By Application, 2014–2021 (KT)
Table 81 Australia: Fertilizer Additives Market Size, By Application, 2014–2021 (USD Million)
Table 82 Australia: Market Size, By Application, 2014–2021 (KT)
Table 83 Rest of Asia-Pacific: Fertilizer Additives Market Size, By Application, 2014–2021 (USD Million)
Table 84 Rest of Asia-Pacific: Market Size, By Application, 2014–2021 (KT)
Table 85 Latin America: Fertilizer Additives Market Size, By Form of Application, 2014–2021 (USD Million)
Table 86 Latin America: Market Size, By Form of Application, 2014–2021 (KT)
Table 87 Latin America: Market Size, By Application, 2014–2021 (USD Million)
Table 88 Latin America: Market Size, By Application, 2014–2021 (KT)
Table 89 Latin America: Market Size, By Country, 2014–2021 (USD Million)
Table 90 Latin America: Market Size, By Country, 2014–2021 (KT)
Table 91 Brazil: Fertilizer Additives Market Size, By Application, 2014–2021 (USD Million)
Table 92 Brazil: Market Size, By Application, 2014–2021 (KT)
Table 93 Argentina: Fertilizer Additives Market Size, By Application, 2014–2021 (USD Million)
Table 94 Argentina: Market Size, By Application, 2014–2021 (KT)
Table 95 Rest of Latin America: Fertilizer Additives Market Size, By Application, 2014–2021 (USD Million)
Table 96 Rest of Latin America: Market Size, By Application, 2014–2021 (KT)
Table 97 RoW: Fertilizer Additives Market Size, By Form of Application, 2014–2021 (USD Million)
Table 98 RoW: Market Size, By Form of Application, 2014–2021 (KT)
Table 99 RoW: Market Size, By Application, 2014–2021 (USD Million)
Table 100 RoW: Market Size, By Application, 2014–2021 (KT)
Table 101 RoW: Market Size, By Country, 2014–2021 (USD Million)
Table 102 RoW: Market Size, By Country, 2014–2021 (KT)
Table 103 South Africa: Fertilizer Additives Market Size, By Application, 2014–2021 (USD Million)
Table 104 South Africa: Market Size, By Application, 2014–2021 (KT)
Table 105 Recent Developments, 2011–2016
List of Figures (48 Figures)
Figure 1 Market Segmentation
Figure 2 Research Design
Figure 3 Market Size Estimation Methodology: Bottom-Up Approach
Figure 4 Market Size Estimation Methodology: Top-Down Approach
Figure 5 Data Triangulation
Figure 6 Assumptions of the Study
Figure 7 Fertilizer Additives Market, By Function, 2016 vs 2021 (USD Million)
Figure 8 Market, By Application, 2016 vs 2021 (USD Million)
Figure 9 Fertilizer Additives Market, By Form of Application, 2016 vs 2021 (USD Million)
Figure 10 Market Share, By Region, 2015
Figure 11 Growing Demand for Fertilizers to Drive the Global Market
Figure 12 Asia-Pacific Dominated the Global Market in 2015
Figure 13 China is Projected to Grow at the Highest CAGR in Asia-Pacific Region
Figure 14 Asia-Pacific to Grow at the Highest CAGR During the Forecast Period
Figure 15 Global Population Projected to Reach ~9.5 Billion By 2050
Figure 16 Decrease in Per Capita Arable Land
Figure 17 Fertilizer Additives Market, By Function
Figure 18 Market, By Application
Figure 19 Market, By Form of Application
Figure 20 Feed Additives: Drivers, Restraints, Opportunities, Challenges
Figure 21 Research and Product Development Contribute the Most to the Value of the Fertilizer Additive Products
Figure 22 Supply Chain for Fertilizer Additives
Figure 23 Porter’s Five Forces Analysis: Fertilizer Additives Market
Figure 24 Fertilizer Additives Market Size, By Function, 2016 vs 2021 (USD Million)
Figure 25 Anticaking Agents Market Size, By Region, 2016 vs 2021 (USD Million)
Figure 26 Dedusting Agents Market Size, By Region, 2016 vs 2021 (USD Million)
Figure 27 Antifoaming Agents Market Size, By Region, 2016 vs 2021 (USD Million)
Figure 28 Hydrophobic Agents Market Size, By Region, 2016 vs 2021 (USD Million)
Figure 29 Corrosion Inhibitors Market Size, By Region, 2016 vs 2021 (USD Million)
Figure 30 Fertilizer Additives Market Size, By Application, 2016 vs 2021 (USD Million)
Figure 31 Market Size for Urea, By Region, 2016 vs 2021 (USD Million)
Figure 32 Market Size for Ammonium Nitrate, By Region, 2016 vs 2021 (USD Million)
Figure 33 Market Size for Diammonium Phosphate, By Region, 2016 vs 2021 (USD Million)
Figure 34 Market Size for Monoammonium Phosphate, By Region, 2016 vs 2021 (USD Million)
Figure 35 Market Size for Ammonium Sulfate, By Region, 2016 vs 2021 (USD Million)
Figure 36 Market Size for Triple Super Phosphate, By Region, 2016 vs 2021 (USD Million)
Figure 37 Overview: Fertilizer Additives Market Size, By Form of Application, 2016 & 2021 (USD Million)
Figure 38 Overview: Granular Fertilizer Additives Market Size, By Region, 2016 & 2021 (USD Million)
Figure 39 Overview: Prilled Fertilizer Additives Market Size, By Region, 2016 & 2021 (USD Million)
Figure 40 Overview: Powdered Fertilizer Additives Market Size, By Region, 2016 & 2021 (USD Million)
Figure 41 Fertilizer Additives Market Size, By Region, 2016 vs 2021 (USD Million)
Figure 42 North American Snapshot
Figure 43 Europe Fertilizer Additives Market: Snapshot
Figure 44 Asia-Pacific Fertilizer Additives Market: Snapshot
Figure 45 Clariant: Company Snapshot
Figure 46 Clariant: SWOT Analysis
Figure 47 KAO Corporation: Company Snapshot
Figure 48 KAO Corporation: SWOT Analysis


Growth opportunities and latent adjacency in Fertilizer Additives Market