The study used four major activities to estimate the market size of the occupancy sensor. Exhaustive secondary research was conducted to gather information on the market and its peer and parent markets. The next step was to validate these findings, assumptions, and sizing with industry experts across the value chain through primary research. Both top-down and bottom-up approaches were employed to estimate the total market size. Finally, market breakdown and data triangulation methods were utilized to estimate the market size for different segments and subsegments.
Secondary Research
The research methodology used to estimate and forecast the size of the occupancy sensor market began with the acquisition of data related to the revenues of key vendors in the market through secondary research. Various secondary sources have been referred to in the secondary research process for identifying and collecting information for this study. Secondary sources include annual reports, press releases, and investor presentations of companies; white papers, journals, certified publications, and articles by recognized authors; websites; directories; and databases. Secondary research has mainly been used to obtain key information about the value chain of the occupancy sensor market, key players, market classification, and segmentation according to the industry trends to the bottom-most level, geographic markets, and key developments from both market and technology-oriented perspectives. Secondary data has been collected and analyzed to determine the overall market size, further validated through primary research. The secondary research referred to for this research study involves the Semiconductor Industry Association (SIA), Electronic System Design Alliance (ESD Alliance), Institute of Electrical and Electronics Engineers (IEEE), Taiwan Semiconductor Industry Association (TSIA), European Semiconductor Industry Association (ESIA), and Korea Semiconductor Industry Association (KSIA). Moreover, the study involved extensive use of secondary sources, directories, and databases, such as Hoovers, Bloomberg Businessweek, Factiva, and OneSource, to identify and collect valuable information for a technical, market-oriented, and commercial study of the occupancy sensor market. Vendor offerings have been taken into consideration to determine market segmentation.
Primary Research
In the primary research, various primary sources from both the supply and demand sides have been interviewed to obtain the qualitative and quantitative information relevant to this report. Primary sources from the supply side include the key industry participants, subject-matter experts (SMEs), and C-level executives and consultants from various key companies and organizations in the occupancy sensor ecosystem. After the complete market engineering (including calculations for the market statistics, the market breakdown, the market size estimations, the market forecasting, and the data triangulation), extensive primary research has been conducted to verify and validate the critical market numbers obtained. Extensive qualitative and quantitative analyses have been performed during the market engineering process to list key information/insights throughout the report. Extensive primary research has been conducted after understanding the occupancy sensor market scenario through secondary research. Several primary interviews have been conducted with market experts from the demand and supply-side players across key regions, namely, North America, Europe, Asia Pacific, and the Rest of the World (Middle East, Africa, and South America). Various primary sources from both the supply and demand sides of the market have been interviewed to obtain qualitative and quantitative information. Following is the breakdown of the primary respondents.
Primary data has been collected through questionnaires, emails, and telephonic interviews. In the canvassing of primaries, various departments within organizations, such as sales, operations, and administration, were covered to provide a holistic viewpoint in our report. After interacting with industry experts, brief sessions were conducted with highly experienced independent consultants to reinforce the findings from our primaries. This and the in-house subject matter experts’ opinions have led us to the findings described in the remainder of this report.
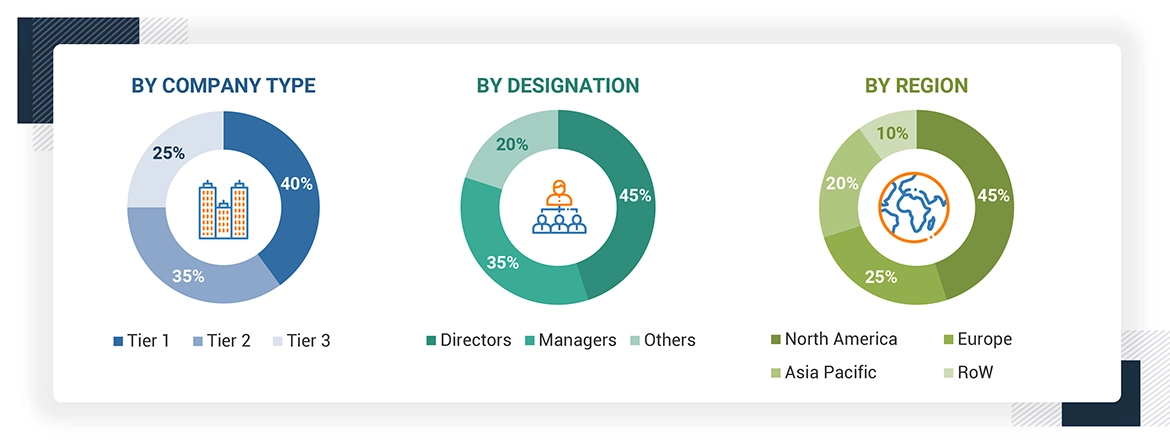
Note: The three tiers of the companies are defined based on their total revenue in 2023: Tier 1 - revenue greater than or equal to USD 1 billion; Tier 2 - revenue between USD 100 million and USD 1 billion; and Tier 3 revenue less than or equal to USD 100 million. Other designations include sales managers, marketing managers, and product managers.
About the assumptions considered for the study, To know download the pdf brochure
Market Size Estimation
To estimate and validate the size of the occupancy sensor market and its submarkets, both top-down and bottom-up approaches were utilized. Secondary research was conducted to identify the key players in the market, and primary and secondary research was used to determine their market share in specific regions. The entire process involved studying top players' annual and financial reports and conducting extensive interviews with industry leaders such as CEOs, VPs, directors, and marketing executives. Secondary sources were used to determine all percentage shares and breakdowns, which were verified through primary sources. All parameters that could impact the markets covered in this research study were accounted for, analyzed in detail, verified through primary research, and consolidated to obtain the final quantitative and qualitative data.
Occupancy Sensor Market : Top-Down and Bottom-Up Approach
Data Triangulation
Once the overall size of the occupancy sensor market was determined using the methods described above, it was divided into multiple segments and subsegments. Market engineering was performed for each segment and subsegment using market breakdown and data triangulation methods, as applicable, to obtain accurate statistics. To triangulate the data, various factors and trends from the demand and supply sides were studied. The market was validated using both top-down and bottom-up approaches.


 HIGHEST CAGR MARKET IN 2030
 CHINA FASTEST-GROWING MARKET IN THE REGION


Jan, 2015
Dear Ms./Sir, we are interested in Microwave sensor and Occupancy Sensor Market Technology. .
Ingar
Nov, 2015
Does this report tell me volume split of occupancy sensors for each technology? Does the report also split into technologies used for occupancy sensing vs application?.
Michael
Oct, 2016
I am interested to purchase only the market share for the occupancy sensors report. How much would be the cost?.