In-mold labels Market By Technology (Injection Molding, Extrusion, Thermoforming), by Material (PP, PE, ABS, PVC, Others), by Printing Technology (Flexographic, Offset, Gravure), by Printing inks, by End Use (Food & Beverage, Consumer Durables, Automotive) & By Region - Forecast to 2020


[223 Pages Report] The market for in-mold labels is projected to grow from USD 2.58 Billion in 2015 to reach USD 3.23 Billion by 2020, at a CAGR of 4.54%. The report aims at estimating the market size and future growth potential of the in-mold labels market across different segments such as material, technology, end use, printing technologies, printing inks, and region. Globally, competition in the in-mold labels market is growing considerably owing to the improvement in labeling technologies such as 3D printing and thermoforming. Label convertors are keen on developing innovative labeling solutions that can withstand harsh weather conditions such as extreme temperature and abrasion. The base year considered for the study is 2014 and the market size is projected from 2015 to 2020.
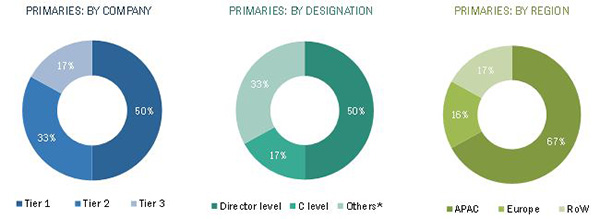
The research methodology used to estimate and forecast the market size included the top-down approach. The total market size of the in-mold labels was calculated, and accordingly, the percentage was allotted to different sectors in each of the segments. This allotment and calculation was done on the basis of extensive primary interviews and secondary research. Primary research involved in this report includes extensive interviews with key people such as CEOs, VPs, directors, and executives. After arriving at the overall market size, the total market was split into several segments and sub segments. These data triangulation and market breakdown procedures were employed to complete the overall market engineering process and arrive at the exact statistics for all segments and sub segments. The breakdown of profiles of primary respondents is depicted in the figure below.
The in-mold labels ecosystem comprises in-mold labels manufacturers and vendors such as CCL Industries Inc. (Canada), Constantia Flexibles Group GmbH (Austria), Huhtamaki Group (Finland), Coveris Holding S.A. (U.S.), Cenveo, Inc. (U.S.), and government and national associations such as IMDA, which helps the manufacturers in the development and growth of in-mold label products, technologies and markets.
Target Audience
- In-mold label manufacturers
- Government and research organizations
- National and local government organizations
- Institutional investors
- In-Mold Decorating Association (IMDA)
Scope of the Report
The research report segments in-mold labels into the following submarkets:
By Material:
- Polypropylene
- Polyethylene
- Polyvinyl chloride
- ABS resins
- Others (polyethylene terephthalate, polyvinylidene chloride (PVdC), polycarbonate, and synthetic papers)
By Technology:
- Extrusion blow-molding process
- Injection molding process
- Thermoforming
By End Use:
- Personal care
- Consumer durables
- Food & beverage
- Automotive
- Others (medical and laboratory, paints, etc.)
By Printing Technologies
- Flexographic printing
- Offset printing
- Gravure printing
- Digital printing
- Others (screen printing and letterpress methods)
By Printing Inks
- UV curable inks
- Thermal cured inks
- Water-soluble inks
- Others (high melt-resistant inks)
By Region:
- North America
- Europe
- Asia-Pacific
- RoW
Available Customizations
With the given market data, MarketsandMarkets offers customizations as per the client-specific needs. The following customization options are available for the report:
Product Analysis
- Product matrix which gives a detailed comparison of the market for different recycled product types
Geographic Analysis
- Further analysis of in-mold labels market for additional countries
Company Information
- Detailed analysis and profiling of additional market players (up to 5).
MarketsandMarkets projects that the market for in-mold labels is projected to grow from USD 2.58 Billion in 2015 to USD 3.23 Billion by 2020, at a CAGR of 4.54%. The market for in-mold labels is growing due to innovative developments in the industrial sectors, growth in the food & beverage industry, and rising demand for eco-friendly and high-performing labels. Increasing awareness among consumers about the sustainable labels and their pace of adopting products is one of the biggest factors that led to the increase in the demand of in-mold labels, especially in the emerging Asia-Pacific and Latin American regions.
The in-mold labels market is segmented on the basis of material, technology, end use, printing technologies, printing inks, and region. On the basis of material, polypropylene (PP) held the largest market share, in terms of both volume and value. It has become an essential labeling material because of its effective moisture-resistant properties. It is used in in-mold labeling of various consumer and industrial products such as foods, bar code labels, and retail labels.
Injection molding technology was the most widely used in-mold labels manufacturing process among other technologies, in terms of both volume and value. The majority of in-mold labels are used in injection molding applications as they help in providing a three-dimensional effect to the labels on various products such as food & beverages, cosmetics, and automotive parts.
Based on printing technologies, flexographic printing held the largest market share. This printing technology allows printing on a wide variety of both porous and nonporous surfaces making it easier to mold various kinds of polymers. On the basis of printing inks, UV curable inks held the largest market share, in terms of both volume and value. The reason for this dominance is its chemical- and abrasion-resistant properties as the in-mold labelling process is carried out under high temperatures.
On the basis of end use, the market is segmented into personal care, consumer durables, food & beverage, and automotive. The food & beverage segment accounted for the largest market share in 2014. This growth is attributed to the increasing consumer awareness about the trends related to packaged food and the rising consumption of containers and bottled packaging.
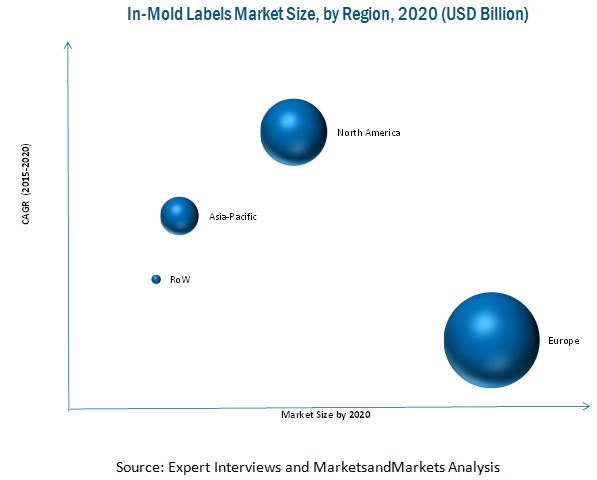
On the basis of key regions, the market for in-mold labels is segmented into North America, Europe, Asia-Pacific, and the Rest of the World (RoW). North America is projected to grow at the highest rate from 2015 to 2020, due to presence of key players in the market and the changing government policies about sustainable labels which has impacted the performance of the in-mold labels market.
Mergers & acquisitions was the major strategy adopted by most players in the market. Companies such as CCL Industries Inc. (Canada), Constantia Flexibles Group GmbH (Austria), Huhtamaki Group (Finland), Coveris Holding S.A. (U.S.), Cenveo, Inc. (U.S.), Fuji Seal International, Inc. (Japan), and Multicolor Corporation (U.S.) were the key players who adopted this strategy to increase their geographic reach and product offerings, to increase the customer base, and to stay ahead of competitors. Companies aim to serve the market efficiently by investing in research & development activities and introducing new products to keep up with changing consumer wants and needs.
There are certain factors prevailing in the market that hinder the growth of this industry. Lack of awareness about various types of labeling techniques factors in decreasing the demand for this type of labels. Varying environmental mandates in terms of printing on labels across different regions, and increasing cost of raw materials are significant challenges faced by manufacturers in this market.
 Exclusive indicates content/data unique to MarketsandMarkets and not available with any competitors.
Table of Contents
1 Introduction (Page No. - 23)
1.1 Objectives of the Study
1.2 Market Definition
1.3 Study Scope
1.3.1 Periodization Considered for This Study
1.4 Currency Considered for This Study
1.5 Units Considered for This Study
1.6 Stakeholders
2 Research Methodology (Page No. - 26)
2.1 Research Data
2.1.1 Secondary Data
2.1.1.1 Key Data From Secondary Sources
2.1.2 Primary Data
2.1.2.1 Key Data From Primary Sources
2.1.2.2 Breakdown of Primary Interviews
2.2 Factor Analysis
2.2.1 Introduction
2.2.2 Demand-Side Analysis
2.2.2.1 Economic Factors
2.2.2.2 Growth in Packaging Market
2.2.2.3 Growth in the Manufacturing Sector
2.2.3 Supply-Side Analysis
2.2.3.1 Industry Regulations
2.2.3.2 Technology and Science
2.3 Market Size Estimation
2.4 Market Breakdown & Data Triangulation
2.5 Research Assumptions & Limitations
2.5.1 Assumptions
2.5.2 Limitations
3 Executive Summary (Page No. - 39)
3.1 Introduction
3.1.1 Factors Driving the In-Mold Labels Market
3.2 Evolution of In-Mold Labels
3.3 In-Mold Labels Market Size, By Material, 2015 vs 2020 (USD Million)
3.4 Market Size, By Region, 2015 vs 2020 (USD Million)
3.5 Country-Wise Growth Rates From 2015 to 2020
3.6 Strategies Adopted By Leading Market Players From 2011 to 2015
4 Premium Insights (Page No. - 44)
4.1 Attractive Market Opportunities in the In-Mold Labels Market
4.2 End Uses of In-Mold Labels
4.3 In-Mold Labels Market in the Asia-Pacific Region, 2015
4.4 Country Wise Growth Rates From 2015 to 2020
4.5 Region Wise Market Share in 2014
4.6 Emerging Markets vs Developed Markets
4.7 Printing Inks Used for In-Mold Labeling
4.8 In-Mold Labels Market Life Cycle Analysis, By Region
5 Market Overview (Page No. - 51)
5.1 Introduction
5.2 Evolution of In-Mold Labels Market
5.3 Market Segmentation
5.4 Market Dynamics
5.4.1 Drivers
5.4.1.1 Increasing Demand for Packaged Foods & Beverages
5.4.1.2 Increasing Demand for Labels Providing Efficient Brand Recognition to Product
5.4.1.3 Growing Demand for Environment-Friendly Labels
5.4.1.4 Companies Opting for In-Mold Labeling Due to Increased Manufacturing Efficiencies
5.4.2 Restraints
5.4.2.1 Recent Increase in Prices of Raw Materials
5.4.2.2 Increasing Use of Printed Label Description Labeling
5.4.3 Opportunities
5.4.3.1 Increasing Demand From France and Germany
5.4.4 Challenges
5.4.4.1 Balancing Performance to Cost
5.4.4.2 Varying Environmental Mandates Across Regions
5.4.4.3 Designing Customer-Specific Labels
5.4.4.4 Difficulty in Managing Supply Chain
6 Industry Trends (Page No. - 60)
6.1 Introduction
6.2 Value Chain
6.3 Porter�s Five Forces Analysis
6.3.1 Threat of New Entrants
6.3.2 Threats of Substitutes
6.3.3 Bargaining Power of Suppliers
6.3.4 Bargaining Power of Buyers
6.3.5 Intensity of Competitive Rivalry
6.4 Average Price Analysis
6.4.1 In-Mold Labels Market, Average Price Analysis, By Region
6.4.2 Market, Average Price Analysis, By Technology
6.4.3 Market, Average Price Analysis, By End Use
6.4.4 Market, Average Price Analysis, By Material
7 In-Mold Labels Market, By Technology (Page No. - 68)
7.1 Introduction
7.1.1 In-Mold Labels Market, By Technology
7.1.1.1 Injection Molding Process Dominated the In-Mold Labels Market, By Technology, in 2014
7.2 Extrusion Blow-Molding Process
7.2.1 Extrusion Blow-Molding Process Market, By End Use
7.2.1.1 Food & Beverage Dominated the Extrusion Blow-Molding Process Market, By End Use, in 2014
7.2.2 Extrusion Blow-Molding Process Market, By Material
7.2.2.1 PE Dominated the Extrusion Blow-Molding Process Market, By Material, in 2014
7.2.3 Extrusion Blow-Molding Process Market, By Printing Technology
7.2.3.1 Flexographic Printing Dominated the Extrusion Blow-Molding Process Market, By Printing Technology, in 2014
7.3 Injection Molding Process
7.3.1 Injection Molding Process Market, By End Use
7.3.1.1 Food & Beverage Dominated the Injection Molding Process Market, By End Use, in 2014
7.3.2 Injection Molding Process Market, By Material
7.3.2.1 PP Dominated the Injection Molding Process Market, By Material, in 2014
7.3.3 Injection Molding Process Market, By Printing Technology
7.3.3.1 Flexographic Printing Dominated the Injection Molding Process Market, By Printing Technology, in 2014
7.4 Thermoforming
7.4.1 Thermoforming Process Market, By End Use
7.4.1.1 Food & Beverage Dominated the Thermoforming Process Market, By End Use, in 2014
7.4.2 Thermoforming Process Market, By Material
7.4.2.1 PP Dominated the Thermoforming Process Market, By Material, in 2014
7.4.3 Thermoforming Process Market, By Printing Technology
7.4.3.1 Flexographic Printing Dominated the Thermoforming Process Market, By Printing Technology, in 2014
8 In-Mold Labels Market, By Material (Page No. - 82)
8.1 Introduction
8.1.1 In-Mold Labels Market Size, By Material
8.1.1.1 Polypropylene Dominated the In-Mold Labels Market, By Material, in 2014
8.2 Polypropylene (PP)
8.2.1 Polypropylene Market, By Technology
8.2.1.1 Injection Molding Technology Dominated the Polypropylene Market, By Material, in 2014
8.2.2 Polypropylene Market, By End Use
8.2.2.1 Food & Beverage Dominated the Polypropylene Market, By End Use, in 2014
8.3 Polyethylene (PE)
8.3.1 Polyethylene Market, By Technology
8.3.1.1 Injection Molding Technology Dominated the Polyethylene Market, By Material, in 2014
8.3.2 Polyethylene Market, By End Use
8.3.2.1 Food & Beverage Dominated the Polyethylene Market, By End Use, in 2014
8.4 ABS Resins
8.4.1 ABS Resins Market, By Technology
8.4.1.1 Injection Molding Technology Dominated the ABS Resins Market, By Material, in 2014
8.4.2 ABS Resins Market, By End Use
8.4.2.1 Food & Beverage Dominated the ABS Resins Market, By End Use, in 2014
8.5 Polyvinyl Chloride (PVC)
8.5.1 Polyvinyl Chloride Market, By Technology
8.5.1.1 Injection Molding Technology Dominated the Polyvinyl Chloride Market, By Material, in 2014
8.5.2 Polyvinyl Chloride Market, By End Use
8.5.2.1 Food & Beverage Dominated the Polyvinyl Chloride Market, By End Use, in 2014
8.6 Other Co-Polymers
8.6.1 Other Co-Polymers Market, By Technology
8.6.1.1 Injection Molding Technology Dominated the Other Co-Polymers Market, By Material, in 2014
8.6.2 Other Co-Polymers Market, By End Use
8.6.2.1 Food & Beverage Dominated the Other Co-Polymers Market, By End Use, in 2014
9 In-Mold Labels Market, By End Use (Page No. - 97)
9.1 Introduction
9.1.1 In-Mold Labels Market Size, By End-Use
9.1.1.1 Food & Beverage Segment Dominated the In-Mold Labels Market in 2014
9.2 Personal Care
9.3 Automotive
9.4 Food & Beverage
9.5 Consumer Durables
9.6 Others
10 In-Mold Labels Market, By Printing Technology (Page No. - 101)
10.1 Introduction
10.1.1 In-Mold Labels Market, By Printing Technology
10.1.1.1 Flexographic Printing Method Dominated the In-Mold Labels Market in 2014
10.2 Flexographic Printing
10.3 Offset Printing
10.4 Gravure Printing
10.5 Digital Printing
10.6 Others
11 In-Mold Labels Market, By Printing Ink (Page No. - 106)
11.1 Introduction
11.1.1 In-Mold Labels Market, By Printing Ink
11.1.1.1 UV Curable Inks Dominated the In-Mold Labels Market in 2014
11.2 UV Curable Inks
11.3 Water Soluble Inks
11.4 Thermal-Cure Inks
11.5 Others
12 In-Mold Labels Market, By Region (Page No. - 110)
12.1 Introduction
12.1.1 In-Mold Labels Market Size, By Region
12.1.1.1 Europe Dominated the Market for In-Mold Labels in 2014
12.2 Europe
12.2.1 Europe: In-Mold Labels Market Size, By Country
12.2.1.1 Germany Accounted for the Largest Share in the European In-Mold Labels Market
12.2.2 Europe: Market Size, By Technology
12.2.2.1 Extrusion Blow-Molding Segment to Grow at the Highest CAGR Through 2020
12.2.3 Europe: Market Size, By Material
12.2.3.1 PP Segment Accounted for the Largest Share in European In-Mold Labels Market, in 2014
12.2.4 Europe: Market Size, By End Use
12.2.4.1 Food & Beverage Segment Dominated the Market in Europe in 2014
12.2.5 Germany
12.2.5.1 Germany: Market Size, By Technology
12.2.5.1.1 Injection Molding Process Accounted for the Largest Market Share in 2014
12.2.5.2 Germany: Market Size, By Material
12.2.5.2.1 PP Segment Accounted for the Largest Market Share in 2014
12.2.5.3 Germany: Market Size, By End Use
12.2.5.3.1 Personal Care Was the Second-Largest Segment in 2014 in Germany
12.2.6 U.K.
12.2.6.1 U.K.: In-Mold Labels Market Size, By Technology
12.2.6.1.1 Extrusion Blow-Molding Process is Projected to Grow at the Highest Rate Through 2020
12.2.6.2 U.K.: Market Size, By Material
12.2.6.2.1 PE Segment to Grow at the Second-Highest Rate By 2020 in the U.K.
12.2.6.3 U.K.: Market Size, By End Use
12.2.6.3.1 Food & Beverage Segment Dominated the U.K. Market for In-Mold Labels
12.2.7 Russia
12.2.7.1 Russia: Market Size, By Technology
12.2.7.1.1 Injection Molding Technology Dominated the Market for In-Mold Labels in 2014
12.2.7.2 Russia: Market Size, By Material
12.2.7.2.1 PE Was the Second-Most Consumed Material in Russia in 2014
12.2.7.3 Russia: Market Size, By End Use
12.2.7.3.1 Personal Care Segment to Grow at A Potential Rate By 2020
12.2.8 France
12.2.8.1 France: In-Mold Labels Market Size, By Technology
12.2.8.1.1 Extrusion Blow-Molding Process is Projected to Grow at the Highest Rate By 2020
12.2.8.2 France: In-Mold Labels Market Size, By Material
12.2.8.2.1 PP Accounted for the Largest Market Share in 2014
12.2.8.3 France: Market Size, By End Use
12.2.8.3.1 Food & Beverage Segment Dominated the In-Mold Labels Market in France
12.2.9 Rest of Europe
12.2.9.1 Rest of Europe: In-Mold Labels Market Size, By Technology
12.2.9.1.1 Extrusion Blow-Molding Process to Grow at the Highest CAGR Through 2020
12.2.9.2 Rest of Europe: Market Size, By Material
12.2.9.2.1 PE Segment to Grow at the Second-Highest Rate Through 2020
12.2.9.3 Rest of Europe: Market Size, By End Use
12.2.9.3.1 Food & Beverage Segment Accounted for the Largest Share in 2014
12.3 Asia-Pacific
12.3.1 Asia-Pacific: In-Mold Labels Market Size, By Country
12.3.1.1 China Dominated the Asia-Pacific In-Mold Labels Industry in 2014
12.3.2 Asia-Pacific: Market Size, By Technology
12.3.2.1 Injection Molding Process Accounted for the Largest Market Share in 2014
12.3.3 Asia-Pacific: Market Size, By Material
12.3.3.1 PP (Polypropylene) Segment to Grow at the Highest CAGR From 2015 to 2020
12.3.4 Asia-Pacific: Market Size, By End Use
12.3.4.1 Food & Beverage Segment to Grow at the Highest Rate From 2015 to 2020
12.3.5 China
12.3.5.1 China: In-Mold Labels Market Size, By Technology
12.3.5.1.1 Injection Molding Process Accounted for the Largest Market Share in China in 2014
12.3.5.2 China: Market Size, By Material
12.3.5.2.1 Polypropylene Segment Dominated the Chinese Market in 2014
12.3.5.3 China: Market Size, By End Use
12.3.5.3.1 Personal Care Segment is Projected to Dominate the In-Mold Labels Market in China By 2020
12.3.6 Japan
12.3.6.1 Japan: In-Mold Labels Market Size, By Technology
12.3.6.1.1 Extrusion Blow-Molding Process Segment to Grow at the Highest CAGR Through 2020
12.3.6.2 Japan: Market Size, By Material
12.3.6.2.1 PP Segment is Projected to Grow at the Highest Rate From 2015 to 2020
12.3.6.3 Japan: Market Size, By End Use
12.3.6.3.1 Application of In-Mold Labels in Food& Beverage Sector Was the Highest in 2014
12.3.7 India
12.3.7.1 India: Market Size, By Technology
12.3.7.1.1 Extrusion Blow-Molding Process Projected to Grow at the Highest Rate From 2015 to 2020
12.3.7.2 India: Market Size, By Material
12.3.7.2.1 Polypropylene (PP) Segment Accounted for Largest Share in the Indian In-Mold Labels Market in 2014
12.3.7.3 India: Market Size, By End Use
12.3.7.3.1 Food & Beverage Packaging in India is Largely Driven By Growth in the Packaging Industry
12.3.8 Australia
12.3.8.1 Australia: Market Size, By Technology
12.3.8.1.1 Injection Molding Process to Grow at the Second-Highest CAGR By 2020
12.3.8.2 Australia: Market Size, By Material
12.3.8.2.1 PP Segment Accounted for Largest Market Share in 2014
12.3.8.3 Australia: Market Size, By End Use
12.3.8.3.1 Personal Care Segment Projected to Have A Potential Growth By 2020
12.3.9 Rest of Asia-Pacific
12.3.9.1 Rest of Asia-Pacific: Market Size, By Technology
12.3.9.1.1 Injection Molding Process Held the Largest Share in the Rest of Asia-Pacific
12.3.9.2 Rest of Asia-Pacific: Market Size, By Material
12.3.9.2.1 PE Was the Second-Largest Segment in 2014
12.3.9.3 Rest of Asia-Pacific: Market Size, By End Use
12.3.9.3.1 Personal Care Was the Second-Largest Industry for In-Mold Labels in 2014
12.4 North America
12.4.1 North America: In-Mold Labels Market Size, By Country
12.4.1.1 the U.S. is Projected to Be the Fastest-Growing Market By 2020
12.4.2 North America: Market Size, By Technology
12.4.2.1 Injection Molding Process to Grow at the Highest Rate By 2020
12.4.3 North America: Market Size, By Material
12.4.3.1 Polypropylene (PP) is Projected to Grow at the Highest Rate By 2020
12.4.4 North America: Market Size, By End Use
12.4.4.1 Food & Beverage Segment Dominated the End Use Market in North America
12.4.5 U.S.
12.4.5.1 U.S.: In-Mold Labels Market Size, By Technology
12.4.5.1.1 Extrusion Blow-Molding Process Dominated the U.S. Market in 2014
12.4.5.2 U.S.: Market Size, By Material
12.4.5.2.1 PP is Projected to Grow at the Highest Rate By 2020
12.4.5.3 U.S.: Market Size, By End Use
12.4.5.3.1 Food & Beverage Segment Dominated the Market in U.S. in 2014
12.4.6 Canada
12.4.6.1 Canada: In-Mold Labels Market Size, By Technology
12.4.6.1.1 Extrusion Blow-Molding Process Was the Most Widely Used Technology in 2014
12.4.6.2 Canada: Market Size, By Material
12.4.6.2.1 PE to Grow at the Second-Highest Rate in the Canadian Market
12.4.6.3 Canada: Market Size, By End Use
12.4.6.3.1 Personal Care Segment to Grow at the Second-Highest Rate By 2020
12.4.7 Mexico
12.4.7.1 Mexico: In-Mold Labels Market Size, By Technology
12.4.7.1.1 Injection Molding Process is Projected to Dominate the Market By 2020
12.4.7.2 Mexico: Market Size, By Material
12.4.7.2.1 PP to Grow at the Highest Rate in the Mexican Market
12.4.7.3 Mexico: Market Size, By End Use
12.4.7.3.1 Food & Beverage Segment to Grow at the Highest Rate By 2020
12.5 Rest of the World (RoW)
12.5.1 RoW: In-Mold Labels Market Size, By Country
12.5.1.1 Brazil Dominated the RoW In-Mold Labels Market in 2014
12.5.2 RoW: Market Size, By Technology
12.5.2.1 Injection-Molding Process to Grow at the Second-Highest Rate By 2020
12.5.3 RoW: Market Size, By Material
12.5.3.1 ABS Resins are Projected to Grow at the Second-Highest Rate By 2020
12.5.4 RoW: Market Size, By End Use
12.5.4.1 Food & Beverage Segment Dominated the RoW Market in 2014
12.5.5 Brazil
12.5.5.1 Brazil: In-Mold Labels Market Size, By Technology
12.5.5.1.1 In-Mold Labels Market in Brazil Was Dominated By Injection Molding Process in 2014
12.5.5.2 Brazil: Market Size, By Material
12.5.5.2.1 PP is Projected to Grow at the Highest CAGR By 2020
12.5.5.3 Brazil: Market Size, By End Use
12.5.5.3.1 Food & Beverage Segment Dominated the Brazilian Market for In-Mold Labels in 2014
12.5.6 South Africa
12.5.6.1 South Africa: In-Mold Labels Market Size, By Technology
12.5.6.1.1 Extrusion Blow-Molding Process Projected to Dominate the Market in South Africa By 2020
12.5.6.2 South Africa: Market Size, By Material
12.5.6.2.1 Polypropylene Segment Dominated the South African Market in 2014
12.5.6.3 South Africa: Market Size, By End Use
12.5.6.3.1 Personal Care Segment is Expected to Have Potential Growth Opportunities By 2020
12.5.7 Other Countries in RoW
12.5.7.1 Other Countries in RoW: In-Mold Labels Market Size, By Technology
12.5.7.1.1 Injection Molding Process Segment Projected to Grow at the Highest Rate By 2020
12.5.7.2 Other Countries in RoW: Market Size, By Material
12.5.7.2.1 Polyethylene (PE) Segment Accounted for the Largest Market Share in 2014
12.5.7.3 Other Countries in RoW: Market Size, By End Use
12.5.7.3.1 Personal Care Segment is Projected to Grow at the Second-Highest CAGR By 2020
13 Competitive Landscape (Page No. - 184)
13.1 Overview
13.2 Competitive Situations & Trends
13.3 Key Growth Strategies, 2011�2015
13.3.1 Mergers & Acquisitions
13.3.2 Agreements, Collaborations & Joint Ventures
13.3.3 Expansions & Investments
13.3.4 New Product Launches
14 Company Profiles (Page No. - 190)
(Company at A Glance, Business Overview, Products Offered, Key Strategy, Recent Developments, SWOT Analysis & MnM View)*
14.1 Introduction
14.2 CCL Industries, Inc.
14.3 Constantia Flexibles Group GmbH
14.4 Huhtamaki Group
14.5 Coveris Holdings S.A.
14.6 Cenveo Inc.
14.7 Fuji Seal International, Inc.
14.8 Multicolor Corporation
14.9 EVCO Plastics
14.10 Innovia Films Ltd.
14.11 Inland Label and Marketing Services, LLC
*Details on Company at A Glance, Recent Financials, Products Offered, Strategies & Insights, & Recent Developments Might Not Be Captured in Case of Unlisted Companies.
15 Appendix (Page No. - 213)
15.1 Insights of Industry Experts
15.2 Discussion Guide
15.3 Company Developments
15.3.1 Mergers & Acquisitions
15.4 Introducing RT: Real-Time Market Intelligence
15.5 Available Customizations
15.6 Related Reports
List of Tables (186 Tables)
Table 1 Changing Consumer Preferences and Development of New Technologies are the Major Drivers of the Market
Table 2 Competing Labeling Technologies May Restrain Market Growth
Table 3 Increasing Demand From France and Germany Provide Huge Opportunities for the Growth of In-Mold Labels
Table 4 Designing Customer-Specific Labels Could Be A Challenge
Table 5 In-Mold Labels Market Size, By Technology, 2013�2020 (USD Million)
Table 6 Market Size, By Technology, 2013�2020 (Million Sq. Mt.)
Table 7 Extrusion Blow-Molding Process Market Size, By End Use, 2013�2020 (USD Million)
Table 8 Extrusion Blow-Molding Process Market Size, By End Use, 2013�2020 (Million Sq. Mt.)
Table 9 Extrusion Blow-Molding Process Market Size, By Material, 2013�2020 (USD Million)
Table 10 Extrusion Blow-Molding Process Market Size, By Material, 2013�2020 (Million Sq. Mt.)
Table 11 Extrusion Blow-Molding Process Market Size, By Printing Technology, 2013�2020 (USD Million)
Table 12 Extrusion Blow-Molding Process Market Size, By Printing Technology, 2013�2020 (Million Sq. Mt.)
Table 13 Injection Molding Process Market Size, By End Use, 2013�2020 (USD Million)
Table 14 Injection Molding Process Market Size, By End Use, 2013�2020 (Million Sq. Mt.)
Table 15 Injection Molding Process Market Size, By Material, 2013�2020 (USD Million)
Table 16 Injection Molding Process Market Size, By Material, 2013�2020 (Million Sq. Mt.)
Table 17 Injection Molding Process Market Size, By Printing Technology, 2013�2020 (USD Million)
Table 18 Injection Molding Process Market Size, By Printing Technology, 2013�2020 (Million Sq. Mt.)
Table 19 Thermoforming Process Market Size, By End Use, 2013�2020 (USD Million)
Table 20 Thermoforming Process Market Size, By End Use, 2013�2020 (Million Sq. Mt.)
Table 21 Thermoforming Process Market Size, By Material, 2013�2020 (USD Million)
Table 22 Thermoforming Process Market Size, By Material, 2013�2020 (Million Sq. Mt.)
Table 23 Thermoforming Process Market Size, By Printing Technology, 2013�2020 (USD Million)
Table 24 Thermoforming Process Market Size, By Printing Technology, 2013�2020 (Million Sq. Mt.)
Table 25 In-Mold Labels Market Size, By Material, 2013�2020 (USD Million)
Table 26 In-Mold Labels Market Size, By Material, 2013�2020 (Million Sq. Mt.)
Table 27 Polypropylene Market Size, By Technology, 2013�2020 (USD Million)
Table 28 Polypropylene Market Size, By Technology, 2013�2020 (Million Sq. Mt.)
Table 29 Polypropylene Market Size, By End Use, 2013�2020 (USD Million)
Table 30 Polypropylene Market Size, By End Use, 2013�2020 (Million Sq. Mt.)
Table 31 Polyethylene Market Size, By Technology, 2013�2020 (USD Million)
Table 32 Polyethylene Market Size, By Technology, 2013�2020 (Million Sq. Mt.)
Table 33 Polyethylene Market Size, By End Use, 2013�2020 (USD Million)
Table 34 Polyethylene Market Size, By End Use, 2013�2020 (Million Sq. Mt.)
Table 35 ABS Resins Market Size, By Technology, 2013�2020 (USD Million)
Table 36 ABS Resins Market Size, By Technology, 2013�2020 (Million Sq. Mt.)
Table 37 ABS Resins Market Size, By End Use, 2013�2020 (USD Million)
Table 38 ABS Resins Market Size, By End Use, 2013�2020 (Million Sq. Mt.)
Table 39 Polyvinyl Chloride Market Size, By Technology, 2013�2020 (USD Million)
Table 40 Polyvinyl Chloride Market Size, By Technology, 2013�2020 (Million Sq. Mt.)
Table 41 Polyvinyl Chloride Market Size, By End Use, 2013�2020 (USD Million)
Table 42 Polyvinyl Chloride Market Size, By End Use, 2013�2020 (Million Sq. Mt.)
Table 43 Other Co-Polymers Market Size, By Technology, 2013�2020 (USD Million)
Table 44 Other Co-Polymers Market Size, By Technology, 2013�2020 (Million Sq. Mt.)
Table 45 Other Co-Polymers Market Size, By End Use, 2013�2020 (USD Million)
Table 46 Other Co-Polymers Market Size, By End Use, 2013�2020 (Million Sq. Mt.)
Table 47 In-Mold Labels Market Size, By End-Use, 2013�2020 (USD Million)
Table 48 In-Mold Labels Market Size, By End-Use, 2013�2020 (Million Sq. Mt.)
Table 49 In-Mold Labels Market Size, By Printing Technology, 2013�2020 (USD Million)
Table 50 In-Mold Labels Market Size, By Printing Technology, 2013�2020 (Million Sq. Mt.)
Table 51 In-Mold Labels Market Size, By Printing Ink, 2013�2020 (USD Million)
Table 52 In-Mold Labels Market Size, By Printing Ink, 2013�2020 (Million Sq. Mt.)
Table 53 In-Mold Labels Market Size, By Region, 2013�2020 (USD Million)
Table 54 In-Mold Labels Market Size, By Region, 2013�2020 (Million Sq. Mt.)
Table 55 Europe: In-Mold Labels Market Size, By Country, 2013�2020 (USD Million)
Table 56 Europe: In-Mold Labels By Market Size, By Country, 2013�2020 (Million Sq. Mt.)
Table 57 Europe: In-Mold Labels By Market Size, By Technology, 2013�2020 (USD Million)
Table 58 Europe: In-Mold Labels By Market Size, By Technology, 2013�2020 (Million Sq. Mt.)
Table 59 Europe: In-Mold Labels By Market Size, By Material, 2013�2020 (USD Million)
Table 60 Europe: In-Mold Labels By Market Size, By Material, 2013�2020 (Million Sq. Mt.)
Table 61 Europe: In-Mold Labels By Market Size, By End Use, 2013�2020 (USD Million)
Table 62 Europe: In-Mold Labels Market Size, By End Use, 2013�2020 (Million Sq. Mt.)
Table 63 Germany: In-Mold Labels Market Size, By Technology, 2013�2020 (USD Million)
Table 64 Germany: In-Mold Labels By Market Size, By Technology, 2013�2020 (Million Sq. Mt.)
Table 65 Germany: In-Mold Labels By Market Size, By Material, 2013�2020 (USD Million)
Table 66 Germany: By Market Size, By Material, 2013�2020 (Million Sq. Mt.)
Table 67 Germany: By Market Size, By End Use, 2013�2020 (USD Million)
Table 68 Germany: By Market Size, By End Use, 2013�2020 (Million Sq. Mt.)
Table 69 U.K.: In-Mold Labels Market Size, By Technology, 2013�2020 (USD Million)
Table 70 U.K.: In-Mold Labels Market Size, By Technology, 2013�2020 (Million Sq. Mt.)
Table 71 U.K.: In-Mold Labels Market Size, By Material, 2013�2020 (USD Million)
Table 72 U.K.: In-Mold Labels Market Size, By Material, 2013�2020 (Million Sq. Mt.)
Table 73 U.K.: In-Mold Labels Market Size, By End Use, 2013�2020 (USD Million)
Table 74 U.K.: By Market Size, By End Use, 2013�2020 (Million Sq. Mt.)
Table 75 Russia: In-Mold Labels Market Size, By Technology, 2013�2020 (USD Million)
Table 76 Russia: By Market Size, By Technology, 2013�2020 (Million Sq. Mt.)
Table 77 Russia: By Market Size, By Material, 2013�2020 (USD Million)
Table 78 Russia: By Market Size, By Material, 2013�2020 (Million Sq. Mt.)
Table 79 Russia: By Market Size, By End Use, 2013�2020 (USD Million)
Table 80 Russia: By Market Size, By End Use, 2013�2020 (Million Sq. Mt.)
Table 81 France: In-Mold Labels Market Size, By Technology, 2013�2020 (USD Million)
Table 82 France: By Market Size, By Technology, 2013�2020 (Million Sq. Mt.)
Table 83 France: By Market Size, By Material, 2013�2020 (USD Million)
Table 84 France: By Market Size, By Material, 2013�2020 (Million Sq. Mt.)
Table 85 France: By Market Size, By End Use, 2013�2020 (USD Million)
Table 86 France: By Market Size, By End Use, 2013�2020 (Million Sq. Mt.)
Table 87 Rest of Europe: In-Mold Labels Market Size, By Technology, 2013�2020 (USD Million)
Table 88 Rest of Europe: By Market Size, By Technology, 2013�2020 (Million Sq. Mt.)
Table 89 Rest of Europe: By Market Size, By Material, 2013�2020 (USD Million)
Table 90 Rest of Europe: By Market Size, By Material, 2013�2020 (Million Sq. Mt.)
Table 91 Rest of Europe: By Market Size, By End Use, 2013�2020 (USD Million)
Table 92 Rest of Europe: By Market Size, By End Use, 2013�2020 (Million Sq. Mt.)
Table 93 Asia-Pacific: In-Mold Labels Market Size, By Country, 2013�2020 (USD Million)
Table 94 Asia-Pacific: By Market Size, By Country, 2013�2020 (Million Sq. Mt.)
Table 95 Asia-Pacific: By Market Size, By Technology, 2013�2020 (USD Million)
Table 96 Asia-Pacific: By Market Size, By Technology, 2013�2020 (Million Sq. Mt.)
Table 97 Asia-Pacific: By Market Size, By Material, 2013�2020 (USD Million)
Table 98 Asia-Pacific: By Market Size, By Material, 2013�2020 (Million Sq. Mt.)
Table 99 Asia-Pacific: By Market Size, By End-Use, 2013�2020 (USD Million)
Table 100 Asia-Pacific: By Market Size, By End-Use, 2013�2020 (Million Sq. Mt.)
Table 101 China: In-Mold Labels Market Size, By Technology, 2013�2020 (USD Million)
Table 102 China: By Market Size, By Technology, 2013�2020 (Million Sq. Mt.)
Table 103 China: By Market Size, By Material, 2013�2020 (USD Million)
Table 104 China: By Market Size, By Material, 2013�2020 (Million Sq. Mt.)
Table 105 China: By Market Size, By End-Use, 2013�2020 (USD Million)
Table 106 China: By Market Size, By End-Use, 2013�2020 (Million Sq. Mt.)
Table 107 Japan: In-Mold Labels Market Size, By Technology, 2013�2020 (USD Million)
Table 108 Japan: By Market Size, By Technology, 2013�2020 (Million Sq. Mt.)
Table 109 Japan: By Market Size, By Material, 2013�2020 (USD Million)
Table 110 Japan: By Market Size, By Material, 2013�2020 (Million Sq. Mt.)
Table 111 Japan: By Size, By End-Use, 2013�2020 (USD Million)
Table 112 Japan: By Market Size, By End-Use, 2013�2020 (Million Sq. Mt.)
Table 113 India: In-Mold Labels Market Size, By Technology, 2013�2020 (USD Million)
Table 114 India: By Market Size, By Technology, 2013�2020 (Million Sq. Mt.)
Table 115 India: By Market Size, By Material, 2013�2020 (USD Million)
Table 116 India: By Market Size, By Material, 2013�2020 (Million Sq. Mt.)
Table 117 India: By Market Size, By End-Use, 2013�2020 (USD Million)
Table 118 India: By Market Size, By End Use, 2013�2020 (Million Sq. Mt.)
Table 119 Australia: In-Mold Labels Market Size, By Technology, 2013�2020 (USD Million)
Table 120 Australia: By Market Size, By Technology, 2013�2020 (Million Sq. Mt.)
Table 121 Australia: By Market Size, By Material, 2013�2020 (USD Million)
Table 122 Australia: By Market Size, By Material, 2013�2020 (Million Sq. Mt.)
Table 123 Australia: By Market Size, By End-Use, 2013�2020 (USD Million)
Table 124 Australia: By Market Size, By End-Use, 2013�2020 (Million Sq. Mt.)
Table 125 Rest of Asia-Pacific: In-Mold Labels Market Size, By Technology, 2013�2020 (USD Million)
Table 126 Rest of Asia-Pacific: By Market Size, By Technology, 2013�2020 (Million Sq. Mt.)
Table 127 Rest of Asia-Pacific: By Market Size, By Material, 2013�2020 (USD Million)
Table 128 Rest of Asia-Pacific: By Market Size, By Material, 2013�2020 (Million Sq. Mt.)
Table 129 Rest of Asia-Pacific: By Market Size, By End-Use, 2013�2020 (USD Million)
Table 130 Rest of Asia-Pacific: By Market Size, By End-Use, 2013�2020 (Million Sq. Mt.)
Table 131 North America: In-Mold Labels Market Size, By Country, 2013�2020 (USD Million)
Table 132 North America: By Market Size, By Country, 2013�2020 (Million Sq. Mt.)
Table 133 North America: By Market Size, By Technology, 2013�2020 (USD Million)
Table 134 North America: By Market Size, By Technology, 2013�2020 (Million Sq. Mt.)
Table 135 North America: By Market Size, By Material, 2013�2020 (USD Million)
Table 136 North America: By Market Size, By Material, 2013�2020 (Million Sq. Mt.)
Table 137 North America: By Market Size, By End Use, 2013�2020 (USD Million)
Table 138 North America: By Market Size, By End Use, 2013�2020 (Million Sq. Mt.)
Table 139 U.S.: In-Mold Labels Market Size, By Technology, 2013�2020 (USD Million)
Table 140 U.S.: Market Size, By Technology, 2013�2020 (Million Sq. Mt.)
Table 141 U.S.: By Market Size, By Material, 2013�2020 (USD Million)
Table 142 U.S.: By Market Size, By Material, 2013�2020 (Million Sq. Mt.)
Table 143 U.S.: By Market Size, By End Use, 2013�2020 (USD Million)
Table 144 U.S.: By Market Size, By End Use, 2013�2020 (Million Sq. Mt.)
Table 145 Canada: In-Mold Labels Market Size, By Technology, 2013�2020 (USD Million)
Table 146 Canada: By Market Size, By Technology, 2013�2020 (Million Sq. Mt.)
Table 147 Canada: By Market Size, By Material, 2013�2020 (USD Million)
Table 148 Canada: By Market Size, By Material, 2013�2020 (Million Sq. Mt.)
Table 149 Canada: By Market Size, By End Use, 2013�2020 (USD Million)
Table 150 Canada: By Market Size, By End Use, 2013�2020 (Million Sq. Mt.)
Table 151 Mexico: By Market Size, By Technology, 2013�2020 (USD Million)
Table 152 Mexico: By Market Size, By Technology, 2013�2020 (Million Sq. Mt.)
Table 153 Mexico: By Market Size, By Material, 2013�2020 (USD Million)
Table 154 Mexico: By Market Size, By Material, 2013�2020 (Million Sq. Mt.)
Table 155 Mexico: By Market Size, By End Use, 2013�2020 (USD Million)
Table 156 Mexico: By Market Size, By End Use, 2013�2020 (Million Sq. Mt.)
Table 157 RoW: In-Mold Labels Market Size, By Country, 2013�2020 (USD Million)
Table 158 RoW: By Market Size, By Country, 2013�2020 (Million Sq. Mt.)
Table 159 RoW: By Market Size, By Technology, 2013�2020 (USD Million)
Table 160 RoW: By Market Size, By Technology, 2013�2020 (Million Sq. Mt.)
Table 161 RoW: By Market Size, By Material, 2013�2020 (USD Million)
Table 162 RoW: By Market Size, By Material, 2013�2020 (Million Sq. Mt.)
Table 163 RoW: By Market Size, By End Use, 2013�2020 (USD Million)
Table 164 RoW: By Market Size, By End Use, 2013�2020 (Million Sq. Mt.)
Table 165 Brazil: In-Mold Labels Market Size, By Technology, 2013�2020 (USD Million)
Table 166 Brazil: By Market Size, By Technology, 2013�2020 (Million Sq. Mt.)
Table 167 Brazil: By Market Size, By Material, 2013�2020 (USD Million)
Table 168 Brazil: By Market Size, By Material, 2013�2020 (Million Sq. Mt.)
Table 169 Brazil: By Market Size, By End Use, 2013�2020 (USD Million)
Table 170 Brazil: By Market Size, By End Use, 2013�2020 (Million Sq. Mt.)
Table 171 South Africa: In-Mold Labels Market Size, By Technology, 2013�2020 (USD Million)
Table 172 South Africa: By Market Size, By Technology, 2013�2020 (Million Sq. Mt.)
Table 173 South Africa: By Market Size, By Material, 2013�2020 (USD Million)
Table 174 South Africa: By Market Size, By Material, 2013�2020 (Million Sq. Mt.)
Table 175 South Africa: By Market Size, By End Use, 2013�2020 (USD Million)
Table 176 South Africa: By Market Size, By End Use, 2013�2020 (Million Sq. Mt.)
Table 177 Other Countries in RoW: In-Mold Labels Market Size, By Technology, 2013�2020 (USD Million)
Table 178 Other Countries in RoW: By Market Size, By Technology, 2013�2020 (Million Sq. Mt.)
Table 179 Other Countries in RoW: By Market Size, By Material, 2013�2020 (USD Million)
Table 180 Other Countries in RoW: By Market Size, By Material, 2013�2020 (Million Sq. Mt.)
Table 181 Other Countries in RoW: By Market Size, By End Use, 2013�2020 (USD Million)
Table 182 Other Countries in RoW: By Market Size, By End Use, 2013�2020 (Million Sq. Mt.)
Table 183 Mergers & Acquisitions, 2015
Table 184 Agreements, Collaborations& Joint Ventures, 2011�2015
Table 185 Expansions & Investments, 2014�2015
Table 186 New Product Launches, 2015
List of Figures (59 Figures)
Figure 1 In-Mold Labels Market
Figure 2 Market: Research Design
Figure 3 Population Growth has Increased By 3 Billion in Three Decades
Figure 4 Increase in the Total Expenditure of Middle-Class Families
Figure 5 Growth in the Global Packaging Market Between 2012 & 2018
Figure 6 Manufacturing Value Added (USD Billion)
Figure 7 R&D Investments of the Top In-Mold Label Manufacturing Companies
Figure 8 Market Size Estimation Methodology: Top-Down Approach
Figure 9 Data Triangulation Methodology
Figure 10 Polypropylene (PP) is Projected to Account for the Largest Share Through 2020
Figure 11 Europe is Projected to Dominate the Global In-Mold Labels Market By 2020
Figure 12 U.S. is Projected to Be the Fastest-Growing Market for In-Mold Labels From 2015 to 2020
Figure 13 Leading Market Players Adopted Mergers & Acquisitions as the Key Strategy From 2011 to 2015
Figure 14 Emerging Economies Offer Attractive Opportunities in the In-Mold Labels Market
Figure 15 Food & Beverage Segment Occupied the Largest Share Among All End Users of In-Mold Labels in 2014
Figure 16 Injection Molding Process Captured the Largest Share in the Emerging Asia-Pacific Market in 2015
Figure 17 U.S. Projected to Be the Fastest-Growing Country for In-Mold Labels Through 2020
Figure 18 Europe Occupied the Largest Market Share Among All Regions in 2014
Figure 19 Emerging Markets to Grow Faster Than Developed Markets Between 2015 & 2020
Figure 20 UV-Curable Inks Segment Accounted for the Largest Share in 2014
Figure 21 In-Mold Labels Market in North American Region is Experiencing High Growth
Figure 22 Industrial Manufacturing of In-Mold Labels Began in the Late 1970s
Figure 23 In-Mold Labels Market Segmentation
Figure 24 Increasing Demand for Packaged Foods & Beverages is the Major Driver of the Market
Figure 25 Leading FMCG Companies Sales in 2014
Figure 26 In-Mold Labels Value Chain
Figure 27 Porter�s Five Forces Analysis
Figure 28 Average Price Analysis, By Region
Figure 29 Average Price Analysis, By Technology
Figure 30 Average Price Analysis, By End Use
Figure 31 Average Price Analysis, By Material
Figure 32 Extrusion Blow-Molding Process is Projected to Grow at the Highest CAGR By 2020
Figure 33 Polypropylene Held the Largest Market Share in 2014
Figure 34 In-Mold Labels Market Size, By End-Use, 2015 vs 2020 (USD Million)
Figure 35 Flexographic Printing is Projected to Grow at the Highest CAGR By 2020
Figure 36 UV Curable Inks Accounted for Largest Market Share in 2014
Figure 37 Geographical Snapshot: In-Mold Labels Market Growth Rate (2015-2020)
Figure 38 U.S. & India Poised to Grow at the Highest CAGR During the Forecast Period
Figure 39 Europe: Market Snapshot
Figure 40 Asia-Pacific: Market Snapshot
Figure 41 North America: Market Snapshot
Figure 42 RoW: Market Snapshot
Figure 43 Companies Adopted Mergers & Acquisitions as Their Key Growth Strategy Over the Last Five Years (2011�2015)
Figure 44 Growth Comparison of Key Players in the In-Mold Labels Market, 2012�2014
Figure 45 2015 the Most Active Year in the In-Mold Labels Market in Terms of Developments
Figure 46 Mergers & Acquisitions: the Key Strategy, 2011�2015
Figure 47 Geographic Revenue Mix of Top Five Players
Figure 48 CCL Industries, Inc.: Company Snapshot
Figure 49 SWOT Analysis: CCL Industries, Inc.
Figure 50 Constantia Flexibles Group GmbH: Company Snapshot
Figure 51 SWOT Analysis: Constantia Flexibles Group GmbH
Figure 52 Huhtamaki Group: Company Snapshot
Figure 53 SWOT Analysis: Huhtamaki Group
Figure 54 Coveris Holding S.A.: Company Snapshot
Figure 55 SWOT Analysis: Coveris Holding S.A.
Figure 56 Cenveo Inc.: Company Snapshot
Figure 57 SWOT Analysis: Cenevo Inc.
Figure 58 Fuji Seal International, Inc.: Company Snapshot
Figure 59 Multicolor Corporation: Company Snapshot


Growth opportunities and latent adjacency in In-mold labels Market