Filtration and Contamination Control Market by Filtration Type (Liquid, Air), Customer Type (Aftermarket, OEM), Application (Engine, Industrial Machinery, Oil and Gas, Aerospace, Gas Turbine, Power Generation), and Geography - Global Forecast to 2022


[150 Pages Report] The filtration and contamination control market is estimated to reach USD 39.73 Billion by 2022, at a CAGR of 5.13% between 2017 and 2022. The base year considered for the study is 2016, and the market forecast has been done for the period between 2017 and 2022. The report aims at estimating the market size and future growth potential of the market based on filtration type, customer type, application, and region. The report also aims at providing detailed information regarding the major factors influencing the growth of the filtration and contamination control (drivers, restraints, opportunities, and industry-specific challenges), and strategically analyzes the micromarkets with respect to the individual growth trends, future prospects, and contributions to the total market.
The global filtration and contamination control market is expected to reach USD 39.73 Billion by 2022, at a CAGR of 5.13% between 2017 and 2022. The market is expected to grow substantially owing to the growing demand for cleaner fuels due to stringent environmental emission standards, strong demand for filtration across on-road and off-road applications; and requirement of higher power efficiency performance among mechanical equipment and factory processes.
The filtration and contamination control market has been segmented on the basis of filtration type into liquid filtration and air filtration. Classification based on customer type includes aftermarket and OEM (first fit). The market has been segmented on the basis of application into engine and industrial segments. The industrial segment further includes industrial machinery, oil & gas, aerospace, gas turbine, power generation, and others. The industrial machinery subsegment further includes end users in pulp and paper; chemical and petrochemical refineries; and iron, steel, and other metal manufacturing industries. The engine application segment has been subsegmented into on road, agriculture, construction, and mining and marine. In the overall market, the industrial filtration segment is expected to grow at a higher rate because of the high rate of deployment and diffusion of filtration devices in applications across the industrial machinery segment.
The market for OEM (first fit) customer type is expected to grow at the highest rate during the forecast period. Growing number of new power generation facilities and exponential rise in demand from on-road vehicles are the key factors contributing to the growth of the OEM (first fit) customer type.
Liquid filtration holds the largest share of the filtration and contamination control market. Mobile engines; process industries (including pulp and paper); chemical and petrochemical refineries; and power generation are some of the industries strongly dependent on liquid filtration. Growth of these industries in emerging economies such as China, India, Brazil, and Saudi Arabia is expected to drive the liquid filtration market at the highest rate during the forecast period.
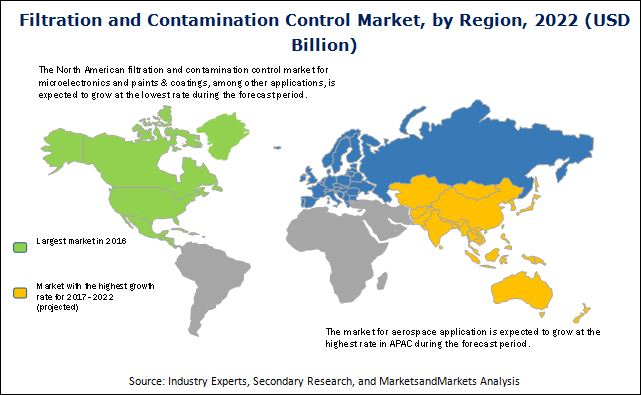
In 2016, North America led the filtration and contamination control market, followed by Europe and APAC. The U.S. held the largest share of the North American market, followed by Canada and Mexico.
The filtration and contamination control market faces some challenges associated with fluctuations in raw material costs. The increasing demand for electric vehicles is currently acting as a restraint for the market growth. This report describes drivers, restraints, opportunities, and challenges pertaining to the market. Furthermore, it analyzes the current scenario and forecasts the market till 2022, including the market segmentation based on filtration type, customer type, application, and region.
Some of the major companies in the filtration and contamination control market include MANN+HUMMEL Holding GmbH (Germany), Donaldson Company, Inc. (U.S.), Cummins Inc. (U.S.), Parker-Hannifin Corp. (U.S.), Pall Corporation (U.S.), Clarcor Inc. (U.S.), Filtration Group Corporation (U.S.), Eaton Corporation plc (Ireland), HYDAC International GmbH (Germany), and CECO Environmental Corp. (U.S.).
To speak to our analyst for a discussion on the above findings, click Speak to Analyst
 Exclusive indicates content/data unique to MarketsandMarkets and not available with any competitors.
Table of Contents
1 Introduction (Page No. - 14)
1.1 Objectives of the Study
1.2 Market Definition
1.3 Market Scope
1.3.1 Markets Covered
1.3.2 Years Considered for the Study
1.4 Currency
1.5 Limitations
1.6 Stakeholders
2 Research Methodology (Page No. - 17)
2.1 Research Data
2.2 Secondary Data
2.2.1 Major Secondary Sources
2.2.2 Key Data From Secondary Sources
2.3 Primary Data
2.3.1 Primary Interviews With Experts
2.3.2 Breakdown of Primaries
2.3.3 Key Data From Primary Sources
2.4 Secondary and Primary Research
2.4.1 Key Industry Insights
2.5 Market Size Estimation
2.6 Bottom-Up Approach
2.6.1 Approach for Capturing the Market Share By Bottom-Up Analysis (Demand Side)
2.7 Top-Down Approach
2.7.1 Approach for Capturing the Market Share By Top-Down Analysis (Supply Side)
2.8 Market Breakdown and Data Triangulation
2.9 Research Assumptions
3 Executive Summary (Page No. - 28)
4 Premium Insights (Page No. - 32)
4.1 Opportunities in the Filtration and Contamination Control Market
4.2 Filtration and Contamination Control, By Filtration Type
4.3 Filtration and Contamination Control, By Region and Engine Application
4.4 Filtration and Contamination Control, By Country
4.5 Filtration and Contamination Control, By Region (2016, 2017, and 2022)
5 Market Overview (Page No. - 36)
5.1 Introduction
5.2 Market Dynamics
5.2.1 Drivers
5.2.1.1 Increasingly Restrictive Environmental Regulations
5.2.1.2 Strong Demand Across On-Road and Off-Road Applications
5.2.1.3 Requirement of Higher Efficiency Performance Among Mechanical Equipment and Factory Processes
5.2.2 Restraint
5.2.2.1 Increase in Demand for Electric Vehicles
5.2.3 Opportunities
5.2.3.1 High Rate of Industrialization in Developing Nations
5.2.3.2 Continual Upgrading in Emission Standards
5.2.3.3 Emerging Alternative and Renewable Energy Sources
5.2.4 Challenge
5.2.4.1 Fluctuating Raw Material Costs
6 Industry Trends (Page No. - 45)
6.1 Introduction
6.2 Value Chain Analysis of Filtration and Contamination Control Market
6.3 Porter’s Five Forces Analysis
6.3.1 Intensity of Competitive Rivalry
6.3.2 Threat of Substitutes
6.3.3 Bargaining Power of Buyers
6.3.4 Bargaining Power of Suppliers
6.3.5 Threat of New Entrants
7 Market, By Filtration Type (Page No. - 51)
7.1 Introduction
7.2 Liquid Filtration
7.3 Air Filtration
8 Market, By Customer Type (Page No. - 64)
8.1 Introduction
8.2 Aftermarket
8.3 OEM (First Fit)
9 Market, By Application (Page No. - 68)
9.1 Introduction
9.2 Engine
9.2.1 On Road
9.2.2 Agriculture
9.2.3 Construction
9.2.4 Mining and Marine
9.3 Industrial
9.3.1 Industrial Machinery
9.3.2 Oil and Gas
9.3.3 Aerospace
9.3.4 Gas Turbine
9.3.5 Power Generation
9.3.6 Others
10 Geographic Analysis (Page No. - 82)
10.1 Introduction
10.2 North America
10.2.1 U.S.
10.2.2 Canada
10.2.3 Mexico
10.3 Europe
10.3.1 Germany
10.3.2 U.K.
10.3.3 France
10.3.4 Rest of Europe
10.4 Asia-Pacific
10.4.1 China
10.4.2 India
10.4.3 Japan
10.4.4 Rest of Asia-Pacific
10.5 Rest of the World
10.5.1 Middle East & Africa
10.5.2 South America
11 Competitive Landscape (Page No. - 101)
11.1 Introduction
11.2 Market Share Analysis of the Players Operating in the Filtration and Contamination Control
11.3 Competitive Situations and Trends
11.4 New Product Launches
11.5 Expansions
11.6 Mergers & Acquisitions
11.7 Agreements and Partnerships
12 Company Profiles (Page No. - 111)
(Introduction, Products & Services, Strategy, & Analyst Insights, Developments, MnM View)*
12.1 Introduction
12.2 Mann+Hummel Holding GmbH
12.3 Donaldson Company, Inc.
12.4 Cummins Inc.
12.5 Parker-Hannifin Corp.
12.6 Pall Corporation
12.7 Clarcor Inc.
12.8 Filtration Group Corporation
12.9 Eaton Corporation PLC
12.10 Hydac International GmbH
12.11 Ceco Environmental Corp.
*Details on Marketsandmarkets View, Introduction, Product & Services, Strategy, & Analyst Insights, New Developments Might Not Be Captured in Case of Unlisted Companies.
13 Appendix (Page No. - 144)
13.1 Insights of Industry Experts
13.2 Discussion Guide
13.3 Introducing RT: Real-Time Market Intelligence
13.4 Available Customizations
13.5 Related Reports
13.6 Author Details
List of Tables (66 Tables)
Table 1 Environmental Protection Acts of A Few Major Countries
Table 2 Filtration and Contamination Control Market, By Filtration Type, 2017–2022 (USD Billion)
Table 3 Liquid Filtration and Contamination Control, By Application (USD Million)
Table 4 Liquid Filtration and Contamination Control, By Region (USD Million)
Table 5 Liquid Filtration and Contamination Control for Engine Application, By Region (USD Million)
Table 6 Liquid Filtration and Contamination Control for Industrial Machinery Application, By Region (USD Million)
Table 7 Liquid Filtration and Contamination Control for Oil and Gas Application, By Region (USD Million)
Table 8 Liquid Filtration and Contamination Control for Aerospace Application, By Region (USD Million)
Table 9 Liquid Filtration and Contamination Control for Gas Turbine Application, By Region (USD Million)
Table 10 Liquid Filtration and Contamination Control Market for Power Generation Application, By Region (USD Million)
Table 11 Liquid Filtration and Contamination Control for Other Applications, By Region (USD Million)
Table 12 Air Filtration and Contamination Control, By Application (USD Million)
Table 13 Air Filtration and Contamination Control, By Region (USD Million)
Table 14 Air Filtration and Contamination Control for Engine Application, By Region (USD Million)
Table 15 Air Filtration and Contamination Control for Industrial Machinery Application, By Region (USD Million)
Table 16 Air Filtration and Contamination Control for Oil and Gas Application, By Region (USD Million)
Table 17 Air Filtration and Contamination Control for Aerospace Application, By Region (USD Million)
Table 18 Air Filtration and Contamination Control for Gas Turbine Application, By Region (USD Million)
Table 19 Air Filtration and Contamination Control Market for Power Generation Application, By Region (USD Million)
Table 20 Air Filtration and Contamination Control for Other Applications, By Region (USD Million)
Table 21 Filtration and Contamination Control Market, By Customer Type, 2015–2022 (USD Billion)
Table 22 Market for Aftermarket, By Application (USD Billion)
Table 23 Market for OEM, By Application (USD Billion)
Table 24 Market, By Application (USD Billion)
Table 25 Market for Engine, By Filtration Type (USD Billion)
Table 26 Filtration and Contamination Control for Engine, By Customer Type (USD Billion)
Table 27 Filtration and Contamination Control for Engine, By Application (USD Billion)
Table 28 Filtration and Contamination Control for Engine, By Region (USD Billion)
Table 29 Market for Industrial, By Customer Type (USD Billion)
Table 30 Filtration and Contamination Control for Industrial, By Application (USD Billion)
Table 31 Filtration and Contamination Control for Industrial Machinery, By Filtration Type (USD Billion)
Table 32 Filtration and Contamination Control for Industrial Machinery, By Region (USD Million)
Table 33 Market for Oil and Gas, By Filtration Type (USD Million)
Table 34 Filtration and Contamination Control for Oil and Gas, By Region (USD Million)
Table 35 Market for Aerospace, By Filtration Type (USD Million)
Table 36 Filtration and Contamination Control for Aerospace, By Region (USD Million)
Table 37 Market for Gas Turbine, By Filtration Type (USD Million)
Table 38 Filtration and Contamination Control for Gas Turbine, By Region (USD Million)
Table 39 Market for Power Generation, By Filtration Type (USD Million)
Table 40 Filtration and Contamination Control for Power Generation, By Region (USD Million)
Table 41 Market for Other Applications, By Filtration Type (USD Million)
Table 42 Filtration and Contamination Control for Other Applications, By Region (USD Million)
Table 43 Market, By Region (USD Billion)
Table 44 Market in North America, By Country (USD Billion)
Table 45 Filtration and Contamination Control in North America, By Application (USD Million)
Table 46 Filtration and Contamination Control in North America, By Filtration Type (USD Billion)
Table 47 Market in U.S., By Application (USD Million)
Table 48 Filtration and Contamination Control in U.S., By Filtration Type (USD Billion)
Table 49 Market in Europe, By Country (USD Billion)
Table 50 Filtration and Contamination Control in Europe, By Application (USD Million)
Table 51 Filtration and Contamination Control in Europe, By Filtration Type (USD Billion)
Table 52 Market in Germany, By Application (USD Million)
Table 53 Filtration and Contamination Control in Germany, By Filtration Type (USD Million)
Table 54 Market in Asia-Pacific, By Country (USD Billion)
Table 55 Asia-Pacific Filtration and Contamination Control, By Application (USD Million)
Table 56 Filtration and Contamination Control in Asia-Pacific, By Filtration Type (USD Billion)
Table 57 Market in China, By Application (USD Million)
Table 58 Filtration and Contamination Control in China, By Filtration Type (USD Billion)
Table 59 Market in RoW, By Application (USD Million)
Table 60 Filtration and Contamination Control in RoW, By Filtration Type (USD Million)
Table 61 Filtration and Contamination Control in RoW, By Region (USD Million)
Table 62 Market Rank Analysis, By Key Player, 2016
Table 63 New Product Launches, 2014–2016
Table 64 Expansions, 2014–2016
Table 65 Acquisitions, 2014–2016
Table 66 Agreements, Partnerships, and Collaborations, 2014–2016
List of Figures (59 Figures)
Figure 1 Market Segments
Figure 2 Filtration and Contamination Control Market: Research Design
Figure 3 Market Size Estimation Methodology: Bottom-Up Approach
Figure 4 Market Size Estimation Methodology: Top-Down Approach
Figure 5 Data Triangulation
Figure 6 Assumptions of the Research Study
Figure 7 Filtration and Contamination Control, 2015–2022 (USD Billion)
Figure 8 Filtration and Contamination Control Market Snapshot (2017 vs 2022): Liquid Filtration Expected to Witness Higher Growth During the Forecast Period
Figure 9 Aftermarket Sales Dominated the Filtration and Contamination Control in 2017
Figure 10 Market for Oil and Gas Expected to Witness the Highest Growth During the Forecast Period
Figure 11 Global Filtration and Contamination Control, By Region, 2016
Figure 12 Attractive Market Opportunities in the Market (2017–2022)
Figure 13 Liquid Filtration Expected to Witness Higher Growth During the Forecast Period
Figure 14 North America Held the Largest Share of the Market in 2016
Figure 15 China, Mexico, India, and Canada Expected to Offer Potential Market for Filtration and Contamination Control During the Forecast Period
Figure 16 North America Expected to Hold A Major Size of the Market By 2022
Figure 17 Drivers, Restraints, Opportunities, and Challenges for the Market
Figure 18 Global Motor Vehicle Production, By Vehicle Type, 2010–2015 (Million Units)
Figure 19 Global Motor Vehicle Production, By Region, 2010–2015 (Thousand Units)
Figure 20 Global Motor Vehicle Sales, By Type, 2010–2015 (Million Units)
Figure 21 Global Motor Vehicle Sales, By Region, 2010–2015 (Thousand Units)
Figure 22 Global Motor Vehicle Production vs Sales, 2010–2015 (Million Units)
Figure 23 Filtration and Contamination Control : Value Chain Analysis
Figure 24 Porter’s Five Forces Analysis
Figure 25 Porter’s Five Forces Analysis: Market, 2016
Figure 26 Market: Intensity of Competitive Rivalry
Figure 27 Market: Threat of Substitutes
Figure 28 Market: Bargaining Power of Buyers
Figure 29 Market: Bargaining Power of Suppliers
Figure 30 Market: Threat of New Entrants
Figure 31 Market, By Filtration Type
Figure 32 Liquid Filtration Expected to Lead the Filtration and Contamination Control By 2022
Figure 33 Filtration and Contamination Control, By Customer Type
Figure 34 Market for OEM Expected to Grow at the Highest Rate Between 2017 and 2022
Figure 35 Filtration and Contamination Control, By Application
Figure 36 Engine Application Segment Expected to Hold the Largest Share of the Filtration and Contamination Control Market By 2022
Figure 37 Geographical Snapshot of the Filtration and Contamination Control, 2016
Figure 38 APAC to Witness the Highest Growth Rate Between 2017 and 2022
Figure 39 North America: Market Snapshot, 2016
Figure 40 Europe: Market Snapshot, 2016
Figure 41 Asia-Pacific: Market Snapshot, 2016
Figure 42 Companies Majorly Adopted New Product Launch as the Key Growth Strategy Over the Last Three Years (2014–2016)
Figure 43 Market Evolution Framework–Mergers & Acquisitions Fueled the Market Growth in 2016
Figure 44 Battle for Market Share: New Product Launches Was the Key Strategy (2014–2016)
Figure 45 Geographic Revenue Mix of Major Players
Figure 46 Mann+Hummel Holding GmbH: Company Snapshot
Figure 47 Mann+Hummel Holding GmbH: Profit & Loss Bridge, 2015
Figure 48 Donaldson Company, Inc.: Company Snapshot
Figure 49 Donaldson Company, Inc.: Profit & Loss Bridge, 2016
Figure 50 Cummins Inc.: Company Snapshot
Figure 51 Cummins Inc.: Profit & Loss Bridge, 2015
Figure 52 Parker-Hannifin Corp: Company Snapshot
Figure 53 Parker-Hannifin Corp.: Profit & Loss Bridge, 2016
Figure 54 Clarcor Inc.: Company Snapshot
Figure 55 Clarcor Inc.: Profit & Loss Bridge, 2016
Figure 56 Eaton Corporation PLC: Company Snapshot
Figure 57 Eaton Corporation PLC: Profit & Loss Bridge, 2015
Figure 58 Ceco Environmental Corp.: Company Snapshot
Figure 59 Ceco Environmental Corp.: Profit & Loss Bridge, 2015
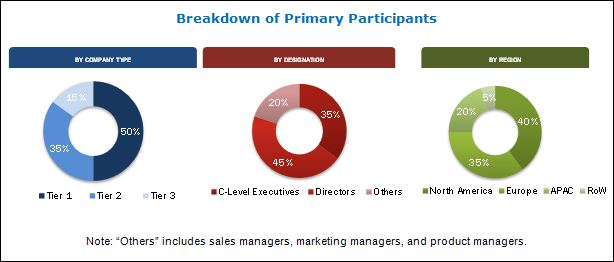
The research methodology used to estimate and forecast the filtration and contamination control market begins with capturing data on key vendor revenues through secondary research. Some of the secondary sources used in this research include various filtration and contamination control associations and organizations, such as the Global Society for Contamination Control (GSFCC), the Institute of Environmental Sciences and Technology (IEST), the National Fluid Power Association, the National Air Filtration Association (NAFA), the Canadian Standards Association, the American Filtration and Separations Society, the Federation of Environmental Trade Associations (FETA), and the European Committee for Standardization (CEN). The vendor offerings have also been taken into consideration to determine the market segmentation. The bottom-up procedure has been employed to arrive at the overall size of the global filtration and contamination control from the revenue of key players. After arriving at the overall market size, the total market has been verified through primary research by conducting extensive interviews with key experts such as CEOs, VPs, directors, and executives. The market breakdown and data triangulation procedures have been employed to complete the overall market engineering process and arrive at the exact statistics for all segments and subsegments. The breakdown of the profiles of primary participants has been depicted in the below figure.
To know about the assumptions considered for the study, download the pdf brochure
The filtration and contamination control markets’ ecosystem includes filtration component and equipment manufacturers and suppliers, system designers, machine manufacturers, product manufacturers, filtration system and software programmers/designers, research labs and institutes, prototype development and testing, assembly, distribution, marketing strategies, installation, and after-sales services. The marketspace comprises major players such as MANN+HUMMEL Holding GmbH (Germany), Donaldson Company, Inc. (U.S.), Cummins Inc. (U.S.), Parker-Hannifin Corp. (U.S.), Pall Corporation (U.S.), Clarcor Inc. (U.S.), Filtration Group Corporation (U.S.), Eaton Corporation plc (Ireland), HYDAC International GmbH (Germany), and CECO Environmental Corp. (U.S.).
Target Audience
- Filtration component and equipment manufacturers and suppliers
- Filter manufacturers and suppliers
- System designers and machine manufacturers
- Product manufacturers
- Filtration system and software programmers/designers
- Research labs and research institutes
- Market research and consulting firms
- Government, financial, and educational institutions
- Analysts and strategic business planners
- End users who want to know more about the global market and latest developments in this industry
Scope of the Report
The research report segments the filtration and contamination control market into the following submarkets:
By Filtration Type:
- Liquid Filtration
- Air Filtration
By Customer Type:
- Aftermarket
- OEM (First Fit)
By Application:
-
Engine
- On Road
- Agriculture
- Construction
- Mining and Marine
-
Industrial
- Industrial Machinery
- Oil & Gas
- Aerospace
- Gas Turbine
- Power Generation
- Others
By Geography:
- North America
- Europe
- APAC
- RoW
Available Customizations:
With the given market data, MarketsandMarkets offers customizations according to the company’s specific needs. The following customization options are available for the report:
Company Information
- Detailed analysis and profiling of additional market players (up to 5)


Growth opportunities and latent adjacency in Filtration and Contamination Control Market