Explosive Detectors Market by Technology (Trace (IMS, Colorimetric, Mass Spectrometry), Bulk (X-Ray System, Neutron Method, Optical)), Product Type (Vehicle Mounted, Handheld, Robotics, Biosensors), Application, Geography - Forecast to 2020


The explosive detectors market size, in terms of value, is estimated to grow from USD 3.56 Billion in 2015 to USD 6.12 Billion by 2020, at a CAGR of 11.4% between 2015 and 2020. Although the market is currently dominated by the bulk detectors technology, the trace detectors segment is expected to grow at the highest rate during the forecast period. This report forecasts the market size and future growth potential of the market across different segments such as technology, product types, verticals, and region. The base year considered for the study is 2014 and the market size forecast is provided for the period between 2015 and 2020.
According to the MarketsandMarkets forecast, the explosive detectors market size, in terms of value, is expected to grow from USD 3.56 Billion in 2015 to USD 6.12 Billion by 2020, at a CAGR of 11.4% between 2015 and 2020. The rising terrorist activities across the globe, various government legislations for enhanced security screening, and increasing demand for tighter screening process and antiterrorism activities create a huge demand for explosive detectors across the world. With the intensified risk of terrorism, security professionals at nuclear power plants, embassies, high-risk facilities, transportation, and government agencies are exploring explosives detection, as part of a comprehensive security approach to help protect the citizens and important infrastructure from terrorist threats.
The scope of this report covers the explosive detectors market segmented on the basis of technology, product types, verticals, and geography. The IMS-based trace market is expected to hold the largest market share between 2015 and 2020. The market for mass spectrometry-based trace detectors is expected to grow at the highest rate during the forecast period, as it can overcome most of the limitations of IMS explosive detectors in terms of quantitative capability and selectivity. The market for X-ray systems is expected to hold the largest market share and dominate the bulk market between 2015 and 2020. X-ray systems are especially used at airports where security is a major concern. X-ray systems are in demand in the market as they can detect explosives, weapons, and contraband carried by passengers on their person and/or in their baggage.
The explosive detectors are being increasingly used in various verticals, such as military and defense, cargo & transport, aviation, public places, commercial, and others which have led to the growth of the market across the globe. The commercial sector is expected to grow at the highest rate between 2015 and 2020 in the explosive detectors market. The market is also expected to witness growth in the public places and aviation verticals during the forecast period.
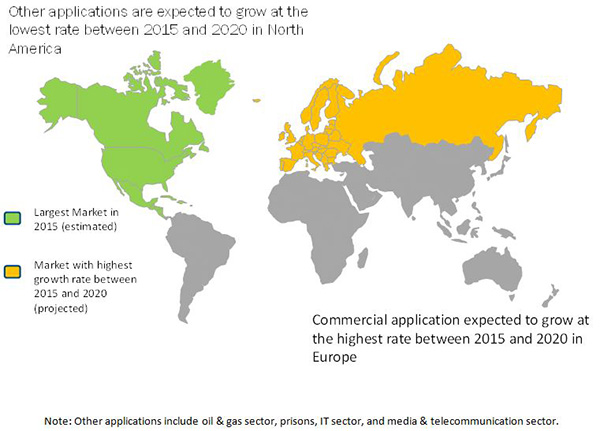
North America is expected to hold the largest market share and dominate the explosive detectors market between 2015 and 2020 owing to the presence of large number of security vendors. Europe also offers potential growth opportunities, given the in recent terrorist attacks and the presence of critical infrastructure in the region.
However, the increasing cyber threats and decreasing government spending in explosive detectors restrains the growth of the market. With the emergence of new cyber threats, the defense budgets of governments worldwide are getting hampered, and thus the government spending on explosive detectors is decreasing. This high spending toward cyber threats limits the funds for research and development of better explosive detectors, as the same funds are diverted toward the protection of information. The key players in the market include Smiths Detection, Morpho Detection, L-3 Communication, OSI Systems, and Nuctech among others. These players have adopted various strategies such as partnerships, agreements, contracts, mergers and acquisitions, and new product developments to achieve growth in the global explosive detectors market.
To speak to our analyst for a discussion on the above findings, click Speak to Analyst
 Exclusive indicates content/data unique to MarketsandMarkets and not available with any competitors.
Table of Contents
1 Introduction (Page No. - 16)
1.1 Objectives of the Study
1.2 Market Definition
1.3 Study Scope
1.3.1 Markets Covered
1.3.2 Years Considered for the Study
1.4 Currency
1.5 Limitations
1.6 Stakeholders
2 Research Methodology (Page No. - 20)
2.1 Research Data
2.1.1 Secondary Data
2.1.1.1 Key Data From Secondary Sources
2.1.2 Primary Data
2.1.2.1 Key Data From Primary Sources
2.1.2.2 Key Industry Insights
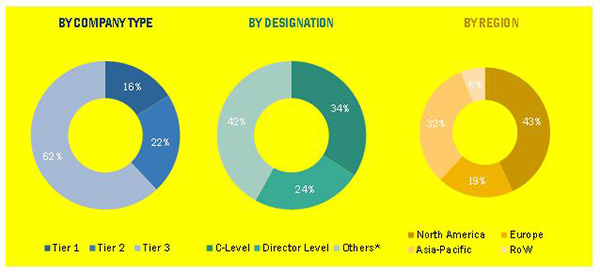
2.1.2.3 Breakdown of Primary Interviews
2.2 Demand-Side Analysis for the Explosive Detectors Market
2.2.1 Rise in Terrorist Activities Across the Globe
2.2.2 Increasing Demand for Security at Airports
2.3 Market Size Estimation
2.4 Market Breakdown and Data Triangulation
2.5 Assumptions
3 Executive Summary (Page No. - 29)
4 Premium Insights (Page No. - 35)
4.1 Attractive Market Opportunities for Explosive Detectors
4.2 Market, By Application
4.3 Europe Expected to Grow at the Highest CAGR in the Market Between 2015 and 2020
4.4 North America Held A Major Share of the Market (2014)
4.5 Market, By Technology
4.6 Market, By Product Type
5 Market Overview (Page No. - 40)
5.1 Introduction
5.2 Market Evolution
5.3 Market Segmentation
5.3.1 Market, By Technology
5.3.2 Market, By Product Type
5.3.3 Market, By Vertical
5.3.4 Market, By Geography
5.4 Market Dynamics
5.4.1 Drivers
5.4.1.1 Rise in Terrorist Activities Across the Globe
5.4.1.2 Government Legislations for Enhanced Security Screening
5.4.1.3 Increasing Demand for Tighter Screening Process and Antiterrorism Activities
5.4.1.4 Growing Security in the Aviation Industry
5.4.2 Restraints
5.4.2.1 Increasing Cyber Threats and Decreasing Government Spending on Explosive Detectors
5.4.2.2 Declining Global Spending of the Defense Sector
5.4.2.3 Risk of Criticism Or Bad Press If the Device Fails in Public Safety
5.4.3 Opportunities
5.4.3.1 Innovation of More Reliable and Cost Effective Explosive Detectors
5.4.4 Challenges
5.4.4.1 Health Hazards of Full-Body Screening Using X-Ray Bulk Detectors
5.4.4.2 High Cost of Operation and Maintenance
6 Industry Trends (Page No. - 52)
6.1 Introduction
6.2 Value Chain Analysis
6.2.1 Value Chain Analysis of Explosive Detectors (2014)
6.3 Major Trends in the Explosive Detectors Market
6.3.1 Joint Development Programs
6.3.2 Development of Multi Platform Designs for Explosive Detectors
6.3.3 Hybrid System Development
6.4 Porter’s Five Forces Analysis
6.4.1 Threat of New Entrants
6.4.2 Threat of Substitutes
6.4.3 Bargaining Power of Suppliers
6.4.4 Bargaining Power of Buyers
6.4.5 Degree of Competition
7 Market, By Technology (Page No. - 61)
7.1 Introduction
7.2 Trace Detectors
7.2.1 Ion Mobility Spectrometry (IMS)
7.2.2 Thermo-Redox
7.2.3 Chemiluminescence
7.2.4 Colorimetric
7.2.5 Mass Spectrometry
7.3 Bulk Detectors
7.3.1 X-Ray Systems
7.3.2 Neutron Method-Based Systems
7.3.3 Optical Detectors
8 Market, By Product Type (Page No. - 73)
8.1 Introduction
8.2 Vehicle-Mounted Explosive Detectors
8.3 Handheld Explosive Detectors
8.4 Robotics-Based Explosive Detectors
8.5 Biosensors
9 Market, By Vertical (Page No. - 91)
9.1 Introduction
9.2 Military and Defense
9.3 Cargo and Transport
9.4 Aviation
9.5 Public Places
9.5.1 Law Enforcement
9.5.2 Home Security
9.5.3 Others
9.6 Commercial
9.6.1 Retail
9.6.2 Academia and Institutional
9.6.3 Healthcare
9.6.4 Hospitality
9.6.5 Banking, Financial Services, and Insurance (BFSI)
9.7 Other Verticals
10 Market, By Geography (Page No. - 112)
10.1 Introduction
10.2 North America
10.2.1 North America to Drive the Market
10.2.2 U.S.
10.2.2.1 U.S.: the Largest Market for Explosive Detectors in 2014
10.2.3 Canada
10.2.3.1 Dependence of the Canadian Market on the U.S. and European Suppliers
10.2.4 Mexico
10.2.4.1 Mexico Estimated to Grow at A Significant Rate in the Market During the Forecast Period
10.3 Europe
10.3.1 Recent Paris Attacks Expected to Foster the Growth of European Market
10.3.2 Germany
10.3.2.1 Germany Accounted for A Share of 17% of the European Market in 2014
10.3.3 U.K.
10.3.3.1 U.K.: A Substantially Mature Market
10.3.4 France
10.3.4.1 France: Market Demand is Further Propelled By the Recent Paris Attacks
10.3.5 Russia
10.3.5.1 Russia: Huge Potential for Market
10.3.6 Rest of Europe
10.3.6.1 Rest of Europe : Better Economic Conditions
10.4 APAC
10.4.1 APAC Market Driven By Thriving Economies
10.4.2 China
10.4.2.1 China : Fastest Growing Market in APAC
10.4.3 Japan
10.4.3.1 Japan : Great Scope for Development
10.4.4 South Korea
10.4.4.1 South Korea : High Growth in Aviation Sector
10.4.5 Rest of APAC
10.4.5.1 Rest of APAC : India & Australia are Emerging Markets With Significant Potential
10.5 Rest of the World (RoW)
10.5.1 RoW has A Developing Market for Explosive Detectors
10.5.2 Middle East & Africa
10.5.2.1 Middle East & Africa : Infrastructure Development Prevalent in the Middle East & Africa
10.5.3 South America
10.5.3.1 South America : Developing Economies Expected to Drive Future Growth
11 Competitive Landscape (Page No. - 132)
11.1 Overview
11.2 Market Ranking Analysis of the Market
11.3 Competitive Situation and Trends
11.3.1 New Product Launches/New Product Developments
11.3.2 Mergers & Acquisitions
11.3.3 Partnerships, Contracts, Agreements, Joint Ventures, and Collaborations
11.3.4 Other Developments
12 Company Profiles (Page No. - 141)
(Overview, Products and Services, Financials, Strategy & Development)*
12.1 Introduction
12.2 Safran SA
12.3 Smiths Group PLC
12.4 L-3 Communications Holdings, Inc.
12.5 OSI Systems, Inc.
12.6 Nuctech Co. Ltd.
12.7 Implant Sciences Corporation
12.8 Flir Systems, Inc.
12.9 Chemring Group PLC
12.10 American Science & Engineering, Inc.
12.11 Analogic Corporation
12.12 Leidos Holdings, Inc.
*Details on Overview, Products and Services, Financials, Strategy & Development Might Not Be Captured in Case of Unlisted Companies.
13 Appendix (Page No. - 177)
13.1 Insights of Industry Experts
13.2 Discussion Guide
13.3 Introducing RT: Real-Time Market Intelligence
13.4 Available Customizations
13.5 Related Reports
List of Tables (73 Tables)
Table 1 Explosive Detectors Market, 2013–2020
Table 2 Market, By Trace Detection Technology, 2013–2020 (USD Million)
Table 3 Market, By Bulk Detection Technology, 2013–2020 (USD Million)
Table 4 Market, By Region, 2013–2020 (USD Billion)
Table 5 Market Drivers
Table 6 Increasing Cyber Threats and Decreasing Government Spending on Explosive Detectors Hampering the Growth of the Exlposive Detectors Market
Table 7 Innovation of More Reliable and Cost-Effective Explosive Detectors Provide A Key Opportunity for the Market
Table 8 Health Hazards of Full-Body Screening Using X-Ray Bulk Detectors is A Key Challenge for the Explosive Detectors Market
Table 9 Market Size, in Terms of Value and Volume, 2013–2020
Table 10 Market Size, By Technology, 2013–2020 (USD Billion)
Table 11 Market Size, By Technology, 2013–2020 (Thousand Units)
Table 12 Market, By Trace Detection Technology, 2013–2020 (USD Million)
Table 13 Market Size, By Trace Detection Technology, 2013–2020 (Thousand Units)
Table 14 Trace Detectors Market, By Product Type, 2013–2020 (USD Million)
Table 15 Trace Detectors Market Size, By Product Type, 2013–2020 (Thousand Units)
Table 16 Market, By Bulk Detection Technology, 2013–2020 (USD Billion)
Table 17 Market Size, By Bulk Detection Technology, 2013–2020 (Thousand Units)
Table 18 Bulk Detectors Market, By Product Type, 2013–2020 (USD Billion)
Table 19 Bulk Detectors Market Volume, By Product Type, 2013–2020 (Thousand Units)
Table 20 Market, By Product Type, 2013–2020 (USD Million)
Table 21 Market Size, By Product Type, 2013–2020 (Thousand Units)
Table 22 Vehicle-Mounted Explosive Detectors , By Technology, 2013–2020 (USD Million)
Table 23 Vehicle-Mounted Explosive Detectors , By Application, 2013–2020 (USD Million)
Table 24 Market Size, By Application, 2013–2020 (Thousand Units)
Table 25 Vehicle-Mounted Explosive Detectors Market, By Commercial Application, 2013–2020 (USD Million)
Table 26 Market Size, By Commercial Application, 2013–2020 (Thousand Units)
Table 27 Market, By Technology, 2013–2020 (USD Million)
Table 28 Market, By Application, 2013–2020 (USD Million)
Table 29 Market Size, By Application, 2013–2020 (Thousand Units)
Table 30 Market, By Commercial Application, 2013–2020 (USD Million)
Table 31 Market Size, By Commercial Application, 2013–2020 (Thousand Units)
Table 32 Market, By Technology, 2013–2020 (USD Million)
Table 33 Robotics-Based Explosive Detectors Market, By Application, 2013–2020 (USD Million)
Table 34 Market Size, By Application, 2013–2020 (Thousand Units)
Table 35 Market, By Commercial Application, 2013–2020 (USD Million)
Table 36 Market Size, By Commercial Application, 2013–2020 (Thousand Units)
Table 37 Biosensors Explosive Detectors Market, By Technology, 2013–2020 (USD Million)
Table 38 Market, By Application, 2013–2020 (USD Million)
Table 39 Market Size, By Application, 2013–2020 (Thousand Units)
Table 40 Market, By Commercial Application, 2013–2020 (USD Million)
Table 41 Market Size, By Commercial Application, 2013–2020 (Thousand Units)
Table 42 Market, By Vertical, 2013–2020 (USD Million)
Table 43 Market Size, By Vertical, 2013–2020 (Thousand Units)
Table 44 Military and Defense: Market, By Product Type, 2013–2020 (USD Million)
Table 45 Military and Defense: Market, By Region, 2013–2020 (USD Million)
Table 46 Cargo and Transport: Market, By Product Type, 2013–2020 (USD Million)
Table 47 Cargo and Transport: Market, By Region, 2013–2020 (USD Million)
Table 48 Aviation: Market, By Product Type, 2013–2020 (USD Million)
Table 49 Aviation: Market, By Region, 2013–2020 (USD Million)
Table 50 Public Places: Market, By Vertical, 2013–2020 (USD Million)
Table 51 Public Places: Market Size, By Vertical, 2013–2020 (Thousand Units)
Table 52 Public Places: Market, By Product Type, 2013–2020 (USD Million)
Table 53 Public Places: Market, By Region, 2013–2020 (USD Million)
Table 54 Commercial: Market, By Application, 2013–2020 (USD Million)
Table 55 Commercial: Market Size, By Application, 2013–2020 (Thousand Units)
Table 56 Commercial: Market, By Product Type, 2013–2020 (USD Million)
Table 57 Commercial: Market, By Region, 2013–2020 (USD Million)
Table 58 Other Verticals: Market, By Product Type, 2013–2020 (USD Million)
Table 59 Other Verticals: Market, By Region, 2013–2020 (USD Million)
Table 60 Exlposive Detectors Market, By Region, 2013–2020 (USD Million)
Table 61 North America: Market Size, By Country, 2013–2020 (USD Million)
Table 62 North America: Market Size, By Application, 2013–2020 (USD Million)
Table 63 Europe: Market Size, By Country, 2013–2020 (USD Million)
Table 64 Europe: Market Size, By Application, 2013–2020 (USD Million)
Table 65 APAC: Market Size, By Country, 2013–2020 (USD Million)
Table 66 APAC: Market Size, By Application, 2013–2020 (USD Million)
Table 67 RoW: Market Size, By Region, 2013–2020 (USD Million)
Table 68 RoW: Market Size, By Application, 2013–2020 (USD Million)
Table 69 Global Market Ranking, By Key Player, 2014
Table 70 New Product Launches
Table 71 Mergers & Acquisitions
Table 72 Partnerships, Contracts, Agreements, and Joint Ventures
Table 73 Other Strategies
List of Figures (97 Figures)
Figure 1 Markets Covered in the Study
Figure 2 Research Design
Figure 3 Flow of Report Writing
Figure 4 Number of Airports Across the Regions, 2013
Figure 5 Bottom-Up Approach
Figure 6 Top-Down Approach
Figure 7 Market Breakdown and Data Triangulation
Figure 8 Assumptions of the Research Study
Figure 9 Market Size, 2013–2020 (USD Billion)
Figure 10 Market, By Technology, 2015 vs 2020 (USD Billion)
Figure 11 Market, By Product Type, 2013–2020 (USD Billion)
Figure 12 Market, By Application, 2015 vs 2020 (USD Billion)
Figure 13 Market, By Geography, 2015
Figure 14 The Market is Expected to Have A High Growth Rate Between 2015 and 2020
Figure 15 Commercial Application Expected to Grow at the Highest CAGR Between 2015 and 2020 in the Market
Figure 16 Aviation Held the Largest Share of the European Market, 2014
Figure 17 Europe Expected to Grow at the Highest CAGR in the Global Market Till 2020
Figure 18 Trace Detectors Market Expected to Grow at the Highest CAGR Between 2015 and 2020
Figure 19 Handheld Explosive Detectors Market Expected to Grow at the Highest CAGR Between 2015 and 2020
Figure 20 Evolution of Explosive Detectors in the Market
Figure 21 Market Segmentation: By Technology
Figure 22 Market, By Product Type
Figure 23 Market, By Vertical
Figure 24 Market, By Geography
Figure 25 Rise in Terrorist Activities Across the Globe Driving the Market
Figure 26 Value Chain Analysis of Explosive Detectors (2014): Major Value is Added During the Manufacturing and Assembly Phases
Figure 27 Industry Trends in the Market
Figure 28 Porter’s Five Forces Analysis: Bargaining Power of Buyers Had A High Impact on the Market in 2014
Figure 29 Threat of New Entrants
Figure 30 Threat of Substitutes
Figure 31 Bargaining Power of Suppliers
Figure 32 Bargaining Power of Buyers
Figure 33 Degree of Competition
Figure 34 Segmentation of Explosive Detectors Market, By Technology
Figure 35 Market Size, By Technology, 2015 vs 2020
Figure 36 Market, By Trace Detection Technology, 2015 vs 2020 (USD Million)
Figure 37 Trace Detectors Market, By Product Type, 2015 vs 2020 (USD Million)
Figure 38 Market, By Bulk Detection Technology, 2015 vs 2020 (USD Billion)
Figure 39 Bulk Detectors Market, By Product Type, 2015 vs 2020 (USD Billion)
Figure 40 Market, By Product Type
Figure 41 Market Size, By Product Type, 2015 vs 2020 (USD Million)
Figure 42 Market Size, By Product Type, 2015 vs 2020 (Thousand Units)
Figure 43 Vehicle-Mounted Explosive Detectors Market Size, By Application, 2015 vs 2020 (USD Million)
Figure 44 Vehicle-Mounted Explosive Detectors Market Size, By Commercial Application, 2015 vs 2020 (USD Million)
Figure 45 Market Size, By Application, 2015 vs 2020 (USD Million)
Figure 46 Handheld Explosive Detectors Market Size, By Commercial Application, 2015 vs 2020 (USD Million)
Figure 47 Market Size, By Application, 2015 vs 2020 (USD Million)
Figure 48 Market Size, By Commercial Application, 2015 vs 2020 (USD Million)
Figure 49 Biosensors Explosive Detectors Market Size, By Application, 2015 vs 2020 (USD Million)
Figure 50 Biosensors Explosive Detectors Market Size, By Commercial Application, 2015 vs 2020 (USD Million)
Figure 51 Applications of Explosive Detectors
Figure 52 Market, By Vertical, 2015 vs 2020 (USD Million)
Figure 53 Market Size, By Vertical, 2015 vs 2020 (Thousand Units)
Figure 54 Military and Defense: Market, By Product Type, 2015 vs 2020 (USD Million)
Figure 55 Cargo and Transport: Market, By Product Type, 2015 vs 2020 (USD Million)
Figure 56 Aviation: Market, By Product Type, 2015 vs 2020 (USD Million)
Figure 57 Public Places: Market, By Vertical, 2015 vs 2020 (USD Million)
Figure 58 Public Places: Market Size, By Vertical, 2015 vs 2020 (Thousand Units)
Figure 59 Public Places: Market, By Product Type, 2015 vs 2020 (USD Million)
Figure 60 Commercial Applications of Explosive Detectors
Figure 61 Commercial: Market, By Application, 2015 vs 2020 (USD Million)
Figure 62 Commercial: Marketsize, By Application, 2015 vs 2020 (Thousand Units)
Figure 63 Commercial: Market, By Product Type, 2015 vs 2020 (USD Million)
Figure 64 Other Verticals: Market, By Product Type, 2015 vs 2020 (USD Million)
Figure 65 Market, By Geography
Figure 66 Geographic Snapshot of Market: Rapidly Growing Markets are Emerging as New Hot Spots
Figure 67 North America Expected to Hold the Largest Share of the Market By 2020
Figure 68 North American Market Snapshot: Demand Expected to Be Driven By the Upsurge in Terrorism
Figure 69 North America: Market Size, By Country, 2015 vs 2020 (USD Million)
Figure 70 North America: Market Size, By Application, 2015 vs 2020 (USD Million)
Figure 71 European Market Snapshot : Russia Accounted for the Highest Market Share in the European Region in 2014
Figure 72 Europe: Market Size, By Country, 2015 vs 2020 (USD Million)
Figure 73 Europe: Market Size, By Application, 2015 vs 2020 (USD Million)
Figure 74 APAC: Market Size, By Country, 2015 vs 2020 (USD Million)
Figure 75 APAC: Market Size, By Application, 2015 vs 2020 (USD Million)
Figure 76 RoW: Market Size, By Region, 2015 vs 2020 (USD Million)
Figure 77 RoW: Market Size, By Application, 2015 vs 2020 (USD Million)
Figure 78 Companies Adopted New Product Development and Partnerships, Agreements, & Contracts as the Key Growth Strategies Between 2012 and 2015
Figure 79 OSI Systems, Inc. Witnessed Highest Growth Rate Between 2012 and 2014
Figure 80 Market Evolution Framework—The Strategy of New Product Launches has Fueled Growth and Innovation in the Explosive Detecotrs Market Between 2013 and 2015
Figure 81 Battle for Market Share: Partnerships, Agreements, Contracts, Joint Ventures, and New Product Launches Were the Key Strategies Between 2012 and 2015
Figure 82 Geographic Revenue Mix of Top 5 Market Players (2014)
Figure 83 Safran SA : Company Snapshot
Figure 84 Safran SA : SWOT Analysis
Figure 85 Smiths Group PLC: Company Snapshot
Figure 86 Smiths Group PLC : SWOT Analysis
Figure 87 L-3 Communications Holdings, Inc. : Company Snapshot
Figure 88 L-3 Communications Holdings, Inc. : SWOT Analysis
Figure 89 OSI Systems, Inc.: Company Snapshot
Figure 90 OSI Systems, Inc. : SWOT Analysis
Figure 91 Nuctech Co. Ltd. : SWOT Analysis
Figure 92 Implant Sciences Corporation: Company Snapshot
Figure 93 Flir Systems, Inc.: Company Snapshot
Figure 94 Chemring Group PLC: Company Snapshot
Figure 95 American Science & Engineering, Inc.: Company Snapshot
Figure 96 Analogic Corporation: Company Snapshot
Figure 97 Leidos Holdings, Inc.: Company Snapshot
The research methodology used to estimate and forecast the explosive detectors market begins with capturing data on key vendor revenues through secondary research. The vendor offerings are also taken into consideration to determine the market segmentation. The bottom-up procedure was employed to arrive at the overall market size of the global market from the revenue of the key players in the market. After arriving at the overall market size, the total market was split into several segments and subsegments which are then verified through primary research by conducting extensive interviews with key industry people including CEOs, VPs, directors and executives. The data triangulation and market breakdown procedures were employed to complete the overall market engineering process and arrive at the exact statistics for all segments and subsegments. The breakdown of profiles of primary is depicted in the figure below:
To know about the assumptions considered for the study, download the pdf brochure
The main manufacturers in the explosive detectors market include Smiths Detection, Morpho Detection, L-3 Communication, OSI Systems, Nuctech, and others. These players have adopted various strategies such as partnerships, agreements, contracts, mergers and acquisitions, and new product developments to achieve growth in the market.
Key Target Audience
- Hardware & software manufacturers
- Government and financial institutions
- Distributors and retailers
- Managed security service providers
- Research organizations
- Consulting firms
- System integrators
Scope of the Report
The research report segments the explosive detectors market into following submarkets:
By Technology:
- Trace Detectors
- Bulk Detectors
By Product Type:
- Vehicle-Mounted
- Handheld
- Robotics
- Biosensors
By Vertical:
- Military and Defense
- Cargo and Transport
- Aviation
- Public Places
- Commercial
- Others
By Region:
- North America
- Europe
- Asia-Pacific
- Rest of the World
Available Customizations
With the given market data, MarketsandMarkets offers customizations as per the company’s specific needs. The following customization options are available for the report:
Product Analysis
- Product matrix which gives a detailed comparison of the product portfolio of each company
Geographic Analysis
- Further breakdown of the North American market
- Further breakdown of the European market
- Further breakdown of the APAC market
- Further breakdown of the RoW market
Company Information
- Detailed analysis and profiling of additional market players


Growth opportunities and latent adjacency in Explosive Detectors Market