
Cryocooler Market Size, Share & Trends

Cryocooler Market by Recuperative Heat Exchanger, Regenerative Heat Exchanger, Heat Dissipation Pipe, Preventive Maintenance Services, Gifford-McMahon Cryocoolers, Stirling Cryocoolers, Joule Thomson Cryocoolers, Military, Space - Global Forecast to 2030


OVERVIEW
Source: Secondary Research, Interviews with Experts, MarketsandMarkets Analysis
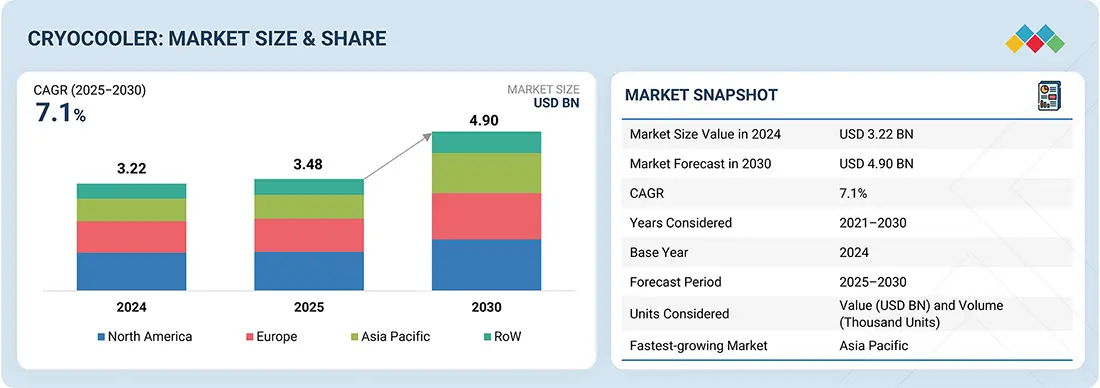
The cryocooler market is expected to be valued at USD 3.48 billion in 2025 and USD 4.90 billion by 2030. It is expected to register a CAGR of 7.1% during the forecast period. This is driven by the rising demand for compact, energy-efficient cooling technologies that support advanced aerospace, defense, and medical applications. Increasing focus on satellite missions, coupled with advancements in infrared detectors, superconducting magnets, and quantum devices, accelerate adoption. Cryocooler solutions offer improved thermal stability, vibration-free operation, and long operational lifespans, enabling reliable performance in critical environments.
KEY TAKEAWAYS
- By region, North America is estimated to dominate the cryocooler market with a share of 35.4% in 2024.
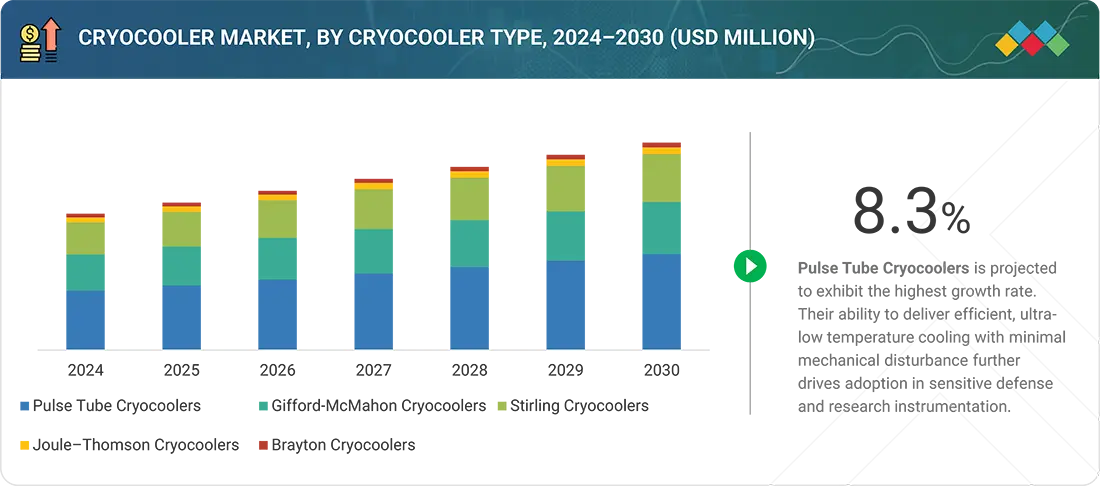
- By cryocooler type, the pulse tube cryocooler segment is projected to grow at the highest CAGR of 8.3% during the forecast period.
- By offering, the hardware segment is accounted for a share of 84% in 2024.
- By heat exchnager type, regenerative heat exchanger segment is estimated to dominate the cryocooler market with a share of 93.6% in 2024.
- By operating cycle, the closed-loop cycle segment is projected to grow at the highest CAGR o f7.5% during the forecast period.
- By temperature range, the 50K - 150K segment is accounted for a share of 55% in 2024.
- By application, the space segment is projected to grow at the highest CAGR of 10% during the forecast period.
- Thales (France), Northrop Grumman (US), AMETEK.Inc. (US) were identified as star players in the crycocooler market, given their strong global brand presence, extensive product portfolios, and continuous focus on innovation. Creare and Fabrum have emerged as the startups and SMEs driving technological innovation and market agility in the crycocooler market.
The cryocooler market is projected to expand significantly in the coming years, driven by the accelerating demand in the aerospace & defense space, which is catalyzing sustained cryocooler adoption, the rapid expansion of quantum computing, which is creating the need for advanced low-temperature thermal management solutions, and the transformation of the healthcare sector, which is fueling the adoption of helium-free MRI systems across global institutions. In addition, the strong focus on space exploration and satellite deployment, along with the rising importance of cryogenic cooling in superconducting technologies, is expected to create growth opportunities. Continuous technological advancements aimed at improving energy efficiency and reducing operational costs further strengthen the market adoption.
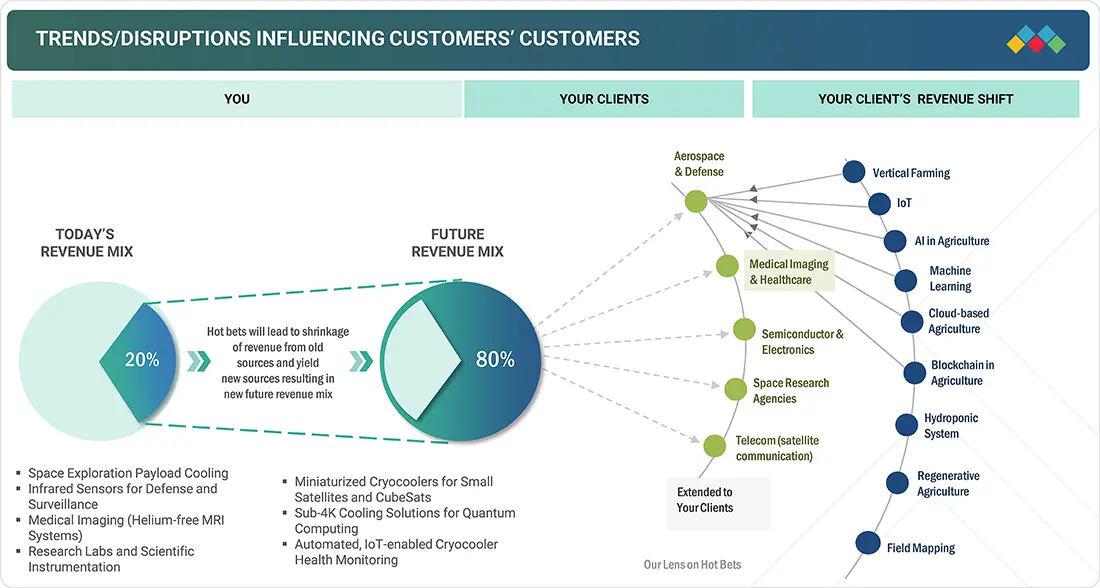
TRENDS & DISRUPTIONS IMPACTING CUSTOMERS' CUSTOMERS
This section outlines the key trends and disruptions shaping customer operations in the cryocooler market. The growing demand for advanced cooling technologies in quantum computing, space exploration, and semiconductor manufacturing is expected to create strong growth opportunities for cryocooler manufacturers over the forecast period. Increasing investments in quantum computing infrastructure and the commercialization of large-scale quantum processors augment the need for ultra-low-temperature cryogenic systems. Additionally, the cryocooler market is witnessing expanded adoption in aerospace, defense, and satellite communication, where miniaturized cryocoolers enable enhanced infrared imaging, navigation, and surveillance capabilities. In the medical sector, the shift toward helium-free MRI systems and cryogenic solutions for advanced diagnostics reduces operational costs while improving energy efficiency. Cryocoolers are also becoming essential for supporting emerging applications, such as superconducting electronics, particle physics research, and hydrogen energy storage, reflecting their versatility across industries. As cryogenic R&D accelerates and IoT-enabled predictive maintenance technologies improve system performance, cryocooler suppliers will have increasing opportunities to expand their presence in high-tech and commercial markets globally.
Source: Secondary Research, Interviews with Experts, MarketsandMarkets Analysis
MARKET DYNAMICS
Level
-
Accelerating cryocooler demand from aerospace & defense and healthcare sectors

-
Surging adoption of quantum computing technology

Level
-
Low adoption in cost-sensitive markets due to high upfront costs and extended payback

-
Maintenance-driven expenditure and workforce skill gaps

Level
-
Emergence of sub-4K pre-coolers tailored for quantum data centers

-
Commercialization of small satellites

Level
-
Limited thermal tolerance and reliability issues in high-density cryocooler arrays

Source: Secondary Research, Interviews with Experts, MarketsandMarkets Analysis
Driver: Accelerating cryocooler demand from aerospace & defense and healthcare sectors
Growing requirements for low-temperature applications in aerospace, defense, and healthcare fuel cryocooler demand. Increasing adoption in quantum computing, superconducting technologies, and medical imaging systems reinforces the need for reliable, compact, and energy-efficient cryocoolers across critical industries.
Restraint: High capital intensity constrains scalability across cost-sensitive customer segments
Despite ongoing innovation, high initial investment and complex integration requirements remain key barriers. Cost-sensitive customers, especially in emerging regions, face slower adoption due to limited subsidies or financing mechanisms. Performance constraints in thermal management, vibration control, and device longevity also restrict deployment in certain industrial and commercial applications.
Opportunity: Quantum computing scale-up driving sub-4K pre-cooler demand surges
The rapid scale-up of quantum computing boosts the demand for sub-4K cryocoolers. Increasing investments in quantum hardware require reliable low-temperature pre-cooling solutions. Growth in research labs and commercial quantum centers globally drives the adoption. Advancements in cryocooler efficiency further accelerate market uptake.
Challenge: Geopolitical risks destabilize specialized component sourcing across the critical region
Geopolitical tensions are disrupting the supply of specialized cryocooler components. Critical regions face export restrictions and supply chain uncertainties. Dependence on limited high-tech suppliers increases vulnerability. These factors can delay production and elevate costs, restraining market growth.
Cryocooler Market: COMMERCIAL USE CASES ACROSS INDUSTRIES
| COMPANY | USE CASE DESCRIPTION | BENEFITS |
|---|---|---|
 |
Deployed long-life cryocoolers on space telescopes and satellite instruments to achieve deep cryogenic cooling of infrared sensors | Enabled ultra-sensitive IR imaging | Reduced dependency on expendable cryogens | Extended mission lifetimes | Ensured reliable performance in harsh space environments |
 |
Implemented sorption and mechanical cryocoolers in missions such as Herschel and Planck for sub-Kelvin detector cooling | Delivered stable low-temperature environments for astrophysics instruments | Improved measurement precision | Increased observational sensitivity | Supported multi-year mission operations |
 |
Integrated cryogen-free cryocooler systems to maintain dilution refrigerators for quantum computing platforms | Provided continuous ultra-low temperature operation without liquid helium | Improved uptime and scalability of quantum processors | Reduced operating costs for superconducting qubit research |
 |
Utilized miniature Stirling cryocoolers in cooled infrared imaging systems for defense, aerospace, and industrial monitoring | Achieved superior thermal sensitivity | Extended detection range | Enhanced image quality in challenging conditions | Improved reliability with compact, rugged cooling units |
Logos and trademarks shown above are the property of their respective owners. Their use here is for informational and illustrative purposes only.
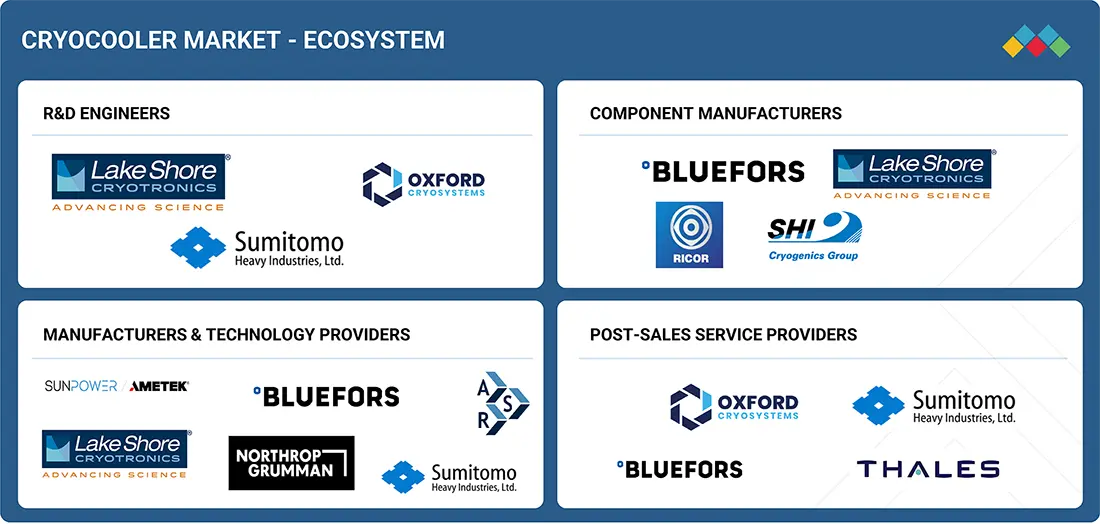
MARKET ECOSYSTEM
The cryocooler market operates within a highly specialized and interconnected ecosystem that includes a range of stakeholders spanning multiple industries. From cryogenic component manufacturers, refrigeration system integrators, and material suppliers to software developers, automation solution providers, and service organizations, every participant plays a key role in advancing cryocooler design, deployment, and lifecycle management. This ecosystem also integrates research institutes, aerospace and defense contractors, semiconductor manufacturers, and healthcare providers, reflecting the technology’s cross-industry relevance. With rising demand for compact, energy-efficient, and high-reliability cooling systems across applications such as quantum computing, satellite payload cooling, superconducting systems, and advanced medical imaging, the ecosystem is rapidly evolving. Companies are increasingly incorporating AI-based performance monitoring, predictive maintenance platforms, and advanced simulation tools to optimize cryocooler performance and reliability. The market further involves collaborations between aerospace and defense firms, robotics and automation specialists, and niche cryogenic research service providers. This interconnected landscape emphasizes cross-domain synergies that drive innovation, reduce system complexity, and improve operational efficiency. By leveraging advancements in materials science, manufacturing precision, and smart diagnostics, stakeholders are creating a more resilient, scalable, and sustainable cryocooling infrastructure to meet future demands in space exploration, energy research, and healthcare innovation.
Logos and trademarks shown above are the property of their respective owners. Their use here is for informational and illustrative purposes only.
MARKET SEGMENTS
Source: Secondary Research, Interviews with Experts, MarketsandMarkets Analysis
Cryocooler Market, By Cryocooler Type
The pulse tube cryocoolers segment accounted for a significant share in 2024. Its growth is due to the adoption in space research, medical imaging, and defense systems due to their vibration-free operation, high reliability, and long operational life. Their ability to deliver stable cooling without moving parts makes them especially suitable for sensitive instruments, ensuring lower maintenance costs and enhanced performance.
Cryocooler Market, By Offering
In 2024, hardware offering accounted for the largest share of the global market. These systems provide a balance of performance and cost, making them ideal for applications such as satellite instruments, medical diagnostics, defense technologies, and sensitive electronics cooling, with their adaptability ensuring sustained demand across industries.
Cryocooler Market, By Heat Exchanger Type
The regenerative heat exchanger segment held the largest share in 2024, driven by broad adoption in aerospace, healthcare, and research applications. Regenerative heat exchangers enable faster cooling, lower energy use, and improved reliability compared with conventional technologies, making them vital in advanced operational environments.
Cryocooler Market, By Operating Cycle
The closed-loop cycle segment captured the largest market share in 2024, backed by strong demand from aerospace, defense, and electronics industries. Closed-loop cryocoolers are favored for their energy efficiency, compact design, and seamless integration into automated systems, helping reduce costs while boosting output.
Cryocooler Market, By Temperature Range
The market for >50–150 K segment is capturing largest share in 2024. High demand from medical imaging, space exploration, and defense applications is driving adoption in the >50–150 K range, where cryocoolers deliver efficiency, compact sizing, and compatibility with automated systems translating to cost benefits and higher performance.
Cryocooler Market, By Application
The market for military segment held the largest share in 2024. In the military sector, cryocoolers are increasingly adopted for their efficiency, reliability, and ability to support mission-critical systems such as infrared sensors, satellite payloads, and surveillance equipment, enabling enhanced performance and cost-effective operation.
REGION
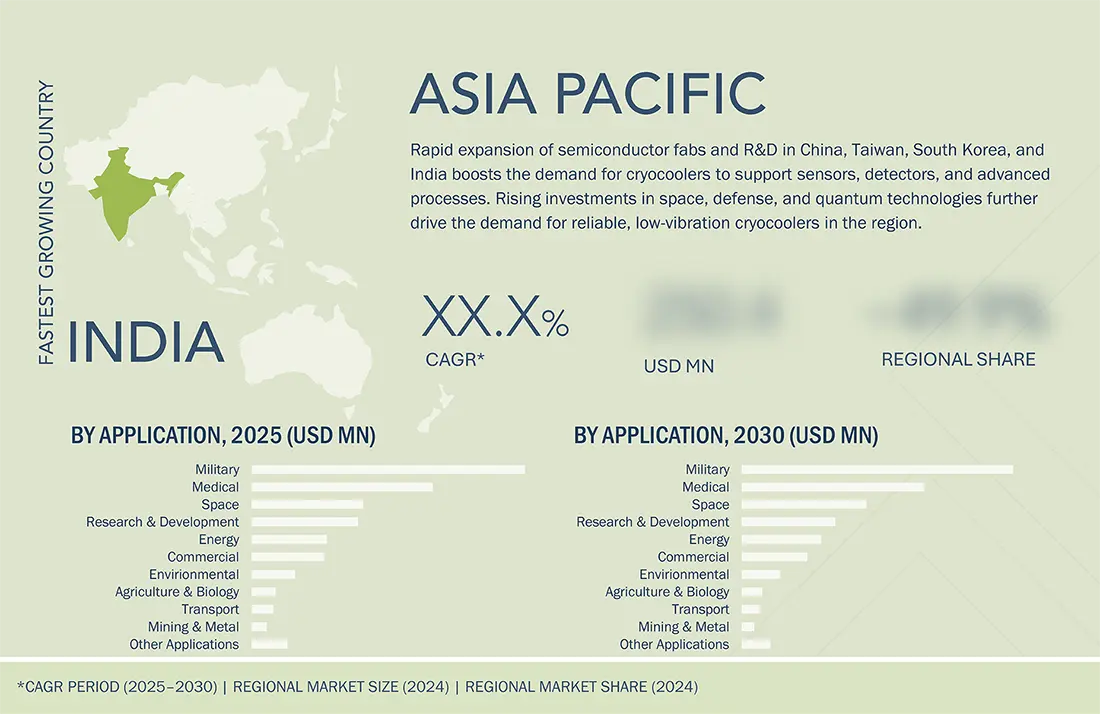
Asia Pacific to be fastest-growing region in global cryocooler market during forecast period
Asia Pacific is projected to capture the largest market share of the cryocooler industry in 2030. The regional growth is due to the rapid industrialization, growing aerospace and defense programs, rising demand in healthcare, and increasing investment in advanced research infrastructure. Additionally, government initiatives, such as India’s defense offset policies promoting local production of Stirling cryocoolers, and Japan’s AIST collaboration with Bluefors to co-develop advanced cryogenic refrigerators, accelerate innovation and regional self-reliance.
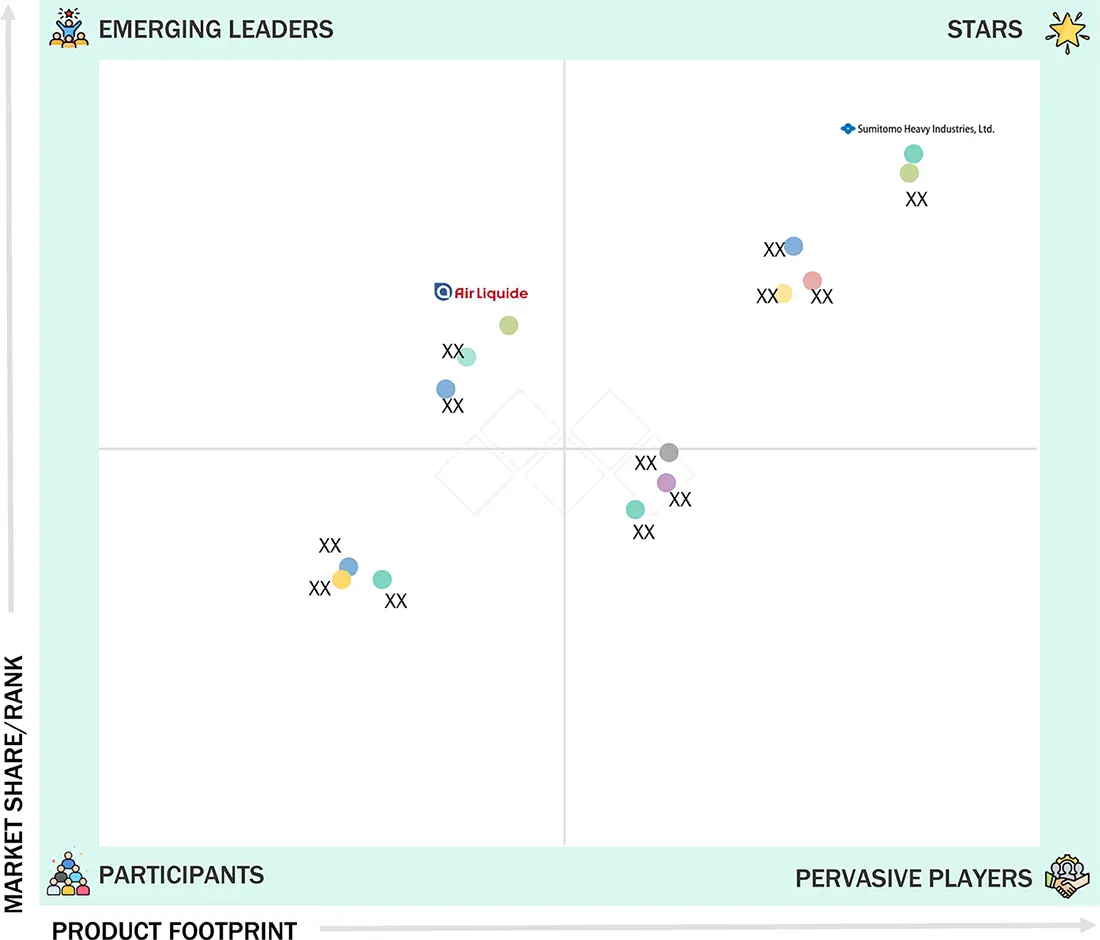
Cryocooler Market: COMPANY EVALUATION MATRIX
In the cryocooler companies matrix, Sumitomo Heavy Industries, Ltd. (Star) leads with a strong market presence and a broad portfolio serving applications in medical imaging, space research, and defense systems. The company drives large-scale adoption through continuous innovation, global partnerships, and extensive distribution networks. Air Liquide Advanced Technologies(Emerging Leader) is steadily strengthening its position by expanding offerings for industrial and research applications.
Source: Secondary Research, Interviews with Experts, MarketsandMarkets Analysis
KEY MARKET PLAYERS
MARKET SCOPE
| REPORT METRIC | DETAILS |
|---|---|
| Market Size Value in 2024 | USD 3.22 BN |
| Revenue Forecast in 2030 | USD 4.90 BN |
| Growth Rate | 7.10% |
| Years Considered | 2021–2030 |
| Base Year | 2024 |
| Forecast Period | 2025–2030 |
| Units Considered | Value (USD Million) and Volume (Thousand Units) |
| Report Coverage | Revenue Forecast, Company Ranking, Competitive Landscape, Growth Factors, and Trends |
| Segments Covered | • By Cryocooler Type: Gifford-McMahon Cryocoolers, Pulse Tube Cryocoolers, Stirling Cryocoolers, Joule–Thomson Cryocoolers, and Brayton Cryocoolers • By Offering: Hardware and Services • By Heat Exchanger Type: Recuperative Heat Exchanger and Regenerative |
| Regional Scope | North America, Europe, Asia Pacific, and RoW |
WHAT IS IN IT FOR YOU: Cryocooler Market REPORT CONTENT GUIDE
DELIVERED CUSTOMIZATIONS
We have successfully delivered the following deep-dive customizations:
| CLIENT REQUEST | CUSTOMIZATION DELIVERED | VALUE ADDS |
|---|---|---|
| Aerospace & Defense Contractor | • Competitive benchmarking of cryocooler technologies (Stirling, Pulse Tube, Gifford-McMahon, and JT) • Mapping suppliers by defense-grade certifications • Lifecycle cost and | • Identify most cost-effective and reliable solutions for mission-critical payloads • Shortlist suppliers for long-term defense contracts • Support technology selection for satellite & infrared systems |
| Medical Imaging OEM (MRI Manufacturer) | • End-use adoption trends of cryocoolers in MRI • Evaluation of oil-free vs. conventional systems • Market sizing of helium-free cryocoolers | • Support strategic transition to helium-free systems • Enable competitive positioning vs. incumbents • Highlight growth opportunities in high-demand MRI markets |
| Cryocooler Component Supplier | • Supply chain mapping for compressors, heat exchangers, and cold heads • Cost–benefit analysis of localized vs. imported sourcing • Partnership and distribution network analysis | • Pinpoint niche opportunities for component supply • Build regional presence via strategic alliances • Optimize sourcing strategies to reduce costs |
| Energy & Industrial Gas Company | • Cryocooler adoption roadmap in LNG, hydrogen, and superconductivity applications • Technical feasibility study for large-scale deployments • ROI benchmarking across industrial verticals | • Support investment in emerging cryogenic applications • Enable diversification into clean energy and superconductivity markets • Identify high-growth regional demand pockets |
| Research Institution / University Lab | • Database of cryocooler suppliers offering R&D-grade units • Comparative performance analysis (cooling power, base temperature, vibration levels) • Funding & grant opportunity mapping | • Provide clarity for equipment procurement • Optimize R&D budgets with supplier benchmarking • Unlock collaboration opportunities in government-funded projects |
RECENT DEVELOPMENTS
- June 2025 : Sumitomo Heavy Industries released its highest-capacity single-stage cryocoolers, CH-160D3LT and CH-160D3 Series. These cryocoolers utilize Whisper technology for quieter operation and a Displex pneumatic drive system, which minimizes moving parts and wear
- March 2025 : Bluefors launched the PT205, a compact, high-performance two-stage pulse tube cryocooler designed specifically for advanced scientific applications and superconducting technologies like superconducting nanowire single-photon detectors.
- January 2024 : Sumitomo Heavy Industries launched the RJT-100 4K GM-JT Cryocooler, the highest-capacity 4 K cryocooler, delivering up to 9.0 W at 4.2 K (50/60 Hz). Its innovative hybrid design combines a Joule-Thomson cryocooler with a two-stage Gifford-McMahon cryocooler for pre-cooling helium gas, providing superior efficiency, temperature stability, and reduced maintenance needs compared to standard 4 K cryocoolers
Table of Contents
 Exclusive indicates content/data unique to MarketsandMarkets and not available with any competitors.
Methodology
The research study involved four major activities in estimating the size of the cryocooler market. Exhaustive secondary research has been done to collect important information about the market and peer markets. The validation of these findings, assumptions, and sizing with the help of primary research with industry experts across the value chain has been the next step. Both top-down and bottom-up approaches have been used to estimate the market size. The market breakdown and data triangulation have been adopted to estimate the market sizes of segments and sub-segments.
Secondary Research
In the secondary research process, various secondary sources have been referred to for identifying and collecting information required for this study. The secondary sources include annual reports, press releases, investor presentations of companies, white papers, and articles from recognized authors. Secondary research has been mainly done to obtain key information about the market’s value chain, the pool of key market players, market segmentation according to industry trends, regional outlook, and developments from both market and technology perspectives.
In the cryocooler market report, the global market size has been estimated using both the top-down and bottom-up approaches, along with several other dependent submarkets. The major players in the market were identified using extensive secondary research, and their presence in the market was determined using secondary and primary research. All the percentage shares, splits, and breakdowns have been determined using secondary sources and verified through primary sources. .
Primary Research
Extensive primary research has been conducted after understanding the cryocooler market scenario through secondary research. Several primary interviews have been conducted with key opinion leaders from demand- and supply-side vendors across four major regions—North America, Europe, Asia Pacific, and the Rest of the World. Approximately 25% of the primary interviews have been conducted with the demand-side vendors and 75% with the supply-side vendors. Primary data has been collected mainly through telephonic interviews, which consist of 80% of the total primary interviews; questionnaires and emails have also been used to collect the data.
After successfully interacting with industry experts, brief sessions were conducted with highly experienced independent consultants to reinforce the findings of our primary research. This, along with the opinions of the in-house subject matter experts, has led us to the findings described in the report.

Note: “Others” includes sales, marketing, and product managers.
To know about the assumptions considered for the study, download the pdf brochure
Market Size Estimation
In the market engineering process, both top-down and bottom-up approaches, along with data triangulation methods, have been used to estimate and validate the size of the cryocooler market and other dependent submarkets. The research methodology used to estimate the market sizes includes the following:
- Identifying the players in the cryocooler market, along with their offerings
- Analyzing each country, along with the presence of related major companies and system integrators in the countries, and identifying the service providers in the cryocooler market
- Identifying the market for each type of cryocooler (Gifford-McMahon Cryocoolers, Pulse-Tube Cryocoolers, Stirling Cryocoolers, Joule Thomson Cryocoolers, Brayton Cryocoolers) in each country and globally
- Identifying the major applications of cryocoolers, along with the types of cryocoolers required for various applications
- Estimating total cryocooler unit shipment globally by adding regional data (North America, Europe, Asia Pacific, and RoW)
- Estimating the weighted average cost of cryocoolers
- Verifying and cross-checking the estimates at every level by discussing with key opinion leaders, such as CXOs, directors, and operations managers, and finally with the domain experts in MarketsandMarkets
- Studying various paid and unpaid sources of information, such as annual reports, press releases, white papers, and databases
Cryocooler Market: Top-Down and Bottom-Up Approach

Data Triangulation
After arriving at the overall market size through the market size estimation process explained in the earlier section, the overall cryocooler market has been divided into several segments and subsegments. To complete the overall market engineering process and arrive at the exact statistics for all segments, the data triangulation and market breakdown procedures have been used, wherever applicable. The data has been triangulated by studying various factors and trends from both the demand and supply sides. Along with data triangulation and market breakdown, the market has been validated through the top-down and bottom-up approaches.
Market Definition
A cryocooler is a device that provides active cooling at cryogenic temperatures. According to the Cryogenic Society of America, a cryocooler is designed to allow active cooling at a temperature of about -150 degrees centigrade or lower. A cryocooler system uses the flow of gas inside the closed tube, which absorbs the heat and radiates it outside.
It is a mechanical device that generates low temperatures, similar to a domestic refrigerator. It consists of a compressor, a heat exchanger, an expansion device, and an evaporator. Cryocoolers help in mitigating the usage of cryogens such as liquid helium and liquid nitrogen and are capable of producing temperatures as low as 77 K or 4.2 K. Some of the basic features of a cryocooler include less weight, fast cool-down time, and vibration-less operation. The popular types of cryocoolers available worldwide include Stirling cryocoolers, Gifford McMahon (G-M) cryocoolers, Pulse Tube cryocoolers, Joule Thomson (J-T) cryocoolers, and Brayton cryocoolers.
Key Stakeholders
- End users of cryocoolers in various sectors such as military, medical, transport and logistics, energy, agriculture and biology, and environmental
- Hardware component (valves, compressors, cold heads, and power circuit boards for cryocoolers) manufacturers
- Service providers of cryocooler equipment manufacturers
- Research organizations and consulting companies
- Associations, organizations, forums, and alliances related to cryocoolers
- Government bodies, such as regulating authorities and policymakers
Report Objectives
- To describe and forecast the size of the cryocooler market by offering, cryocooler type, heat exchanger type, operating cycle, temperature range, application, and region, in terms of value
- To describe and forecast the market size of various segments across four key regions—North America, Europe, Asia Pacific, and Rest of the World (RoW), in terms of value
- To forecast the size of the cryocooler market, in terms of volume
- To provide detailed information regarding the drivers, restraints, opportunities, and challenges influencing the growth of the cryocooler market
- To analyze the cryocooler value chain and ecosystem, along with the average selling price of cryocoolers
- To strategically analyze the regulatory landscape, tariffs, standards, patents, Porter’s five forces, import and export scenarios, AI/Gen AI impact, trade values, the 2025 US Tariff, and case studies pertaining to the market under study
- To strategically analyze micromarkets1 with regard to individual growth trends, prospects, and contributions to the overall market
- To analyze opportunities in the market for stakeholders by identifying high-growth segments
- To provide details of the competitive landscape for market leaders
- To provide details of the macroeconomic outlook for regions
- To analyze strategies such as product launches, collaborations, and acquisitions adopted by players in the cryocooler market
- To profile key players in the cryocooler market and comprehensively analyze their market ranking based on their revenue, market share, and core competencies2
Available Customizations
With the given market data, MarketsandMarkets offers customizations according to the specific requirements of companies. The following customization options are available for the report:
Country-wise Information:
- Country-wise breakdown for North America, Europe, Asia Pacific, and Rest of the World
Company Information:
- Detailed analysis and profiling of additional market players (up to five)
Key Questions Addressed by the Report
What was the cryocooler market size in 2025, and at what CAGR will it grow during the forecast period?
The cryocooler market is estimated to be USD 3.48 billion in 2025 and is expected to register a CAGR of 7.1% during the forecast period.
What is a cryocooler?
A cryocooler is a compact mechanical device designed to generate and maintain extremely low temperatures, typically below –150°C, without using large amounts of liquid cryogens like liquid helium or nitrogen. It works on refrigeration cycles (such as Stirling, Gifford-McMahon, pulse-tube, or Joule-Thomson) to remove heat from a system and keep sensitive components at cryogenic conditions. Cryocoolers are widely used in aerospace, defense, and medical imaging for cooling infrared sensors, superconducting magnets, space telescopes, MRI machines, and emerging technologies like quantum computing, where precise, stable, and vibration-free cooling is critical.
Who are the winners in the cryocooler market?
Companies such as Sumitomo Heavy Industries, Ltd. (Japan), Thales (France), AMETEK.Inc. (US), Edwards Vacuum (UK), and Chart Industries, Inc. (US) fall under the winner's category. These companies cater to the requirements of their customers by providing cryocooler solutions.
Which strategies have been adopted by key players in the cryocooler market?
The major strategies adopted by key players in the market are collaborations and product launches.
Name the emerging players in the cryocooler market.
Creare (US), Fabrum (England), and Vacree Technologies Co., Ltd. (China) are the emerging players in the cryocooler market.
Need a Tailored Report?
Customize this report to your needs
Get 10% FREE Customization
Customize This ReportPersonalize This Research
- Triangulate with your Own Data
- Get Data as per your Format and Definition
- Gain a Deeper Dive on a Specific Application, Geography, Customer or Competitor
- Any level of Personalization
Let Us Help You
- What are the Known and Unknown Adjacencies Impacting the Cryocooler Market
- What will your New Revenue Sources be?
- Who will be your Top Customer; what will make them switch?
- Defend your Market Share or Win Competitors
- Get a Scorecard for Target Partners

Custom Market Research Services
We Will Customise The Research For You, In Case The Report Listed Above Does Not Meet With Your Requirements
Get 10% Free Customisation


Growth opportunities and latent adjacency in Cryocooler Market