Amphibious Vehicles Market by End User (Defense, Commercial), Application (Surveillance & Rescue, Water Transportation, Sports, Excavation), Propulsion (Screw Propeller, Water Jet, Track-Based), and Region - Global Forecasts to 2022


[180 Pages Report] The amphibious vehicles market is projected to grow from USD 2.39 Billion in 2017 to USD 3.70 Billion by 2022, at a CAGR of 9.13% during the forecast period. The base year considered for the study is 2016 and the forecast period is from 2017 to 2022.
Objectives of the Study:
The report analyzes the amphibious vehicles market based on end user (defense and commerical), application (surveillance & rescue, water transportation, sports/recreation, excavation, and others), and propulsion (screw propeller, water jet, track-based, and others). These segments and sub-segments have been mapped across major regions, namely, North America, Europe, Asia-Pacific, and Rest of the World (RoW).
The report provides in-depth market intelligence regarding the amphibious vehicles market and major factors, including drivers, restraints, opportunities, and challenges that may influence the growth of the market, along with an analysis of micromarkets with respect to individual growth trends, future prospects, and their contributions.
The report also covers competitive developments, such as long-term contracts, agreements, and research & development activities in the amphibious vehicles market, in addition to business and corporate strategies adopted by key market players.
The amphibious vehicles market is projected to grow from an estimated USD 2.39 Billion in 2017 to USD 3.70 Billion by 2022, at a CAGR of 9.13% during the forecast period. Amphibious vehicles are employed to provide combat support to defense forces during amphibious military operations or as excavators for dredging and reclamations of rivers, or water bodies.
The demand for amphibious vehicles is expected to be driven by the increasing demand from militaries owing to rising conflicts, increasing commercial applications, accessibility in rough terrain, and the assault amphibious vehicle upgradation program of the U.S. Army.
The amphibious vehicles market has been segmented on the basis of end user, application, propeller, and region. Based on end user, the amphibious vehicles market has been classified into defense and commercial. The commercial segment is expected to witness high growth from 2017 to 2022, owing to the rising adoption of amphibious excavators for dredging purposes.
Based on application, the amphibious vehicles market has been segmented into surveillance & rescue, water transportation, sports, and excavation. The excavation segment is expected to witness high growth during the forecast period, owing to increasing inland waterway projects and the demand for land reclamation.
Based on propulsion, the market has been segmented into screw propeller, water jet, track-based, and others segments. The track-based segment is estimated to lead the amphibious vehicles market in 2017 as it allows amphibious vehicles to move at high speeds on both, water and land surfaces. This provides military troops with efficient monitoring and inspection of land and water borders.
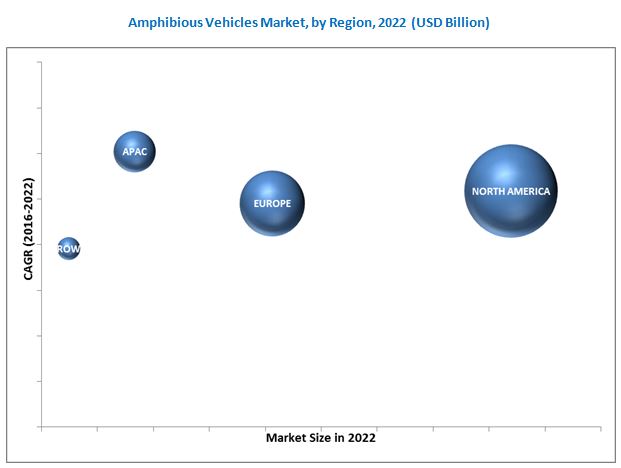
Based on region, the market has been categorized into North America, Europe, Asia-Pacific, and Rest of the World (RoW). Several countries, such as China, India, and Japan, among others are increasingly investing in the development of defense capabilities. The market in the Asia-Pacific is projected to witness high growth from 2017 to 2022, due to rise in regional conflicts.
Declining defense budgets of advanced economies can restrain the growth of the market. Due to the economic slowdown, major defense spenders such as the U.S. and European countries have reduced their defense expenditure, which is expected to affect the market of amphibious vehicles, globally.
Products offered by various companies in the amphibious vehicles market have been listed in this report. The recent developments section of the report includes recent and important developments made by various companies between 2013 and 2017. Major companies profiled in the report include BAE Systems (U.K.), General Dynamics Corporation (U.S.), Lockheed Martin Corporation (U.S.), and Rheinmetall AG (Germany). Contracts accounted for a major share of all the growth strategies adopted by leading players in the amphibious vehicles market. This strategy has enabled companies to strengthen their market shares in the amphibious vehicles market.
To speak to our analyst for a discussion on the above findings, click Speak to Analyst
 Exclusive indicates content/data unique to MarketsandMarkets and not available with any competitors.
Table of Contents
1 Introduction (Page No. - 18)
1.1 Objectives of the Study
1.2 Market Definition
1.3 Study Scope
1.3.1 Regional Scope
1.3.2 Years Considered for the Study
1.4 Currency & Pricing
1.5 Limitations
1.6 Market Stakeholders
2 Research Methodology (Page No. - 22)
2.1 Research Data
2.1.1 Secondary Data
2.1.1.1 Key Data From Secondary Sources
2.1.2 Primary Data
2.1.2.1 Key Data From Primary Sources
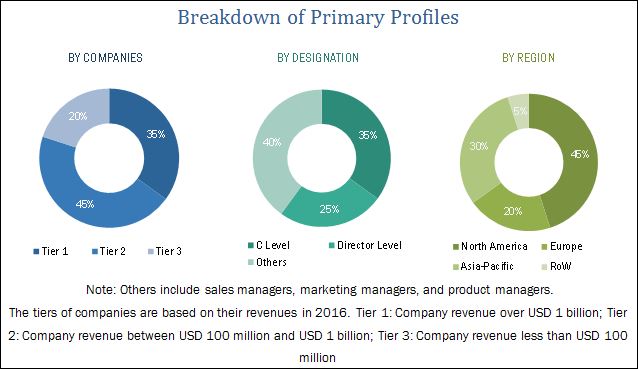
2.1.2.2 Breakdown of Primaries
2.2 Market Size Estimation
2.2.1 Bottom-Up Approach
2.2.2 Top-Down Approach
2.3 Market Breakdown & Data Triangulation
2.4 Research Assumptions
3 Executive Summary (Page No. - 30)
4 Premium Insights (Page No. - 34)
4.1 Attractive Opportunities in the Amphibious Vehicles Market
4.2 Market in Defense, By Vehicle Type
4.3 North America: Vehicles Market, By End User
4.4 Market, By Application
4.5 Market, By Region
5 Market Overview (Page No. - 37)
5.1 Introduction
5.2 Market Segmentation
5.2.1 By End User
5.2.2 By Propulsion Type
5.2.3 By Application
5.3 Market Dynamics
5.3.1 Drivers
5.3.1.1 Increasing Demand From the Military Sector Owing to Rising Conflicts
5.3.1.2 Assault Amphibious Vehicle Upgrade Program of the Marine Corps
5.3.1.3 Increasing Commercial Usage in Watersports, Transportation, and Recreational Activities
5.3.1.4 Dredging and Reclamation Applications Will Boost the Use of Amphibious Vehicles
5.3.1.5 Increasing Defense Expenditure of Developing Economies
5.3.2 Restraints
5.3.2.1 Declining Defense Budgets of Advanced Economies
5.3.2.2 High Entry Barriers for the Defense Segment
5.3.3 Opportunities
5.3.3.1 Increase in Research and Development
5.3.3.2 Increasing Use of Amphibious Landing Craft
5.3.3.3 Development of Inland Waterways
5.3.4 Challenges
5.3.4.1 Corrosion and Increase in Operational Costs
5.3.4.2 Seasonal Demand and Serviceability
6 Industry Trends (Page No. - 47)
6.1 Introduction
6.2 Technology Roadmap
6.3 Technology Trends
6.3.1 Ballistic Armor Systems
6.3.2 Remote-Controlled Amphibious Vehicles
6.3.3 High-Speed Amphibious Vehicles
6.3.4 Multi-Synchronous Direct Drive Systems for Excavators
6.3.5 Improved Manoeuvrability of the Vehicles in Water
6.4 Innovation and Patent Registrations
7 Amphibious Vehicles Market, By End-User (Page No. - 53)
7.1 Introduction
7.2 Defense
7.2.1 Defense Amphibious Vehicle Market, By Vehicle Type
7.3 Commercial
7.3.1 Commercial Amphibious Vehicle Market, By Vehicle Type
8 Amphibious Vehicles Market, By Propulsion Type (Page No. - 58)
8.1 Introduction
8.2 Screw Propellers
8.3 Water Jet
8.4 Track-Based
8.5 Others
9 Amphibious Vehicles Market, By Application (Page No. - 63)
9.1 Introduction
9.2 Surveillance & Rescue
9.3 Water Transportation
9.4 Sports/Recreation
9.5 Excavation
9.6 Others
10 Regional Analysis (Page No. - 69)
10.1 Introduction
10.2 North America
10.2.1 By End User
10.2.1.1 By Defense Vehicle Type
10.2.1.2 By Commercial Vehicle Type
10.2.2 By Propulsion Type
10.2.3 By Application
10.2.4 By Country
10.2.4.1 U.S.
10.2.4.1.1 By End User
10.2.4.2 Canada
10.2.4.2.1 By End User
10.3 Europe
10.3.1 By End User
10.3.1.1 By Defense Vehicle Type
10.3.1.2 By Commercial Vehicle Type
10.3.2 By Propulsion Type
10.3.3 By Application
10.3.4 By Country
10.3.4.1 U.K.
10.3.4.1.1 By End User
10.3.4.2 Russia
10.3.4.2.1 By End User
10.3.4.3 Germany
10.3.4.3.1 By End User
10.3.4.4 France
10.3.4.4.1 By End User
10.4 Asia-Pacific
10.4.1 By End User
10.4.1.1 By Defense Vehicle Type
10.4.1.2 By Commercial Vehicle Type
10.4.2 By Propulsion Type
10.4.3 By Application
10.4.4 By Country
10.4.4.1 Australia
10.4.4.1.1 By End User
10.4.4.2 China
10.4.4.2.1 By End User
10.4.4.3 Japan
10.4.4.3.1 By End User
10.4.4.4 India
10.4.4.4.1 By End User
10.5 Middle East
10.5.1 By End User
10.5.1.1 By Defense Vehicle Type
10.5.1.2 By Commercial Vehicle Type
10.5.2 By Propulsion Type
10.5.3 By Application
10.5.4 By Country
10.5.4.1 UAE
10.5.4.1.1 By End User
10.5.4.2 Saudi Arabia
10.5.4.2.1 By End User
10.5.4.3 Israel
10.5.4.3.1 By End User
10.6 RoW
10.6.1 By End User
10.6.1.1 By Defense Vehicle Type
10.6.1.2 By Commercial Vehicle Type
10.6.2 By Propulsion Type
10.6.3 By Application
10.6.4 By Country
10.6.4.1 Brazil
10.6.4.1.1 By End User
11 Competitive Landscape (Defense) (Page No. - 110)
11.1 Vendor Dive Overview
11.1.1 Vanguards
11.1.2 Innovators
11.1.3 Dynamic Players
11.1.4 Emerging Players
11.2 Analysis of Product Portfolio of Major Players in the Amphibious Vehicles Market (For 15 Players)
11.3 Business Strategies Adopted By Major Players in the Amphibious Vehicles Market (For 15 Players)
12 Competitive Landscape (Commercial) (Page No. - 114)
12.1 Vendor Dive Overview
12.1.1 Vanguards
12.1.2 Innovators
12.1.3 Dynamic Players
12.1.4 Emerging Players
12.2 Product Portfolio Analysis of Amphibious Vehicles Market (For 13 Players)
12.3 Business Strategy Adopted By Major Players in Amphibious Vehicles Market (For 13 Players)
13 Company Profiles (Defense) (Page No. - 118)
13.1 Bae Systems PLC
13.2 General Dynamics Corporation
13.3 Lockheed Martin Corporation
13.4 Rheinmetall AG
13.5 Science Applications International Corporation (SAIC)
13.6 Griffon Hoverwork Ltd. (GHL)
13.7 Norinco International Cooperation Ltd.
13.8 Textron Systems
13.9 Renault Trucks Defense
13.10 Kurganmashzavod JSC
13.11 KBTM JSC (OMSK)
13.12 Hanjin Heavy Industries & Construction Co., Ltd.
14 Company Profiles (Commercial) (Page No. - 150)
14.1 Hitachi Construction Machinery (Europe) NV
14.2 Eik Engineering SDN. BHD.
14.3 Wetland Equipment Company, Inc.
14.4 Wilco Manufacturing LLC
14.5 Marsh Buggies, Inc.
14.6 TSBC Engineering SDN. BHD.
14.7 Ultratrex Machinery SDN. BHD.
14.8 Lemac Corporation
14.9 REMU
14.10 Hefei Sunton Machinery Manufacturing Co., Ltd.
14.11 Aquamec OY
14.12 Wilson Marsh Equipment Company
15 Appendix (Page No. - 174)
15.1 Discussion Guide
15.2 Knowledge Store: Marketsandmarkets’ Subscription Portal
15.3 Introducing RT: Real Time Market Intelligence
15.4 Available Customizations
15.5 Related Reports
15.6 Author Details
List of Tables (106 Tables)
Table 1 Mapping Military Expenditure of Emerging Economies, 2011-2015 (USD Million)
Table 2 Factors Affecting the Declining Defense Expenditure of Advanced Economies
Table 3 Budget Allocated for R&D Activities in the Defense Sector By the U.S. Government (USD Million)
Table 4 Top Ten Countries in Inland Waterways Around the World, 2010-2012
Table 5 Innovation & Patent Registration (2016- 2017)
Table 6 Size, By End-User, 2015-2022 (USD Million)
Table 7 Defense Segment, By Region, 2015-2022 (USD Million)
Table 8 Defense Amphibious Vehicle Market, By Vehicle Type, 2015-2022 (USD Million)
Table 9 Commercial Segment, By Region, 2015-2022 (USD Million)
Table 10 Commercial Amphibious Vehicle Market, By Vehicle Type, 2015-2022 (USD Million)
Table 11 Excavators Subsegment, By Type, 2015-2022 (USD Million)
Table 12 Excavator Subsegment, By Industry, 2015-2022 (USD Million)
Table 13 Size, By Propulsion Type, 2015–2022 (USD Million)
Table 14 Screw Propellers Segment, By Region, 2015-2022 (USD Million)
Table 15 Water Jet Segment, By Region, 2015-2022 (USD Million)
Table 16 Track-Based Segment, By Region, 2015-2022 (USD Million)
Table 17 Others Segment, By Region, 2015-2022 (USD Million)
Table 18 Amphibious Vehicles Market Size, By Application, 2015-2022 (USD Million)
Table 19 Surveillance & Rescue Segment, By Region, 2015-2022 (USD Million)
Table 20 Water Transportation Segment, By Region, 2015-2022 (USD Million)
Table 21 Sports/Recreation Segment, By Region, 2015-2022 (USD Million)
Table 22 Excavation Segment, By Region, 2015-2022 (USD Million)
Table 23 Others Segment, By Region, 2014-2022 (USD Million)
Table 24 Market Size, By Region, 2015–2022 (USD Million)
Table 25 North America: Market Size, By End User, 2015-2022 (USD Million)
Table 26 North America: Size, By Defense Vehicle Type, 2015-2022 (USD Million)
Table 27 North America: Market Size, By Commercial Vehicle Type, 2015-2022 (USD Million)
Table 28 North America: Size, By Excavators Type, 2015-2022 (USD Million)
Table 29 North America: Market Size, By Excavators Industry, 2015-2022 (USD Million)
Table 30 North America: Size, By Propulsion Type, 2015-2022 (USD Million)
Table 31 North America: Market Size, By Application, 2015-2022 (USD Million)
Table 32 North America: Market, By Country, 2015-2022 (USD Million)
Table 33 U.S.: Amphibious Vehicles Market Size, By End User, 2015-2022 (USD Million)
Table 34 U.S.: Market Size, By Defense Vehicle Type, 2015-2022 (USD Million)
Table 35 U.S.: Market Size, By Commercial Vehicle Type, 2015-2022 (USD Million)
Table 36 Canada: Size, By End User, 2015-2022 (USD Million)
Table 37 Canada: Market Size, By Defense Vehicle Type, 2015-2022 (USD Million)
Table 38 Canada: Market Size, By Commercial Vehicle Type, 2015-2022 (USD Million)
Table 39 Europe: Size, By End User, 2015-2022 (USD Million)
Table 40 Europe: Market Size, By Defense Vehicle Type, 2015-2022 (USD Million)
Table 41 Europe: Amphibious Vehicles Market Size, By Commercial Vehicle Type, 2015-2022 (USD Million)
Table 42 Europe: Market Size, By Excavators Type, 2015-2022 (USD Million)
Table 43 Europe: Market Size, By Excavators Industry, 2015-2022 (USD Million)
Table 44 Europe: Market Size, By Propulsion Type, 2015-2022 (USD Million)
Table 45 Europe: Size, By Application, 2015-2022 (USD Million)
Table 46 Europe: Market, By Country, 2015-2022 (USD Million)
Table 47 U.K.: Amphibious Vehicles Market Size, By End User, 2015-2022 (USD Million)
Table 48 U.K.: Market Size, By Defense Vehicle Type, 2015-2022 (USD Million)
Table 49 U.K.: Market Size, By Commercial Vehicle Type, 2015-2022 (USD Million)
Table 50 Russia: Market Size, By End User, 2015-2022 (USD Million)
Table 51 Russia: Market Size, By Defense Vehicle Type, 2015-2022 (USD Million)
Table 52 Russia: Market Size, By Commercial Vehicle Type, 2015-2022 (USD Million)
Table 53 Germany: Size, By End User, 2015-2022 (USD Million)
Table 54 Germany: Market Size, By Defense Vehicle Type, 2015-2022 (USD Million)
Table 55 Germany: Market Size, By Commercial Vehicle Type, 2015-2022 (USD Million)
Table 56 France: Amphibious Vehicles Market Size, By End User, 2015-2022 (USD Million)
Table 57 France: Market Size, By Defense Vehicle Type, 2015-2022 (USD Million)
Table 58 France: Size, By Commercial Vehicle Type, 2015-2022 (USD Million)
Table 59 Asia-Pacific: Size, By End User, 2015-2022 (USD Million)
Table 60 Asia-Pacific: Market Size, By Defense Vehicle Type, 2015-2022 (USD Million)
Table 61 Asia-Pacific: Market Size, By Commercial Vehicle Type, 2015-2022 (USD Million)
Table 62 Asia-Pacific: Size, By Excavators Type, 2015-2022 (USD Million)
Table 63 Asia-Pacific: Amphibious Vehicles Market Size, By Excavators Industry, 2015-2022 (USD Million)
Table 64 Asia-Pacific: Size, By Propulsion Type, 2015-2022 (USD Million)
Table 65 Asia-Pacific: Size, By Application, 2015-2022 (USD Million)
Table 66 Asia-Pacific: By Country, 2015-2022 (USD Million)
Table 67 Australia: Size, By End User, 2015-2022 (USD Million)
Table 68 Australia: Size, By Defense Vehicle Type, 2015-2022 (USD Million)
Table 69 Australia: Size, By Commercial Vehicle Type, 2015-2022 (USD Million)
Table 70 China: Size, By End User, 2015-2022 (USD Million)
Table 71 China: Size, By Defense Vehicle Type, 2015-2022 (USD Million)
Table 72 China: Amphibious Vehicles Market Size, By Commercial Vehicle Type, 2015-2022 (USD Million)
Table 73 Japan: Size, By End User, 2015-2022 (USD Million)
Table 74 Japan: Size, By Defense Vehicle Type, 2015-2022 (USD Million)
Table 75 Japan: Size, By Commercial Vehicle Type, 2015-2022 (USD Million)
Table 76 India: Size, By End User, 2015-2022 (USD Million)
Table 77 India: Size, By Defense Vehicle Type, 2015-2022 (USD Million)
Table 78 India: Size, By Commercial Vehicle Type, 2015-2022 (USD Million)
Table 79 Middle East: Size, By End User, 2015-2022 (USD Million)
Table 80 Middle East: Market Size, By Defense Vehicle Type, 2015-2022 (USD Million)
Table 81 Middle East: Size, By Commercial Vehicle Type, 2015-2022 (USD Million)
Table 82 Middle East: Size, By Excavators Type, 2015-2022 (USD Million)
Table 83 Middle East: Size, By Excavators Industry, 2015-2022 (USD Million)
Table 84 Middle East: Size, By Propulsion Type, 2015-2022 (USD Million)
Table 85 Middle East: Amphibious Vehicles Market Size, By Application, 2015-2022 (USD Million)
Table 86 Middle East: By Country, 2015-2022 (USD Million)
Table 87 UAE: Size, By End User, 2015-2022 (USD Million)
Table 88 UAE: Size, By Defense Vehicle Type, 2015-2022 (USD Million)
Table 89 UAE: Size, By Commercial Vehicle Type, 2015-2022 (USD Million)
Table 90 Saudi Arabia: Size, By End User, 2015-2022 (USD Million)
Table 91 Saudi Arabia: Size, By Defense Vehicle Type, 2015-2022 (USD Million)
Table 92 Saudi Arabia: Size, By Commercial Vehicle Type, 2015-2022 (USD Million)
Table 93 Israel: Size, By End User, 2015-2022 (USD Million)
Table 94 Israel: Size, By Defense Vehicle Type, 2015-2022 (USD Million)
Table 95 Israel: Size, By Commercial Vehicle Type, 2015-2022 (USD Million)
Table 96 RoW: Size, By End User, 2015-2022 (USD Million)
Table 97 RoW: Size, By Defense Vehicle Type, 2015-2022 (USD Million)
Table 98 RoW: Size, By Commercial Vehicle Type, 2015-2022 (USD Million)
Table 99 RoW: Size, By Excavators Type, 2015-2022 (USD Million)
Table 100 RoW: Size, By Excavators Industry, 2015-2022 (USD Million)
Table 101 RoW: Amphibious Vehicles Market Size, By Propulsion, 2015-2022 (USD Million)
Table 102 RoW: Size, By Application, 2015-2022 (USD Million)
Table 103 RoW: By Country, 2015-2022 (USD Million)
Table 104 Brazil: Size, By End User, 2015-2022 (USD Million)
Table 105 Brazil: Amphibious Vehicles Market Size, By Defense Vehicle Type, 2015-2022 (USD Million)
Table 106 Brazil: Size, By Commercial Vehicle Type, 2015-2022 (USD Million)
List of Figures (41 Figures)
Figure 1 Amphibious Vehicles Market: Markets Covered
Figure 2 Research Process Flow
Figure 3 Amphibious Vehicles Market: Research Design
Figure 4 Market Size Estimation Methodology: Bottom-Up Approach
Figure 5 Market Size Estimation Methodology: Top-Down Approach
Figure 6 Data Triangulation
Figure 7 By End User, 2017 & 2022 (USD Million)
Figure 8 Track-Based Segment Estimated to Lead the Amphibious Vehicles Market in 2017
Figure 9 North America Estimated to Be Largest Market for Amphibious Vehicles in 2017
Figure 10 Increasing Commercial Applications of Amphibious Vehicles are Expected to Drive the Growth of the Market From 2017 to 2022
Figure 11 The Amphibious Combat Vehicles Subsegment of the Defense End User Segment is Projected to Lead the Market From 2017 to 2022
Figure 12 Defense Segment is Estimated to Capture the Major Share in North America in 2017
Figure 13 The Excavation Application Segment of the Amphibious Vehicles Market is Projected to Grow at the Highest CAGR From 2017 to 2022
Figure 14 The Asia-Pacific Amphibious Vehicles Market is Projected to Grow at the Highest CAGR From 2017 to 2022
Figure 15 Amphibious Vehicles Market, By End User
Figure 16 By Propulsion Type
Figure 17 Amphibious Vehicles Market, By Application
Figure 18 Increasing Demand From the Military Sector is Driving the Amphibious Vehicles Market
Figure 19 Defense Spending of Advanced Economies, 2011-2015 (USD Million)
Figure 20 Evolution of Technology in the Amphibious Vehicles Market From 1770 to 2010
Figure 21 Advanced Technologies Used in Amphibious Vehicles
Figure 22 Size, By End-User, 2017 & 2022 (USD Million)
Figure 23 The Track-Based Segment of the Amphibious Vehicles Market is Projected to Grow at the Highest CAGR From 2017 to 2022
Figure 24 Size, By Application, 2017 & 2022 (USD Million)
Figure 25 The Amphibious Vehicles Market in Asia-Pacific is Projected to Grow at the Highest CAGR During the Forecast Period
Figure 26 North America Snapshot
Figure 27 Europe Snapshot
Figure 28 Asia-Pacific Snapshot
Figure 29 Middle East Snapshot
Figure 30 MnM Dive- Vendor Comparison Matrix
Figure 31 MnM Dive- Vendor Comparison Matrix
Figure 32 Bae Systems PLC: Company Snapshot
Figure 33 General Dynamics Corporation: Company Snapshot
Figure 34 Lockheed Martin Corporation: Company Snapshot
Figure 35 Rheinmetall AG: Company Snapshot
Figure 36 Science Applications International Corporation (SAIC): Company Snapshot
Figure 37 Griffon Hoverwork Ltd. (GHL): Company Snapshot
Figure 38 Norinco International Cooperation Ltd.: Company Snapshot
Figure 39 Textron Systems: Company Snapshot
Figure 40 Renault Trucks Defense: Company Snapshot
Figure 41 Hanjin Heavy Industries & Construction Co., Ltd.: Company Snapshot
Research Methodology:
Market size estimation for various segments and sub-segments of the amphibious vehicles market has been arrived at referring to varied secondary sources such as Naval Technology Journals, United Nations Conference on Trade and Development (UNCTAD), annual reports and publications, among others. Further market triangulation has been performed with the help of statistical techniques using econometric tools. All percentage shares, splits, and breakdowns were determined using secondary sources and verified through primary sources. All possible parameters that affect the market have been accounted for, viewed in extensive detail, verified through primary research, and analyzed to acquire the final quantitative and qualitative data. This data is consolidated with detailed inputs and analysis from MarketsandMarkets, and presented in this report.
To know about the assumptions considered for the study, download the pdf brochure
The amphibious excavator market ecosystem comprises manufacturers, such as Hitachi Construction Machinery (Europe) N.V. (Netherlands), EIK Engineering Sdn. Bhd. (Malaysia), Wetland Equipment Company, Inc. (U.S.), Wilco Manufacturing LLC (U.S.), and Marsh Buggies Incorporated (U.S.).
Major manufacturers in the amphibious assault vehicles market include BAE Systems (U.K.), General Dynamics Corporation (U.S.), Lockheed Martin Corporation (U.S.), and Rheinmetall AG (Germany).
Key Target Audience:
- Amphibious Vehicle Developers
- Defense Companies
- Excavator & Undercarriage Manufacturers
- Component Manufacturers
Scope of the Report:
This research report categorizes the amphibious vehicles market into the following segments and sub-segments:
-
Amphibious Vehicles Market, by end user
- Defense
- Commercial
-
Amphibious Vehicles Market, by application
- Surveillance & resuce
- Water transportation
- Sports/Recreation
- Excavation
- Others
-
Amphibious Vehicles Market, by propulsion
- Screw propeller
- Water jet
- Track-based
- Others
-
Amphibious Vehicles Market, by region
- North America
- Europe
- Asia-Pacific
- Rest of the World
Customizations available for the report:
Along with the given market data, MarketsandMarkets offers customizations as per the specific needs of the company. The following customization options are available for the report:
-
Company Information
- Detailed analysis and profiles of additional market players (up to five)


Growth opportunities and latent adjacency in Amphibious Vehicles Market
I am interested in importing these vessels to South Africa for recreational purpose. Can you send brochures for recreational vessels? I believe for correct prize, there will be big demand.