
Armored Vehicles Market Size, Share & Trends, 2025 To 2030

Armored Vehicles Market by Platform (Combat Vehicles, Combat Support Vehicles, Unmanned Ground Vehicles), Mobility (Wheeled, Tracked), Propulsion (Conventional, Electric), System, Operation Mode, Point of Sale and Region - Global Forecast to 2030


OVERVIEW

Source: Secondary Research, Interviews with Experts, MarketsandMarkets Analysis
The armored vehicles market is projected to grow from USD 42.0 billion in 2025 to USD 49.9 billion by 2030, at a CAGR of 3.5%. The volume of armored vehicles is projected to grow from 14,393 (units) in 2025 to 16,536 (units) by 2030. Growth is driven by rising defense spending, geopolitical tensions, and the need for enhanced border security. Continuous technological advancements in protection and mobility are enhancing vehicle capabilities. These improvements are also attracting investments and supporting sustained long-term growth in the market.
KEY TAKEAWAYS
-
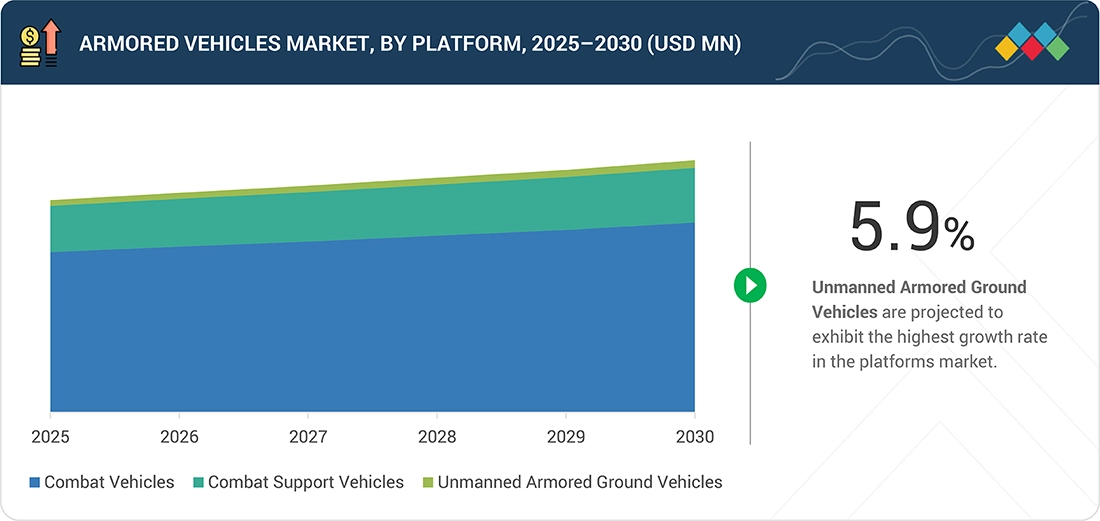
BY PLATFORMArmored vehicle demand is shaped by the balance between combat, support, and unmanned systems, with modernization programs and evolving mission profiles such as urban warfare and counter-insurgency driving diversification.
-
BY SYSTEMAdvancements in subsystems, including C4ISR, armaments, and countermeasure technologies, are enhancing lethality, survivability, and interoperability, positioning integrated systems as key value creators.
-
BY MODE OF OPERATIONManned platforms continue to provide assured control in complex combat environments, while unmanned solutions are increasingly deployed for reconnaissance, surveillance, and autonomous missions as force multipliers.
-
BY MOBILITYWheeled vehicles offer strategic speed and cost advantages for rapid deployments, while tracked platforms deliver superior performance in high-intensity and off-road operations, making both essential for mission flexibility.
-
BY POINT OF SALEOEM procurement supports new platform acquisition and fleet modernization, while the aftermarket ensures lifecycle support, upgrades, and sustainment, creating dual revenue streams for industry stakeholders.
-
BY TYPEConventional vehicles dominate current fleets due to their established infrastructure, while electric and hybrid platforms are emerging as future-ready alternatives that align with efficiency and sustainability goals.
-
BY REGIONRegional growth drivers differ across markets. North America focuses on advanced R&D, Europe on joint defense programs, and Asia-Pacific on accelerating indigenous production. The Middle East is boosting procurement due to security threats, while other regions prioritize cost-efficient modernization of existing fleets.
-
COMPETITIVE LANDSCAPEMajor players are pursuing organic and inorganic strategies, including partnerships and investments. For instance, Rheinmetall received a multimillion-dollar contract from the Japanese Ministry of Defence to supply Mission Master SP unmanned ground vehicles (UGVs) for surveillance, logistics, and autonomous support operations.
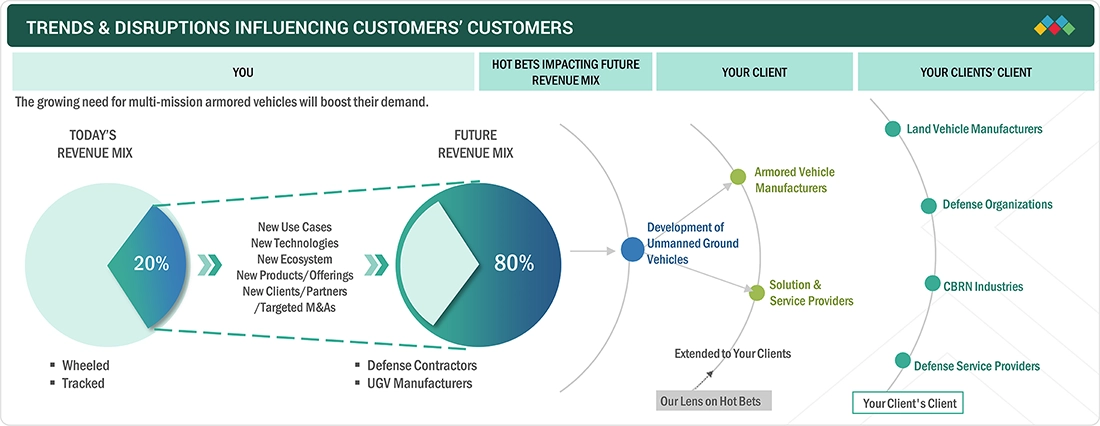
TRENDS & DISRUPTIONS IMPACTING CUSTOMERS' CUSTOMERS
The future outlook for the armored vehicles industry indicates strong growth, supported by sustained expansion as governments focus on fleet modernization to address evolving security challenges. The integration of advanced technologies, including AI, unmanned systems, and next-generation armor, will enhance operational effectiveness and survivability. Ongoing defense investments and replacement cycles are expected to generate long-term growth opportunities for industry stakeholders.
Source: Secondary Research, Interviews with Experts, MarketsandMarkets Analysis
MARKET DYNAMICS
![]()
Level
-
Rising military modernization programs

-
Growing demand for armored vehicles to tackle cross-border conflicts

![]()
Level
-
Susceptibility to mechanical and electrical failures

-
Survivability risks for personnel onboard armored vehicles

![]()
Level
-
Rising technology integration and upgrades in military vehicles

-
Adoption of lifecycle optimization strategies for sustainment

![]()
Level
-
High costs of main battle tanks

-
Hardware and software malfunction

Source: Secondary Research, Interviews with Experts, MarketsandMarkets Analysis
Driver: Rising military modernization programs
Military modernization is a key growth driver, with over USD 50 billion allocated globally to replace aging fleets and adopt next-generation platforms. Major programs in the US, Europe, India, and Asia focus on AI-enabled systems, digital integration, and survivability, while countries such as the UK, Australia, and Saudi Arabia link modernization to industrial capability development. These initiatives ensure sustained demand and long-term investment opportunities worldwide.
Restraint:Survivability risks for personnel onboard armored vehicles
Despite significant advancements in armor systems, countermeasures, and protection technologies, armored vehicles remain vulnerable to evolving threats, including improvised explosive devices, mines, and advanced enemy weaponry. Enhancing crew protection often adds weight, which drives up operational costs and reduces mobility and efficiency. These ongoing vulnerabilities directly affect procurement priorities and continue to constrain the overall effectiveness of armored platforms.
Opportunity: Rising technology integration and upgrades in military vehicles
Technology integration presents a significant opportunity as armored vehicles adopt C4ISR suites, AI-enabled navigation, precision-guided munitions, and automated loading systems. These upgrades enhance situational awareness, accuracy, and survivability, driving demand for compatible solutions and reshaping procurement priorities.
Challenge: High costs of main battle tanks
The development and acquisition of main battle tanks demand substantial investment, with advanced configurations further driving costs. This financial burden limits large-scale procurement, especially in emerging economies, and pushes manufacturers and governments to prioritize prototyping, lighter vehicles, or fleet modernization over new MBT acquisitions.
Armored Vehicles Market: COMMERCIAL USE CASES ACROSS INDUSTRIES
| COMPANY | USE CASE DESCRIPTION | BENEFITS |
|---|---|---|
 |
Open-architecture integration of C4ISR and electronic warfare systems into tactical wheeled and ground combat vehicles | Enhances interoperability, optimizes space and power use, improves situational awareness, and supports future upgrades without major redesign |
 |
Electric armor system that neutralizes anti-tank grenades and shells on impact | Strengthens crew protection, reduces vehicle vulnerability to shaped charges, lowers weight compared to conventional armor, and improves battlefield resilience |
 |
See-through Armor (STA) using high-resolution imaging and integration with vehicle systems | Delivers 360° situational awareness, improves threat detection in low-visibility conditions, and enhances crew safety through real-time transparent vision capability |
 |
ProPulse hybrid diesel-electric propulsion for heavy-duty armored vehicles | Improves fuel efficiency, reduces lifecycle costs, provides onboard power generation, and increases operational flexibility through modular hybrid design |
 |
ADAPTIV adaptive camouflage using thermal pixel technology | Enhances stealth by making vehicles less visible to infrared and surveillance systems, improves survivability, and allows rapid replacement of damaged modules |
 |
Advanced SATCOM and VSAT solutions for defense and mobility | Provides secure, resilient, and low-latency communications, ensuring operational connectivity for defense, mobility, and government missions |
Logos and trademarks shown above are the property of their respective owners. Their use here is for informational and illustrative purposes only.
MARKET ECOSYSTEM
The armored vehicles market ecosystem is shaped by major defense firms, specialized SMEs, and end users. Large companies drive technological innovation through R&D, while SMEs provide niche capabilities and tailored solutions. End users, including military forces, governments, and law enforcement agencies, are the primary demand drivers influencing procurement priorities and market growth.
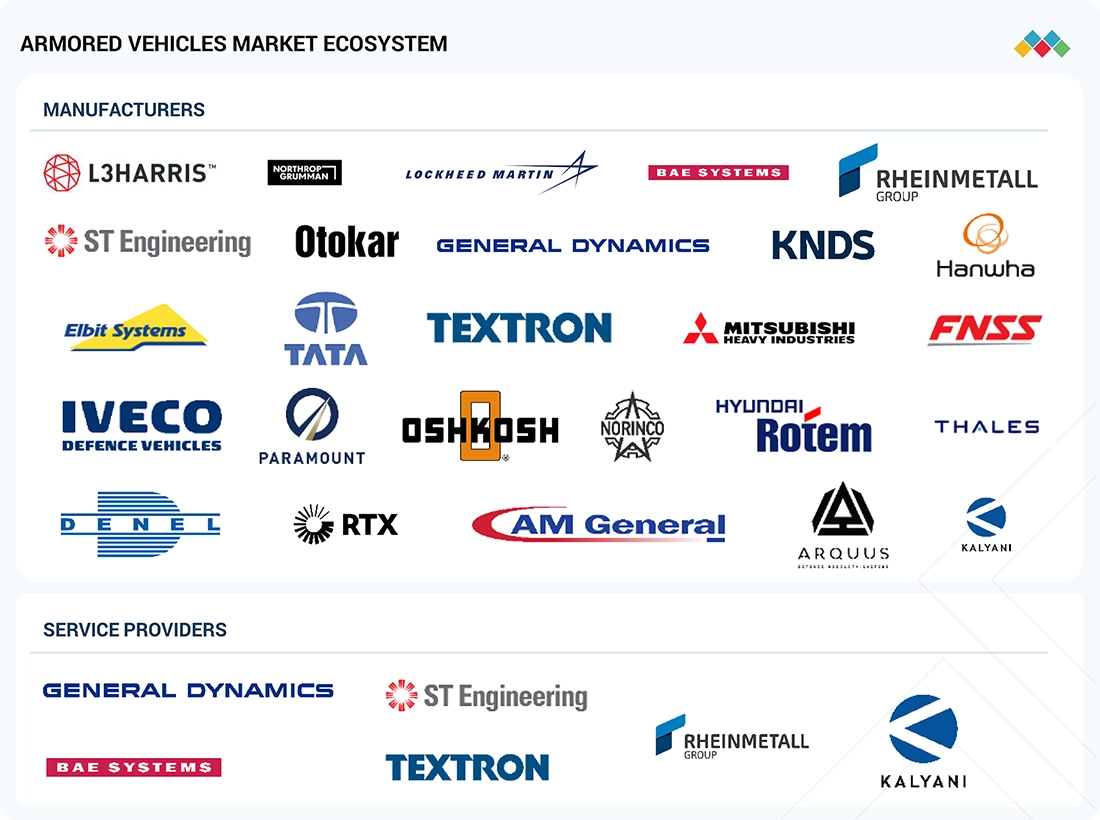
Logos and trademarks shown above are the property of their respective owners. Their use here is for informational and illustrative purposes only.
MARKET SEGMENTS
Source: Secondary Research, Interviews with Experts, MarketsandMarkets Analysis
Armored Vehicles Market, By Platform
Combat vehicles command the largest share, driven by their critical role in modern warfare, which involves delivering mobility, protection, and firepower. Ongoing fleet modernization and procurement of main battle tanks and infantry fighting vehicles continue to sustain demand in this segment.
Armored Vehicles Market, By Mobility
Wheeled armored vehicles lead the market due to their operational flexibility, cost efficiency, and suitability for urban and cross-border missions. Their growing use in peacekeeping and rapid-deployment operations reinforces their dominance.
Armored Vehicles Market, By System
Armaments represent the most significant system segment as defense forces prioritize upgrading offensive and defensive capabilities. Investments in precision-guided munitions, remote weapon stations, and fire-control technologies are key drivers of growth.
Armored Vehicles Market, By Mode of Operation
Manned armored vehicles hold the largest share, supported by their proven battlefield reliability and direct operator control. Their established role in complex combat environments ensures continued preference over unmanned alternatives.
Armored Vehicles Market, By Type
Conventional vehicles dominate the market, backed by mature production infrastructure and widespread deployment. Their cost-effectiveness and alignment with large-scale modernization programs strengthen their position.
Armored Vehicles Market, By Point of Sale
OEM sales account for the largest share as defense agencies procure directly from manufacturers under long-term modernization initiatives. Demand for next-generation platforms continues to drive OEM-led growth.
REGION
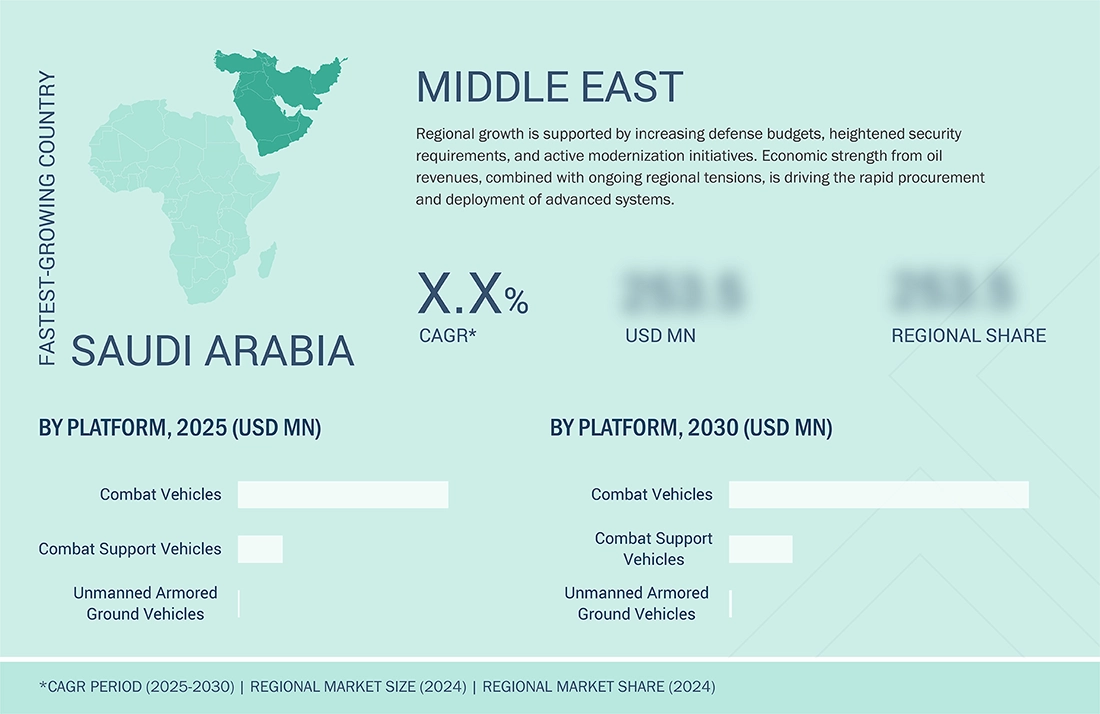
Middle East to be fastest-growing region in global armored vehicles market during forecast period
The Middle East is the fastest-growing region in the armored vehicles market, driven by rising defense spending, border security needs, and ongoing modernization programs. Strong economic capacity from oil revenues and persistent regional tensions are accelerating procurement and development of advanced platforms.
Armored Vehicles Market: COMPANY EVALUATION MATRIX
The company evaluation matrix for the armored vehicles market evaluates players based on product footprint and market share. It highlights their competitive positioning and ranks them according to market strength and growth strategies. Rheinmetall AG (Star) is positioned as a leading defense player, with a strong focus on advanced combat vehicles, protection systems, and integrated weapon solutions. Hyundai Rotem (Emerging Leader) is recognized as a leading innovator in this market.
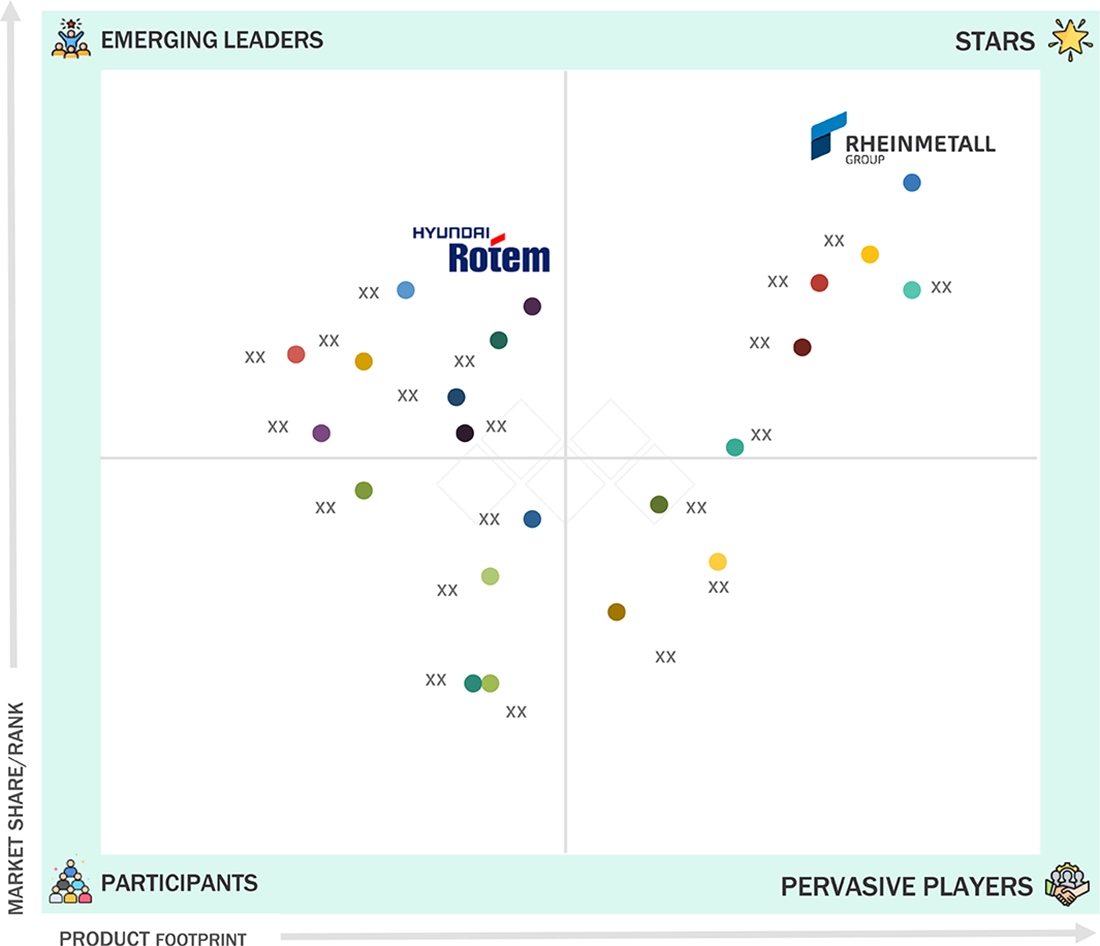
Source: Secondary Research, Interviews with Experts, MarketsandMarkets Analysis
KEY MARKET PLAYERS
MARKET SCOPE
| REPORT METRIC | DETAILS |
|---|---|
| Market Size in 2024 (Value) | USD 40.58 Billion |
| Market Forecast in 2030 (Value) | USD 49.90 Billion |
| Growth Rate | CAGR of 3.5% from 2025–2030 |
| Years Considered | 2021–2030 |
| Base Year | 2024 |
| Forecast Period | 2025–2030 |
| Units Considered | Value (USD Million/Billion), Volume (Units) |
| Report Coverage | Revenue forecast, company ranking, competitive landscape, growth factors, and trends |
| Segments Covered |
|
| Regions Covered | North America, Europe, Asia Pacific, Middle East, and Rest of the World |
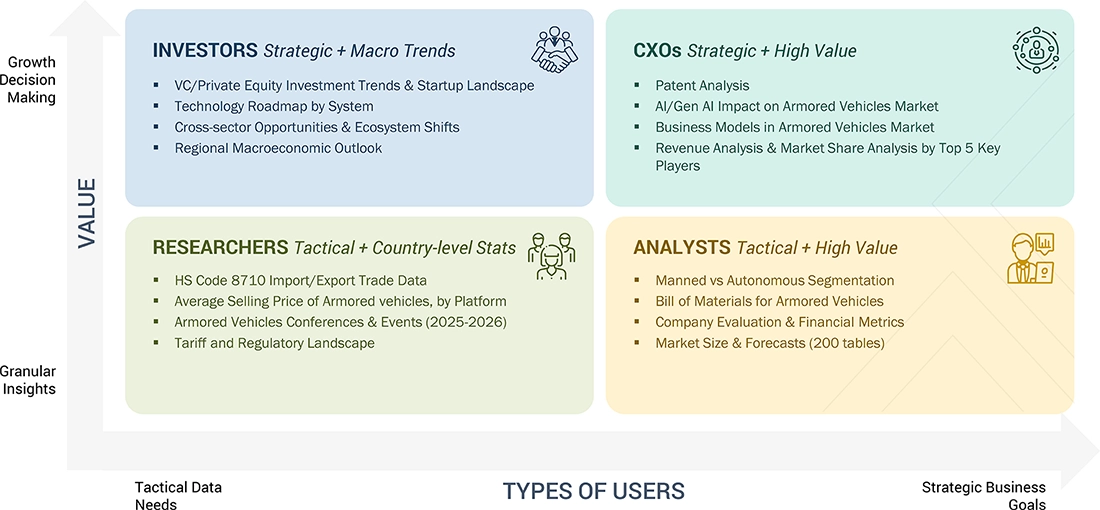
WHAT IS IN IT FOR YOU: Armored Vehicles Market REPORT CONTENT GUIDE
DELIVERED CUSTOMIZATIONS
We have successfully delivered the following deep-dive customizations:
| CLIENT REQUEST | CUSTOMIZATION DELIVERED | VALUE ADDS |
|---|---|---|
| Civil Armored Vehicles Market Customization (Global – Historic & Forecast Market Numbers) | A dedicated civil armored vehicles (non-military) market study providing an in-depth assessment of the market in terms of value and volume. The analysis covers vehicle categories and regional distribution, highlighting comparative benchmarks across different types of civil armored platforms. It delivers quantitative insights into the number of units deployed and the corresponding market valuation, offering a clear view of demand dynamics. |
|
| Geopolitical Situation & Impact on Armored Vehicles Market |
|
|
| Detailed segmentation of the armored vehicles market by platform and sub-categories with regional and country-level breakdown (Value and Volume) |
|
|
RECENT DEVELOPMENTS
- May 2025 : Oshkosh Defense secured a contract for USD 34 million to manufacture wheel and tire assemblies for the US Army. This four-year contract ensures the timely availability of essential components that support routine maintenance and sustainment of the Army’s tactical vehicle fleet
- May 2025 : IDV was awarded a contract to supply 785 military logistic vehicles to the Dutch Armed Forces. The contract includes 8×8 and 4×4 military trucks in three versions: semitrailer tractor, recovery, and hook-lift. Deliveries are scheduled between 2027 and 2029, with an option for an additional 785 vehicles.
- April 2025 : The Netherlands Marine Corps awarded Oshkosh Defense a contract to deliver 150 JLTV-based Dutch Expeditionary Patrol Vehicles (DXPV).
- April 2025 : The US Army placed a USD 95 million order under the Family of Heavy Tactical Vehicles (FHTV) V contract. The order includes autonomy-ready PLS A2 vehicles, supporting logistics modernization efforts with enhanced powertrains, armor, and digital readiness for future autonomy integration.
- April 2025 : Hanwha Aerospace signed a contract with Poland's Huta Stalowa Wola (HSW) to supply chassis and power packs for 87 Krab self-propelled howitzers (SPHs). The contract, valued at approximately USD 280 million, includes deliveries between 2026 and 2028, enhancing Poland's artillery capabilities.
Table of Contents
 Exclusive indicates content/data unique to MarketsandMarkets and not available with any competitors.
Methodology
The study involved four major activities in estimating the current size of the armored vehicles market. Exhaustive secondary research was done to collect information on the armored vehicles market, its adjacent markets, and its parent market. The next step was to validate these findings, assumptions, and sizing with industry experts across the value chain through primary research. Demand-side analyses were carried out to estimate the overall size of the market. After that, market breakdown and data triangulation procedures were used to estimate the sizes of different segments and subsegments of the armored vehicles market.
Secondary Research
In the secondary research process, various sources were referred to for identifying and collecting information for this study. The secondary sources included government sources, such as SIPRI; corporate filings, such as annual reports, press releases, and investor presentations of companies; white papers, journals, and certified publications; and articles from recognized authors, directories, and databases.
Primary Research
Extensive primary research was conducted after acquiring information regarding the armored vehicles market scenario through secondary research. Several primary interviews were conducted with market experts from both the demand and supply sides across major countries of North America, Europe, Asia Pacific, the Middle East, and the Rest of the World, which includes Africa and Latin America. Primary data was collected through questionnaires, emails, and telephonic interviews.

To know about the assumptions considered for the study, download the pdf brochure
Market Size Estimation
The top-down and bottom-up approaches were used to estimate and validate the size of the armored vehicles market. The research methodology used to estimate the size of the market includes the following details.
Key players in the Armored vehicles market were identified through secondary research, and their market share was determined through primary and secondary research. This included a study of the annual and financial reports of the top market players and extensive interviews with leaders such as directors, engineers, marketing executives, and other stakeholders of leading companies operating in the armored vehicles market.
All percentage shares, splits, and breakdowns were determined using secondary sources and verified through primary sources. All possible parameters that affect the markets covered in this research study were accounted for, viewed in extensive detail, verified through primary research, and analyzed to obtain the final quantitative and qualitative data on the armored vehicles market. This data was consolidated, enhanced with detailed input, analyzed by MarketsandMarkets, and presented in this report.
Armored Vehicles Market : Top-Down and Bottom-Up Approach

Data Triangulation
After arriving at the overall market size, the total market was split into several segments and subsegments. The data triangulation and market breakdown procedures explained below were implemented, wherever applicable, to complete the overall market engineering process and arrive at the estimated market numbers for the market segments and subsegments. The data was triangulated by studying various factors and trends from the demand and supply sides. Along with this, the market size was validated using the top-down and bottom-up approaches.
Market Definition
Armored vehicles are designed to carry combat infantry squads to battlefields and provide them with direct fire support. They offer a high level of protection to defense personnel against Improvised Explosive Devices (IEDs), land mines, and indirect enemy fire. These vehicles may be equipped with weapons of different types, calibers, and ranges.
Key Stakeholders
- Armored Vehicle Manufacturers
- Ministries of Defense
- Regulatory Bodies
- R&D Companies
- Manufacturers of Ballistic Armor
- Providers of Weapons and Remote Weapon Stations
- Providers of Active Protection Systems
- Manufacturers of Armored Vehicles
- Providers of Armored Vehicle Components and Sub-components
- Armed Forces
Report Objectives
- To define, describe, and forecast the armored vehicles market size based on platform, type, mobility, mode of operation, and point of sale
- To forecast the size of different segments of the market with respect to five major regions: North America, Europe, Asia Pacific, the Middle East, and the Rest of the World, along with their respective key countries
- To identify and analyze key drivers, restraints, opportunities, and challenges influencing market growth
- To identify industry trends and technology trends currently prevailing in the market
- To analyze micromarkets1 with respect to their individual growth trends, prospects, and contribution to the overall market
- To profile companies operating in the market based on their product portfolios, market shares, and key growth strategies
- To analyze the degree of competition among players in the market by identifying and analyzing their business revenues, products offered, and recent developments and ranking them based on these parameters
- To analyze competitive developments such as deals, product launches/developments, and partnerships/acquisitions undertaken by key market players
- To strategically profile key players and comprehensively analyze their share and core competencies in the market
Available Customizations
MarketsandMarkets offers the following customizations for this market report:
- Additional country-level analysis of the armored vehicles market
- Profiling of other market players (up to 5)
Product Analysis
- Product matrix, which provides a detailed comparison of the product portfolio of each company in the armored vehicles market
Need a Tailored Report?
Customize this report to your needs
Get 10% FREE Customization
Customize This ReportPersonalize This Research
- Triangulate with your Own Data
- Get Data as per your Format and Definition
- Gain a Deeper Dive on a Specific Application, Geography, Customer or Competitor
- Any level of Personalization
Let Us Help You
- What are the Known and Unknown Adjacencies Impacting the Armored Vehicles Market
- What will your New Revenue Sources be?
- Who will be your Top Customer; what will make them switch?
- Defend your Market Share or Win Competitors
- Get a Scorecard for Target Partners

Custom Market Research Services
We Will Customise The Research For You, In Case The Report Listed Above Does Not Meet With Your Requirements
Get 10% Free CustomisationGrowth opportunities and latent adjacency in Armored Vehicles Market


Chayan
Jun, 2019
We are trying to understand the armored vehicles requirement, subsegment categorization, and the Indian customers for such products..
Adam
May, 2019
Hi. I'm particularity interested in the sections of the market report which covers advancements and new innovations in ballistic armor as well as projections regarding the value and anticipated growth of the US market over the period covered. Many thanks..
Simon
Feb, 2019
Hi. I am after data for the following: 1. Global market size split by region (top 10 markets) 2. Top 5 suppliers 3. Top 10 buyers 4. Best selling model and specs Many Thanks.
Paula
Nov, 2020
Would they have information for Colombia?.