IoT Technology Market

IoT Technology Market by Node Component (Sensor, Memory Device, Connectivity IC, Processor, Logic Devices), Software Solution (Remote Monitoring, Data Management), Platform, Service, End-use Application, Geography - Global Forecast to 2029

Report Code: SE 2509 Apr, 2024, by marketsandmarkets.com

[299 Pages Report] The global IoT technology market size is projected to grow from USD 945.6 billion in 2024 to USD 1,377.8 billion by 2029, registering a CAGR of 7.8% during the forecast period. The growing use of wireless smart sensors and networks and increasing necessity of data centers due to rising adoption of cloud platforms are expected to propel the IoT technology market share in the next five years. However, high power consumption by wireless sensor terminals/connected devices will likely pose challenges for industry players.

The objective of the report is to define, describe, and forecast the IoT technology market size based on node component, services, platform, software solution, end user application, and region.
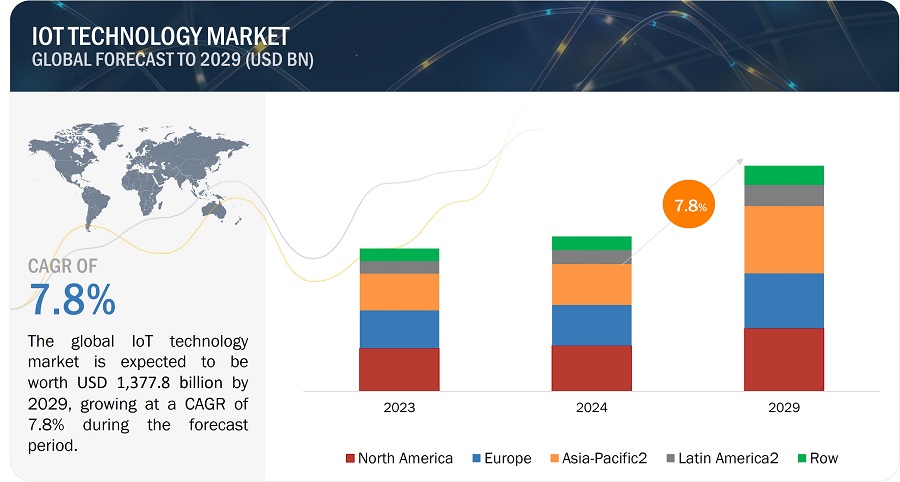
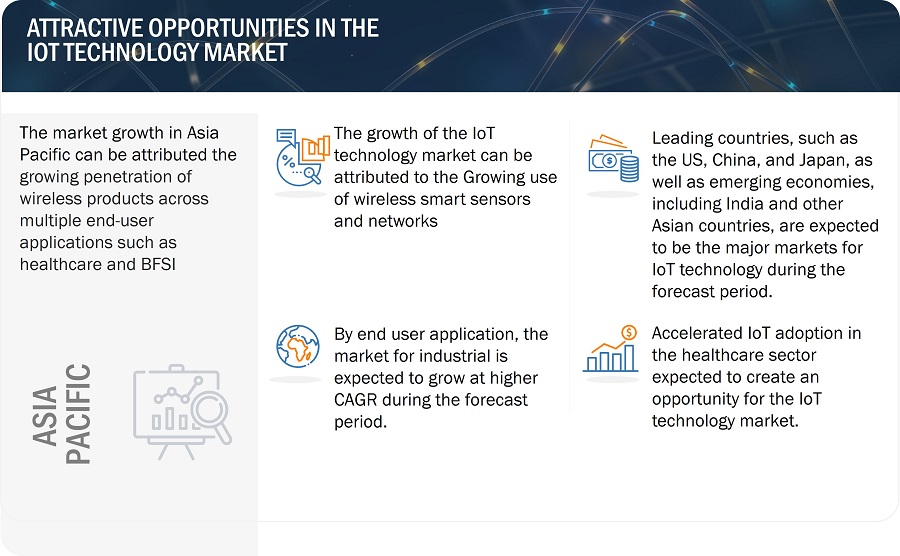
IoT Technology Market

IoT Technology Market

IoT Technology Market Forecast to 2029

To know about the assumptions considered for the study, Request for Free Sample Report

IoT technology market dynamics.

Driver: Emergence of 5G communications technology

The launch of the fifth generation of cellular mobile communications or 5G is having a positive impact on the IoT technology industry. This is mostly because 5G networks significantly enhance the dependability and performance of these linked gadgets. The requirement for a quicker, more capable network that can meet connection demands is addressed by 5G. The frequencies on which digital cellular technologies will carry data are expanded by the 5G spectrum. 5G and IoT technologies together have a wide spectrum that boosts the total bandwidth and allows a vast amount of loT devices to connect. This wider spectrum that is available for use raises the overall capacity of cellular networks, allowing additional devices to connect. With the increasing Internet penetration rate, IoT is finding applications in retail, consumer electronics, agriculture, automotive and transportation, and other sectors. The continuous increase in the number of Internet users across the world is expected to strengthen the overall market for IoT, owing to the growth in Internet-enabled smart devices such as radio frequency identification (RFID), barcode scanners, and mobile computers.

Restraint: Data security and privacy concerns

The Internet of Things gateway manages a vast number of devices and the data that is sent back and forth between edge devices and cloud servers. It acts as a communication layer between these devices. The lot gateway must protect data secrecy while translating protocols. Because Internet of Things communication occurs over both public and private networks, a secure network is necessary. Data privacy is a challenge for the IoT gateway when translating protocols. Data security can be achieved by using encryption security keys, but managing those keys would still be an important concern. Despite advances in hardware and software security, many systems and solutions remain vulnerable to cyber threats.  Furthermore, the need for hardware for Internet of Things applications is anticipated to be impacted by the ongoing data security concerns. This will need the development of more secure and highly encrypted hardware chipsets and networking solutions (such gateways) in the future.

Opportunities: Increased potential for the incorporation of IoT in electric and hybrid vehicles

The automotive industry has made technological improvements to lower the harmful exhaust emissions from vehicles as a result of the strict global emission regulations. One of the most significant advances in the automobile industry's efforts to safeguard the environment is the introduction of EVs. Since these cars don't use traditional fuel, they don't release any toxic emissions. The demand for electric vehicles has increased as a result of all these causes, particularly in industrialized nations like North America and Europe. These cars employ a lot more technological gadgets as they are entirely dependent on an electrical power source. Power electronics is a crucial component of hybrid vehicles and accounts for 20% of the overall cost of ownership, providing an opportunity for semiconductor technology. Currently in the introduction stage, these new technologies are expected to have an impact on the automotive semiconductor market in the upcoming years. Automotive semiconductors are becoming more and more necessary as EVs and HEVs become more popular. Many governments provide various incentives to encourage the use of electric and hybrid vehicles domestically, including those in Germany, the US, Denmark, China, France, Sweden, the UK, and India. Thus, there is now more opportunity for electrification due to new features and improved technologies. Original equipment manufacturers (OEMs) are consequently equipping high-end electric vehicles with an increasing number of ICs, microprocessors, and loT sensors.

Challenges: High power consumption by wireless sensor terminals/connected devices

Sensors and other peripherals in the Internet of Things consume a lot of power. IoT devices must have effective power management and minimize power consumption despite the availability of technology like wireless networking, ultra-low-power processors, and tiny mobile sensors. Another significant issue would be connectivity burden because multiple devices must be linked simultaneously. For example, a typical smart house may include between 50 and 100 connected lights, thermostats, appliances, and other devices—each of which needs a certain amount of power. The line power efficiency would be increased by the usage of devices like smart meters. The main challenge is the power management of devices using wireless technologies like Wi-Fi, as it is not practical to manually change the batteries of hundreds of sensors, actuators, and other linked devices within loT systems on a regular basis. The production of ultra-low-power chips and modules is already a priority for semiconductor makers, but battery technology and wearable and portable devices power management remain areas that require innovation.

Market Map/Ecosystem
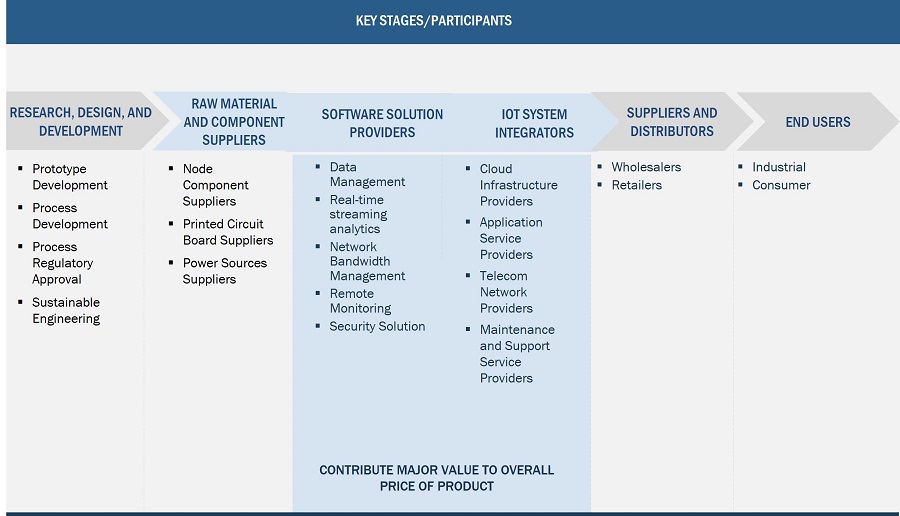
IoT Technology Market by Ecosystem

IoT technology Market : Key Trends.

The prominent players in the IoT technology market share are  Intel Corporation (US), Qualcomm (US), Texas Instruments Incorporated (US), Cisco Systems, Inc. (US), Hewlett Packard Enterprise (US), IBM (US), STMicroelectronics (Switzerland), Microsoft, PTC Inc. (US), and Amazon Web Services (US), among others. These companies boast mixing trends with a comprehensive product portfolio and strong geographic footprint.

Managed service is expected to grow at the highest CARG in the IoT technology market during the forecast period.

The managed service segment is expected to account for a significant share and grow at the highest CAGR during the forecast period. All the pre- and post-deployment queries and needs of customers are addressed under the managed services unit. Companies mainly outsource such services to offer customers on-time delivery. Integrated facility management, consultancy, round-the-clock help desk, finance, and accounts are some of the upcoming managed services required by operators. This segment is mainly driven by the increasing adoption of outsourced managed services in the IoT market size . Managed services increase productivity and help in mitigating risks.

The aerospace & defense segment under industrial application is expected to witness the highest CAGR of the IoT technology market during the forecast period.

The aerospace & defense segment is expected to witness the highest CAGR during the forecast period. IoT in the aerospace and defense segment in industrial application provides connectivity and integration and equips the manufacturer with wide-ranging views of their operations. The aerospace and defense end-user application makes use of sensors to capture comprehensive machine data. These sensors can be used on key equipment, machines, and vehicles. IoT offers numerous opportunities to airlines for the improvement of baggage handling and equipment monitoring.

The IoT technology market is expected to have a largest market share in China from the Asia Pacific region during the forecast period.

The Asia Pacific region continues to be a significant market for IoT technology. Government policies have played a pivotal role in China’s success in IoT. Initiatives such as the “Made in China 2025” plan have prioritized high-tech industries, including IoT, as key areas for development. This government backing has catalyzed research and innovation in IoT, paving the way for its integration into various sectors of the economy. The country has emerged as global manufacturing and an innovation hub for various end-use industries, such as semiconductors, automotive, and consumer electronics. Therefore, it has immense potential for the production and sales of sensor-based devices. China is also the largest automotive manufacturer in the world. It is a leading producer of consumer devices and appliances. The developing economy of the country and the growing deployment of sensors in its most sectors are factors driving the growth of the IoT sensors market in China. The Internet Plus strategy of the country that aims to integrate its IoT initiatives, mobile Internet, cloud computing, and big data is expected to extensively promote the application of IoT and smart technologies.

Furthermore, as China is the major hub for semiconductor fabrication and manufacturing industries, its involvement in the implementation and development of IoT is crucial for the growth of these markets. China is a manufacturing hub and is the leading producer of manufactured goods such as textiles, electronic equipment, and agricultural products. In the production process, IoT is used to monitor the machinery, employees, and environmental conditions. The data can be further used to analyze, control, and prevent risks and avoid economic losses. End-to-end automation is a new concept gaining momentum in the current technology market in China.
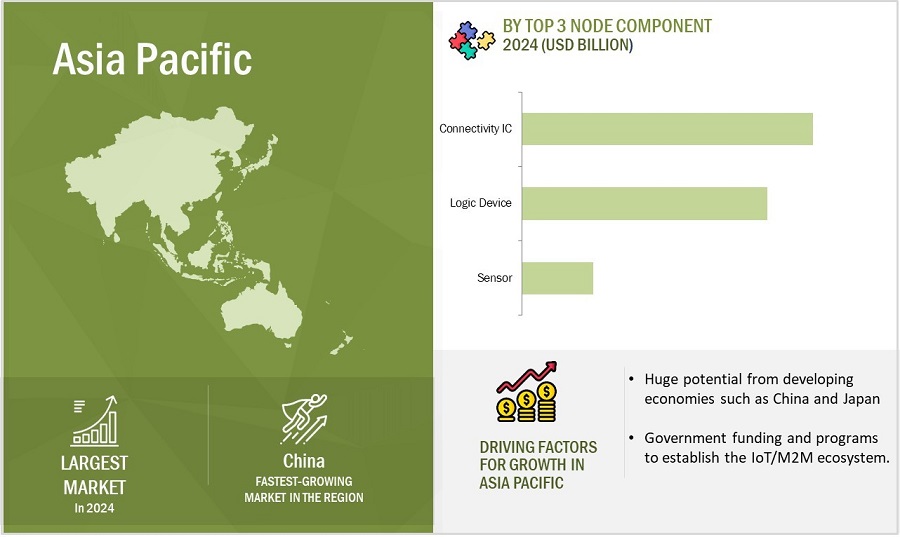
IoT Technology Market by Region

IoT Technology Market  and Statistics by Region

To know about the assumptions considered for the study, download the pdf brochure

Top IoT Technology Companies - Key Market Players:

Major vendors in the IoT technology companies include Intel Corporation (US), Qualcomm (US), Texas Instruments Incorporated (US), Cisco Systems, Inc. (US), Hewlett Packard Enterprise (US), IBM (US), STMicroelectronics (Switzerland), Microsoft, PTC Inc. (US), and Amazon Web Services (US),  among others.

IoT Technology Market Report Scope :

Report Metric

Details

Estimated Market Size USD 945.6 billion in 2024
Projected Market Size
USD 1,377.8 billion by 2029
Growth Rate  CAGR of 7.8%

Market Size Available for Years

2020–2029

Base Year

2023

Forecast Period

2024–2029

Units

Value (USD Million/USD Billion), Volume (Million Units)

Segments Covered

Platform,Node Component, Software Solution, Servies, End Use Application, and Region

Regions Covered

North America, Europe, Asia Pacific, Latin America, and RoW

Companies Covered

Intel Corporation (US), Qualcomm (US), Texas Instruments Incorporated (US), Cisco Systems, Inc. (US), Hewlett Packard Enterprise (US), IBM (US), STMicroelectronics (Switzerland), Microsoft, PTC Inc. (US), and Amazon Web Services (US), among others.
A total of 25 players are profiled in the report.

IoT Technology Market Highlights

This report categorizes the IoT technology market based on platform, node component, software solution, servies, end use application, and region.

Segment

Subsegment

By Platform

  • Device Management
  • Application Management
  • Network Management

By Node Component

  • Processor
  • Connectivity IC
  • Sensor
  • Memory Device
  • Logic Device

By Services

  • Professional Services
  • Managed Services

By Software Solution

  • Data Management
  • Real-Time Streaming Analytics
  • Network Bandwidth Management
  • Remote Monitoring
  • Security Solution

By End Use Application

  • Industrial
  • Consumer

By Region

  • North America
    • US
    • Canada
  • Latin America
    • Mexico
    • Brazil
    • Columbia
    • Rest of  Latin America
  • Europe
    • Germany
    • UK
    • France
    • Rest of Europe
  • Asia Pacific
    • China
    • Japan
    • South Korea
    • Rest of Asia Pacific
  • RoW
    • Middle East
    • Africa

Recent Developments in IoT Technology Industry: 

  • In January 2024, Texas Instruments (US) introduced new semiconductors designed to improve automotive safety and intelligence. The AWR2544 77GHz millimeter-wave radar sensor chip is the industry’s first for satellite radar architectures, enabling higher levels of autonomy by improving sensor fusion and decision-making in ADAS.
  • In October 2023, Sasken Technologies (India), announced a collaboration with Qualcomm Technologies (US), Inc through the Qualcomm® IoT Accelerator Program. This collaboration marks a significant milestone in the realm of Internet of Things (IoT) innovation and underscores both companies’ commitment to shaping the future of connected devices and services. This collaboration aims to address the challenges faced by various industries in their IoT endeavors, such as achieving seamless integration, scalability, and security.
  • In January 2023, Intel Corporation (US) announced its full Intel Core 14th Gen mobile and desktop processor lineup, including powerful new HX-series mobile processors and mainstream 65-watt and 35-watt desktop processors. Additionally, Intel introduced its new Intel Core mobile processor Series 1 family, led by the Intel Core 7 processor 150U, for performant mainstream thin-and-light mobile systems.

Frequently Asked Questions :

To speak to our analyst for a discussion on the above findings, click Speak to Analyst

TABLE OF CONTENTS
 
1 INTRODUCTION (Page No. - 33)
    1.1 STUDY OBJECTIVES 
    1.2 MARKET DEFINITION 
    1.3 STUDY SCOPE 
           1.3.1 MARKETS COVERED
                    FIGURE 1 IOT TECHNOLOGY MARKET: SEGMENTATION
           1.3.2 INCLUSIONS AND EXCLUSIONS
           1.3.3 REGIONAL SCOPE
           1.3.4 YEARS CONSIDERED
    1.4 CURRENCY CONSIDERED 
    1.5 CURRENCY CONSIDERED 
    1.6 LIMITATIONS 
    1.7 STAKEHOLDERS 
    1.8 SUMMARY OF CHANGES 
    1.9 SRECESSION IMPACT 
           FIGURE 2 GDP GROWTH PROJECTION FOR MAJOR ECONOMIES, 2021–2023
 
2 RESEARCH METHODOLOGY (Page No. - 40)
    2.1 RESEARCH APPROACH 
           FIGURE 3 IOT TECHNOLOGY MARKET: RESEARCH DESIGN
           2.1.1 SECONDARY DATA
                    2.1.1.1 List of major secondary sources
                    2.1.1.2 Key data from secondary sources
           2.1.2 PRIMARY DATA
                    2.1.2.1 List of key participants for primary interviews
                    2.1.2.2 Key industry insights
                    2.1.2.3 Key data from primary sources
                    2.1.2.4 Breakdown of primaries
           2.1.3 SECONDARY AND PRIMARY RESEARCH
    2.2 MARKET SIZE ESTIMATION METHODOLOGY 
           2.2.1 BOTTOM-UP APPROACH
                    2.2.1.1 Approach to estimate market size using bottom-up analysis
                               FIGURE 4 MARKET SIZE ESTIMATION METHODOLOGY: BOTTOM-UP APPROACH
           2.2.2 TOP-DOWN APPROACH
                    2.2.2.1 Approach to estimate market size using top-down analysis
                               FIGURE 5 MARKET SIZE ESTIMATION METHODOLOGY: TOP-DOWN APPROACH
    2.3 DATA TRIANGULATION 
           FIGURE 6 DATA TRIANGULATION
    2.4 RESEARCH ASSUMPTIONS 
    2.5 IMPACT OF RECESSION 
    2.6 RESEARCH LIMITATIONS 
    2.7 RISK ASSESSMENT 
 
3 EXECUTIVE SUMMARY (Page No. - 51)
    FIGURE 7 PROCESSORS SEGMENT TO HOLD LARGEST MARKET SHARE IN 2024
    FIGURE 8 REMOTE MONITORING SEGMENT TO RECORD HIGHEST CAGR DURING FORECAST PERIOD
    FIGURE 9 CONSUMER SEGMENT TO HOLD LARGEST MARKET SHARE FROM 2024 TO 2029
    FIGURE 10 IOT TECHNOLOGY MARKET, BY REGION, 2023
 
4 PREMIUM INSIGHTS (Page No. - 55)
    4.1 ATTRACTIVE OPPORTUNITIES FOR PLAYERS IN IOT TECHNOLOGY MARKET 
           FIGURE 11 INCREASING DEMAND FROM AUTOMOTIVE & TRANSPORTATION SECTOR TO FUEL MARKET GROWTH
    4.2 IOT TECHNOLOGY MARKET, BY SERVICE 
           FIGURE 12 MANAGED SERVICES SEGMENT TO DOMINATE MARKET DURING FORECAST PERIOD
    4.3 IOT TECHNOLOGY MARKET, BY END-USE APPLICATION 
           FIGURE 13 AEROSPACE & DEFENSE SEGMENT TO RECORD HIGHEST CAGR DURING FORECAST PERIOD
    4.4 IOT TECHNOLOGY MARKET IN NORTH AMERICA,  BY END-USE APPLICATION AND COUNTRY 
           FIGURE 14 AUTOMOTIVE & TRANSPORTATION AND US HELD LARGEST SHARES OF NORTH AMERICA IOT MARKET IN 2023
    4.5 IOT TECHNOLOGY MARKET, BY COUNTRY 
           FIGURE 15 CHINA TO DOMINATE GLOBAL IOT TECHNOLOGY MARKET FROM 2024 TO 2029
 
5 MARKET OVERVIEW (Page No. - 58)
    5.1 INTRODUCTION 
    5.2 MARKET DYNAMICS 
           FIGURE 16 IOT TECHNOLOGY MARKET: DRIVERS, RESTRAINTS, OPPORTUNITIES,  AND CHALLENGES
           5.2.1 DRIVERS
                    5.2.1.1 Global rise in internet penetration
                               FIGURE 17 GLOBAL INTERNET PENETRATION TILL 2024, BY REGION
                    5.2.1.2 Growing adoption of cloud platforms
                    5.2.1.3 Proliferation of wireless sensor networks
                    5.2.1.4 Increasing adoption of IPv6
                               FIGURE 18 ADOPTION RATE OF IPV6, BY COUNTRY, 2023
                               FIGURE 19 IOT TECHNOLOGY MARKET: IMPACT ANALYSIS OF DRIVERS
           5.2.2 RESTRAINTS
                    5.2.2.1 Data security and privacy concerns
                               FIGURE 20 IOT TECHNOLOGY MARKET: IMPACT ANALYSIS OF RESTRAINTS
           5.2.3 OPPORTUNITIES
                    5.2.3.1 Increasing cross-domain collaborations
                               FIGURE 21 CROSS-DOMAIN COLLABORATIONS USING IOT
                    5.2.3.2 Government-led funding to develop IoT research projects
                    5.2.3.3 Emergence of connected care in healthcare sector
                    5.2.3.4 Increasing demand for HEVs and EVs
                    5.2.3.5 Growing safety concerns with rising urbanization
                               FIGURE 22 IOT TECHNOLOGY MARKET: IMPACT ANALYSIS OF OPPORTUNITIES
           5.2.4 CHALLENGES
                    5.2.4.1 Interoperability challenges and lack of common standards
                    5.2.4.2 High power consumption by wireless sensor terminals/connected devices
                    5.2.4.3 Lack of skilled professionals
                               FIGURE 23 IOT TECHNOLOGY MARKET: IMPACT ANALYSIS OF CHALLENGES
    5.3 VALUE CHAIN ANALYSIS 
           FIGURE 24 IOT TECHNOLOGY MARKET: VALUE CHAIN ANALYSIS
           5.3.1 R&D ENGINEERS
           5.3.2 RAW MATERIAL AND COMPONENT SUPPLIERS
           5.3.3 SOFTWARE SOLUTION PROVIDERS
           5.3.4 IOT SYSTEM INTEGRATORS
           5.3.5 SUPPLIERS AND DISTRIBUTORS
           5.3.6 END USERS
    5.4 ECOSYSTEM ANALYSIS 
           FIGURE 25 IOT TECHNOLOGY MARKET: ECOSYSTEM ANALYSIS
           TABLE 1 ROLES OF COMPANIES IN IOT TECHNOLOGY ECOSYSTEM
    5.5 TRENDS/DISRUPTIONS IMPACTING CUSTOMERS' BUSINESSES 
           FIGURE 26 TRENDS/DISRUPTIONS IMPACTING CUSTOMERS’ BUSINESSES
    5.6 TECHNOLOGY ANALYSIS 
           5.6.1 KEY TECHNOLOGIES
                    5.6.1.1 Integration of AI with IoT
                    5.6.1.2 Integration of ML with IoT
           5.6.2 COMPLEMENTARY TECHNOLOGIES
                    5.6.2.1 Digital twin
           5.6.3 ADJACENT TECHNOLOGIES
                    5.6.3.1 Edge computing
                    5.6.3.2 Wi-Fi
                    5.6.3.3 Cloud computing
                    5.6.3.4 Big data analytics
    5.7 PORTER'S FIVE FORCES ANALYSIS 
           FIGURE 27 IOT TECHNOLOGY MARKET: PORTER'S FIVE FORCES ANALYSIS
           TABLE 2 IOT TECHNOLOGY MARKET: PORTER'S FIVE FORCES
           5.7.1 THREAT OF NEW ENTRANTS
           5.7.2 THREAT OF SUBSTITUTES
           5.7.3 BARGAINING POWER OF SUPPLIERS
           5.7.4 BARGAINING POWER OF BUYERS
           5.7.5 INTENSITY OF COMPETITIVE RIVALRY
    5.8 KEY STAKEHOLDERS AND BUYING CRITERIA 
           5.8.1 KEY STAKEHOLDERS IN BUYING PROCESS
                    FIGURE 28 INFLUENCE OF STAKEHOLDERS ON BUYING PROCESS, BY END-USE APPLICATION
                    TABLE 3 INFLUENCE OF STAKEHOLDERS ON BUYING PROCESS, BY END-USE APPLICATION (%)
           5.8.2 BUYING CRITERIA
                    FIGURE 29 KEY BUYING CRITERIA, BY END-USE APPLICATION
                    TABLE 4 KEY BUYING CRITERIA, BY END-USE APPLICATION
    5.9 CASE STUDY ANALYSIS 
           5.9.1 SOLULAB INC. ASSISTED ENMATRIX TO DEVELOP IOT MOBILE APPLICATION FOR SMART BUILDINGS AND YACHT MANAGEMENT
           5.9.2 SOLULAB INC. HELPED GEARNETICS TO DEVELOP ADVANCED IOT FLEET MANAGEMENT SOLUTIONS
           5.9.3 SANXING AND TELENOR CONNEXION FACILITATED LEADING SWEDISH ENERGY SUPPLIER TO IMPLEMENT IOT-BASED METERING SOLUTION FOR CONNECTING SMART METERS
           5.9.4 ISA MINIMIZED EQUIPMENT BREAKDOWN WITH IOT-ENABLED PREDICTIVE MAINTENANCE SOLUTION
           5.9.5 TELENOR ASSISTED SWEGON IN IMPLEMENTING IOT-BASED CLIMATE CONTROL SYSTEMS
    5.10 TARIFF, STANDARD, AND REGULATORY LANDSCAPE 
           TABLE 5 MFN TARIFF RELATED TO HS CODE 852580-COMPLIANT PRODUCTS EXPORTED BY US
           TABLE 6 MFN TARIFF RELATED TO HS CODE 852580-COMPLIANT PRODUCTS EXPORTED BY CHINA
           TABLE 7 STANDARDS FOR IOT TECHNOLOGY MARKET
           5.10.1 REGULATORY BODIES, GOVERNMENT AGENCIES, AND OTHER ORGANIZATIONS
                    TABLE 8 NORTH AMERICA: LIST OF REGULATORY BODIES, GOVERNMENT AGENCIES,  AND OTHER ORGANIZATIONS
                    TABLE 9 EUROPE: LIST OF REGULATORY BODIES, GOVERNMENT AGENCIES, AND OTHER ORGANIZATIONS
                    TABLE 10 ASIA PACIFIC: LIST OF REGULATORY BODIES, GOVERNMENT AGENCIES, AND OTHER ORGANIZATIONS
                    TABLE 11 ROW: LIST OF REGULATORY BODIES, GOVERNMENT AGENCIES, AND OTHER ORGANIZATIONS
    5.11 PRICING ANALYSIS 
           5.11.1 INDICATIVE PRICING TREND, BY NODE COMPONENT
                    TABLE 12 INDICATIVE PRICING TREND OF NODE COMPONENTS, 2023 (USD)
                    FIGURE 30 INDICATIVE PRICING TREND OF NODE COMPONENTS, 2020–2029 (USD)
           5.11.2 INDICATIVE PRICING TREND OF KEY PLAYERS, BY NODE COMPONENT, 2023
                    FIGURE 31 INDICATIVE PRICING TREND OF IOT DEVICES OFFERED BY KEY PLAYERS,  BY NODE COMPONENT, 2023
                    TABLE 13 INDICATIVE PRICING TREND OF IOT DEVICES OFFERED BY KEY PLAYERS, BY NODE COMPONENT, 2023 (USD)
           5.11.3 AVERAGE SELLING PRICE TREND, BY REGION
                    FIGURE 32 AVERAGE SELLING PRICE TREND OF LOGIC DEVICES, BY REGION,  2020–2029 (USD)
    5.12 TRADE ANALYSIS 
           5.12.1 TRADE ANALYSIS FOR HVAC SYSTEMS
                    5.12.1.1 Import scenario (HS code 841510)
                                FIGURE 33 IMPORT DATA FOR HS CODE 841510-COMPLIANT PRODUCTS, BY COUNTRY, 2018–2022 (USD MILLION)
                    5.12.1.2 Export scenario (HS code 841510)
                                FIGURE 34 EXPORT DATA FOR HS CODE 841510-COMPLIANT PRODUCTS, BY COUNTRY, 2018–2022 (USD MILLION)
           5.12.2 TRADE ANALYSIS FOR VIDEO SURVEILLANCE SYSTEMS
                    5.12.2.1 Import scenario (HS code 852580)
                                FIGURE 35 IMPORT DATA FOR HS CODE 852580-COMPLIANT PRODUCTS, BY COUNTRY, 2018–2022 (USD MILLION)
                    5.12.2.2 Export scenario (HS code 852580)
                                FIGURE 36 EXPORT DATA FOR HS CODE 852580-COMPLIANT PRODUCTS, BY COUNTRY, 2018–2022 (USD MILLION)
           5.12.3 TRADE ANALYSIS FOR FIRE PROTECTION SYSTEMS
                    5.12.3.1 Import scenario (HS code 842410)
                                FIGURE 37 IMPORT DATA FOR HS CODE 842410-COMPLIANT PRODUCTS, BY COUNTRY, 2018–2022 (USD MILLION)
                    5.12.3.2 Export scenario (HS code 842410)
                                FIGURE 38 EXPORT DATA FOR HS CODE 842410-COMPLIANT PRODUCTS, BY COUNTRY, 2018–2022 (USD MILLION)
    5.13 PATENT ANALYSIS 
           FIGURE 39 NUMBER OF PATENTS APPLIED AND GRANTED RELATED TO IOT TECHNOLOGY, 2013–2022
           TABLE 14 LIST OF MAJOR PATENTS APPLIED/GRANTED RELATED TO IOT TECHNOLOGY, 2013–2022
           TABLE 15 PATENT REGISTRATIONS RELATED TO IOT TECHNOLOGY, 2022–2023
    5.14 KEY CONFERENCES AND EVENTS, 2024–2025 
           TABLE 16 IOT TECHNOLOGY MARKET: LIST OF KEY CONFERENCES AND EVENTS, 2024–2025
    5.15 INVESTMENT AND FUNDING SCENARIO 
           FIGURE 40 GLOBAL VENTURE-CAPITAL INVESTMENT IN IOT STARTUPS (USD BILLION)
 
6 IOT TECHNOLOGY MARKET, BY SOFTWARE SOLUTION (Page No. - 105)
    6.1 INTRODUCTION 
           FIGURE 41 IOT TECHNOLOGY MARKET, BY SOFTWARE SOLUTION
           FIGURE 42 REMOTE MONITORING SEGMENT TO REGISTER HIGHEST CAGR DURING FORECAST PERIOD
           TABLE 17 IOT TECHNOLOGY MARKET, BY SOFTWARE SOLUTION, 2020–2023 (USD BILLION)
           TABLE 18 IOT TECHNOLOGY MARKET, BY SOFTWARE SOLUTION, 2024–2029 (USD BILLION)
    6.2 REAL-TIME STREAMING ANALYTICS 
           6.2.1 ABILITY TO ANALYZE DATA GENERATED IN DIFFERENT FORMATS IN REAL TIME TO BOOST DEMAND
    6.3 SECURITY SOLUTIONS 
           6.3.1 RISING NEED TO SECURE NETWORK OF CONNECTED DEVICES TO FUEL MARKET GROWTH
    6.4 DATA MANAGEMENT 
           6.4.1 RISING NEED TO UNDERSTAND DATA PATTERNS AND DEVELOP LOGICAL INFORMATION TO BOOST DEMAND
    6.5 REMOTE MONITORING 
           6.5.1 RISING DEPLOYMENT IN SMART GRIDS, PIPELINE SENSORS, AND SERVER MONITORING TO FOSTER SEGMENTAL GROWTH
    6.6 NETWORK BANDWIDTH MANAGEMENT 
           6.6.1 ABILITY TO INCREASE NETWORK EFFICIENCY BY TRACKING BANDWIDTH AND RESOURCE CONSUMPTION TO DRIVE MARKET
 
7 IOT TECHNOLOGY MARKET, BY PLATFORM (Page No. - 110)
    7.1 INTRODUCTION 
           FIGURE 43 IOT TECHNOLOGY MARKET, BY PLATFORM
           FIGURE 44 NETWORK MANAGEMENT SEGMENT TO HOLD LARGEST MARKET SHARE IN 2029
           TABLE 19 IOT TECHNOLOGY MARKET, BY PLATFORM, 2020–2023 (USD BILLION)
           TABLE 20 IOT TECHNOLOGY MARKET, BY PLATFORM, 2024–2029 (USD BILLION)
    7.2 DEVICE MANAGEMENT 
           7.2.1 GROWING REQUIREMENT TO MANAGE ACCESS AND CONTROL OVER IOT DEVICES TO FUEL MARKET GROWTH
    7.3 APPLICATION MANAGEMENT 
           7.3.1 RISING NEED FOR EFFECTIVE MONITORING AND REMOTE DEVICE MANAGEMENT TO BOOST DEMAND
    7.4 NETWORK MANAGEMENT 
           7.4.1 ABILITY TO PREVENT NETWORK CRASHES DUE TO HIGH AMOUNT OF DATA TRANSFERS TO DRIVE DEMAND
 
8 IOT TECHNOLOGY MARKET, BY SERVICE (Page No. - 115)
    8.1 INTRODUCTION 
           FIGURE 45 IOT TECHNOLOGY MARKET, BY SERVICE
           FIGURE 46 MANAGED SERVICES SEGMENT TO GROW AT HIGHER CAGR DURING FORECAST PERIOD
           TABLE 21 IOT TECHNOLOGY MARKET, BY SERVICE, 2020–2023 (USD MILLION)
           TABLE 22 IOT TECHNOLOGY MARKET, BY SERVICE, 2024–2029 (USD MILLION)
    8.2 PROFESSIONAL SERVICES 
           8.2.1 INCREASING DEMAND FOR CONNECTED DEVICES IN INDUSTRIAL AND TRANSPORTATION SECTORS TO BOOST DEMAND
                    FIGURE 47 PROFESSIONAL SERVICES OFFERED BY IOT
           8.2.2 BUSINESS PLANNING
           8.2.3 SYSTEM DESIGN
           8.2.4 SECURITY
           8.2.5 SOFTWARE/PLATFORM DEVELOPMENT & INTEGRATION
           8.2.6 OPERATIONAL SUPPORT AND MAINTENANCE
           8.2.7 DELIVERY AND DEPLOYMENT
    8.3 MANAGED SERVICES 
           8.3.1 INCREASING ADOPTION OF OUTSOURCED MANAGED SERVICES TO DRIVE DEMAND
                    FIGURE 48 MANAGED SERVICES OFFERED BY IOT
                    8.3.1.1 Streamline operations
           8.3.2 OPTIMIZE PERSONNEL
           8.3.3 MANAGE IOT COSTS
           8.3.4 ENHANCE VISIBILITY
 
9 IOT TECHNOLOGY MARKET, BY END-USE APPLICATION (Page No. - 122)
    9.1 INTRODUCTION 
           FIGURE 49 IOT TECHNOLOGY MARKET, BY END-USE APPLICATION
           TABLE 23 IOT TECHNOLOGY MARKET, BY END-USE APPLICATION, 2020–2023 (USD BILLION)
           TABLE 24 IOT TECHNOLOGY MARKET, BY END-USE APPLICATION, 2024–2029 (USD BILLION)
           FIGURE 50 CONSUMER SEGMENT TO HOLD LARGER MARKET SHARE FROM IN 2024
           TABLE 25 INDUSTRIAL: IOT TECHNOLOGY MARKET, BY SUB END-USE APPLICATION,  2020–2023 (USD BILLION)
           TABLE 26 INDUSTRIAL: IOT TECHNOLOGY MARKET, BY SUB END-USE APPLICATION, 2024–2029 (USD BILLION)
           FIGURE 51 BUILDING AUTOMATION SEGMENT TO HOLD LARGEST MARKET SHARE IN 2029
           TABLE 27 CONSUMER: IOT TECHNOLOGY MARKET FOR, BY SUB END-USE APPLICATION,  2020–2023 (USD BILLION)
           TABLE 28 CONSUMER: IOT TECHNOLOGY MARKET, BY SUB END-USE APPLICATION,  2024–2029 (USD BILLION )
    9.2 INDUSTRIAL 
           TABLE 29 INDUSTRIAL: IOT TECHNOLOGY MARKET, BY NODE COMPONENT,  2020–2023 (USD BILLION)
           TABLE 30 IOT TECHNOLOGY MARKET FOR INDUSTRIAL, BY NODE COMPONENT,  2024–2029 (USD BILLION)
           9.2.1 HEALTHCARE
                    9.2.1.1 Growing chronic illness among expanding population to boost demand
                               TABLE 31 HEALTHCARE: IOT TECHNOLOGY MARKET, BY DEVICE TYPE,  2020–2023 (USD MILLION)
                               TABLE 32 HEALTHCARE: IOT TECHNOLOGY MARKET, BY DEVICE TYPE,  2024–2029 (USD MILLION)
                    9.2.1.2 IoT technology-based products used in healthcare sector
                               9.2.1.2.1 Fitness & heart rate monitors
                               9.2.1.2.2 Blood pressure monitors
                               9.2.1.2.3 Blood glucose meters
                               9.2.1.2.4 Continuous glucose monitors
                               9.2.1.2.5 Pulse oximeters
                               9.2.1.2.6 Automated external defibrillators
                               9.2.1.2.7 Programmable syringe pumps
                               9.2.1.2.8 Wearable injectors
                               9.2.1.2.9 Multiparameter monitors
                               9.2.1.2.10 Fall detectors
                               9.2.1.2.11 Smart pill dispensers
                               9.2.1.2.12 Gateways
           9.2.2 AUTOMOTIVE & TRANSPORTATION
                    9.2.2.1 Increasing demand for connected automobile services to drive market
                               TABLE 33 AUTOMOTIVE & TRANSPORTATION: IOT TECHNOLOGY MARKET, BY TYPE,  2020–2023 (USD MILLION)
                               TABLE 34 AUTOMOTIVE & TRANSPORTATION: IOT TECHNOLOGY MARKET, BY TYPE, 2024–2029 (USD MILLION)
                    9.2.2.2 IoT technology-based products used in automotive & transportation sector
                               9.2.2.2.1 Connected cars
                                            9.2.2.2.1.1 Level 1 – Driver Assistance
                                            9.2.2.2.1.2 Level 2 – Partial Automation
                                            9.2.2.2.1.3 Level 3 – Conditional Automation
                                            9.2.2.2.1.4 Level 4 – High Automation
                               9.2.2.2.2 Ultrasonic sensors
                               9.2.2.2.3 Camera/Image sensors
                               9.2.2.2.4 Radars
                               9.2.2.2.5 LiDAR
                               9.2.2.2.6 Infrared detectors
                    9.2.2.3 In-car infotainment
                    9.2.2.4 Traffic management
                               9.2.2.4.1 Vehicle detection sensors
                               9.2.2.4.2 Pedestrian presence sensors
                               9.2.2.4.3 Speed sensors
                               9.2.2.4.4 Thermal cameras
                               9.2.2.4.5 Automated incident detection cameras
                    9.2.2.5 Public transport/Mass transit
                    9.2.2.6 E-tolls
                    9.2.2.7 Gateways
           9.2.3 BUILDING AUTOMATION
                    9.2.3.1 Increased awareness regarding energy conservation to boost demand
                               TABLE 35 BUILDING AUTOMATION: IOT TECHNOLOGY MARKET, BY TYPE,  2020–2023 (USD BILLION)
                               TABLE 36 BUILDING AUTOMATION: IOT TECHNOLOGY MARKET, BY TYPE,  2024–2029 (USD BILLION)
                    9.2.3.2 IoT technology-based products used in building automation sector
                               9.2.3.2.1 Occupancy sensors
                               9.2.3.2.2 Daylight sensors
                               9.2.3.2.3 Smart thermostats
                               9.2.3.2.4 IP cameras
                               9.2.3.2.5 Smart meters
                               9.2.3.2.6 Smart locks
                               9.2.3.2.7 Smoke detectors
                               9.2.3.2.8 Gateways
           9.2.4 MANUFACTURING
                    9.2.4.1 Adoption of Industry 4.0 & 5.0 principles to boost demand
                               TABLE 37 MANUFACTURING: IOT TECHNOLOGY MARKET, BY TYPE, 2020–2023 (USD MILLION)
                               TABLE 38 MANUFACTURING: IOT TECHNOLOGY MARKET, BY TYPE, 2024–2029 (USD MILLION)
                    9.2.4.2 IoT technology-based products used in manufacturing sector
                               9.2.4.2.1 Temperature sensors
                               9.2.4.2.2 Pressure sensors
                               9.2.4.2.3 Level sensors
                               9.2.4.2.4 Flow sensors
                               9.2.4.2.5 Chemical sensors
                               9.2.4.2.6 Humidity sensors
                               9.2.4.2.7 Motion & position sensors
                               9.2.4.2.8 Image sensors
                               9.2.4.2.9 Gateways
           9.2.5 RETAIL
                    9.2.5.1 Growing popularity of digital signage and intelligent vending machines to fuel market growth
                               TABLE 39 RETAIL: IOT TECHNOLOGY MARKET, BY TYPE, 2020–2023 (USD BILLION)
                               TABLE 40 RETAIL: IOT TECHNOLOGY MARKET, BY TYPE, 2024–2029 (USD BILLION)
                    9.2.5.2 IoT technology-based products used in retail sector
                               9.2.5.2.1 Intelligent vending machines
                               9.2.5.2.2 Contactless checkout
                               9.2.5.2.3 Smart mirrors
                               9.2.5.2.4 Smart shopping carts
                               9.2.5.2.5 Digital signage
                               9.2.5.2.6 Smart tags
                               9.2.5.2.7 Wireless beacons
                               9.2.5.2.8 Gateways
           9.2.6 BFSI
                    9.2.6.1 Increasing deployment of IoT technology with rising competition in Fintech sector to drive market
                              FIGURE 52 KEY APPLICATION AREAS OF IOT IN BFSI SECTOR
                              TABLE 41 BFSI: IOT TECHNOLOGY MARKET, BY TYPE, 2020–2023 (USD MILLION)
                              TABLE 42 BFSI: IOT TECHNOLOGY MARKET, BY TYPE, 2024–2029 (USD MILLION)
                    9.2.6.2 IoT technology-based products in BFSI sector
                               9.2.6.2.1 Mobile point of sale
                               9.2.6.2.2 Smart kiosk/Interactive kiosk
                               9.2.6.2.3 Gateways
           9.2.7 OIL & GAS
                    9.2.7.1 Rising convergence of machines and intelligent data to drive market
                               TABLE 43 OIL & GAS: IOT TECHNOLOGY MARKET, BY TYPE, 2020–2023 (USD THOUSAND)
                               TABLE 44 OIL & GAS: IOT TECHNOLOGY MARKET, BY TYPE, 2024–2029 (USD THOUSAND)
                    9.2.7.2 IoT technology-based products in oil & gas industry
                               9.2.7.2.1 Temperature sensors
                               9.2.7.2.2 Pressure sensors
                               9.2.7.2.3 Level sensors
                               9.2.7.2.4 Flow sensors
                               9.2.7.2.5 Image sensors
                               9.2.7.2.6 Other sensors
                               9.2.7.2.7 Gateways
           9.2.8 AGRICULTURE
                    9.2.8.1 Ability to monitor crop status and analyze soil conditions to drive market
                              FIGURE 53 IOT IN AGRICULTURE SECTOR
                              TABLE 45 AGRICULTURE: IOT TECHNOLOGY MARKET, BY TYPE, 2020–2023 (USD MILLION)
                              TABLE 46 IOT TECHNOLOGY MARKET FOR AGRICULTURE, BY TYPE, 2024–2029 (USD MILLION)
                    9.2.8.2 IoT technology-based products used in agriculture sector
                               9.2.8.2.1 Climate sensors
                               9.2.8.2.2 Soil moisture sensors
                               9.2.8.2.3 Level sensors
                               9.2.8.2.4 Gateways
           9.2.9 AEROSPACE & DEFENSE
                    9.2.9.1 Rising focus on improving efficiency, passenger safety, security, and experience to boost demand
                               TABLE 47 AEROSPACE & DEFENSE: IOT TECHNOLOGY MARKET, BY TYPE,  2020–2023 (USD MILLION)
                               TABLE 48 AEROSPACE & DEFENSE: IOT TECHNOLOGY MARKET, BY TYPE,  2024–2029 (USD MILLION)
                    9.2.9.2 IoT technology-based products used in aerospace & defense sector
                               9.2.9.2.1 Smart baggage tags
                               9.2.9.2.2 Smart beacons
                               9.2.9.2.3 ePassport gates
                               9.2.9.2.4 Drones/Unmanned aerial vehicles
 
    9.3 CONSUMER 
           TABLE 49 CONSUMER: IOT TECHNOLOGY MARKET, BY NODE COMPONENT,  2020–2023 (USD BILLION)
           TABLE 50 CONSUMER: IOT TECHNOLOGY MARKET, BY NODE COMPONENT,  2024–2029 (USD BILLION)
           9.3.1 WEARABLE DEVICES
                    9.3.1.1 Escalating demand for smartwatches to boost demand
                    9.3.1.2 IoT technology-based products used in wearable device industry
                               9.3.1.2.1 Activity monitors
                               9.3.1.2.2 Smartwatches
                               9.3.1.2.3 Smart glasses
                               9.3.1.2.4 Body-worn cameras
                               9.3.1.2.5 Panic/SOS buttons
                               9.3.1.2.6 Smart locators
                               9.3.1.2.7 Smart water purifiers
                               9.3.1.2.8 Identity authenticators
                               9.3.1.2.9 Thermal bracelets
                               9.3.1.2.10 Safe driving ingestible pills
                                              TABLE 51 WEARABLE DEVICES: IOT TECHNOLOGY MARKET, BY TYPE,  2020–2023 (USD BILLION)
                                              TABLE 52 WEARABLE DEVICES: IOT TECHNOLOGY MARKET, BY TYPE,  2024–2029 (USD BILLION)
           9.3.2 CONSUMER ELECTRONICS
                    9.3.2.1 Ability to measure and control energy usage to boost demand
                    9.3.2.2 IoT technology-based products used in consumer electronics industry
                               9.3.2.2.1 Smart lighting devices
                               9.3.2.2.2 Smart TVs
                               9.3.2.2.3 Smart washing machines
                               9.3.2.2.4 Smart dryers
                               9.3.2.2.5 Smart refrigerators
                               9.3.2.2.6 Smart ovens
                               9.3.2.2.7 Smart cooktops
                               9.3.2.2.8 Smart cookers
                               9.3.2.2.9 Smart deep freezers
                               9.3.2.2.10 Smart dishwashers
                               9.3.2.2.11 Smart coffee makers
                               9.3.2.2.12 Smart kettles
                               9.3.2.2.13 Gateways
           TABLE 53 CONSUMER ELECTRONICS: IOT TECHNOLOGY MARKET, BY TYPE,  2020–2023 (USD BILLION)
           TABLE 54 CONSUMER ELECTRONICS: IOT TECHNOLOGY MARKET, BY TYPE,  2024–2029 (USD MILLION)
 
10 IOT TECHNOLOGY MARKET, BY REGION (Page No. - 162)
     10.1 INTRODUCTION 
             FIGURE 54 IOT TECHNOLOGY MARKET, BY REGION
             FIGURE 55 ASIA PACIFIC TO REGISTER HIGHEST CAGR DURING FORECAST PERIOD
             TABLE 55 IOT TECHNOLOGY MARKET, BY REGION, 2020–2023 (USD BILLION)
             TABLE 56 IOT TECHNOLOGY MARKET, BY REGION, 2024–2029 (USD BILLION)
     10.2 NORTH AMERICA 
             10.2.1 RECESSION IMPACT ON IOT TECHNOLOGY MARKET IN NORTH AMERICA
                        FIGURE 56 NORTH AMERICA: IOT TECHNOLOGY MARKET SNAPSHOT
                        TABLE 57 NORTH AMERICA: IOT TECHNOLOGY MARKET, BY COUNTRY, 2020–2023 (USD BILLION)
                        TABLE 58 NORTH AMERICA: IOT TECHNOLOGY MARKET, BY COUNTRY, 2024–2029 (USD BILLION)
                        TABLE 59 NORTH AMERICA: IOT TECHNOLOGY MARKET, BY NODE COMPONENT,  2020–2023 (USD BILLION)
                        TABLE 60 NORTH AMERICA: IOT TECHNOLOGY MARKET, BY NODE COMPONENT,  2024–2029 (USD BILLION)
                        TABLE 61 NORTH AMERICA: IOT TECHNOLOGY MARKET, BY SOFTWARE SOLUTION,  2020–2023 (USD BILLION)
                        TABLE 62 NORTH AMERICA: IOT TECHNOLOGY MARKET, BY SOFTWARE SOLUTION,  2024–2029 (USD BILLION)
                        TABLE 63 NORTH AMERICA: IOT TECHNOLOGY MARKET, BY PLATFORM, 2020–2023 (USD BILLION)
                        TABLE 64 NORTH AMERICA: IOT TECHNOLOGY MARKET, BY PLATFORM, 2024–2029 (USD BILLION)
                        TABLE 65 NORTH AMERICA: IOT TECHNOLOGY MARKET, BY SERVICE, 2020–2023 (USD BILLION)
                        TABLE 66 NORTH AMERICA: IOT TECHNOLOGY MARKET, BY SERVICE, 2024–2029 (USD BILLION)
             10.2.2 US
                        10.2.2.1 Government-led investments to implement IoT solutions to drive market
             10.2.3 CANADA
                        10.2.3.1 Rising establishment of data centers to fuel market growth
     10.3 EUROPE 
             10.3.1 RECESSION IMPACT ON IOT TECHNOLOGY MARKET IN EUROPE
                        FIGURE 57 EUROPE: IOT TECHNOLOGY MARKET SNAPSHOT
                        TABLE 67 EUROPE: IOT TECHNOLOGY MARKET, BY COUNTRY, 2020–2023 (USD BILLION)
                        TABLE 68 EUROPE: IOT TECHNOLOGY MARKET, BY COUNTRY, 2024–2029 (USD BILLION)
                        TABLE 69 EUROPE: IOT TECHNOLOGY MARKET, BY NODE COMPONENT, 2020–2023 (USD BILLION)
                        TABLE 70 EUROPE: IOT TECHNOLOGY MARKET, BY NODE COMPONENT, 2024–2029 (USD MILLION)
                        TABLE 71 EUROPE: IOT TECHNOLOGY MARKET, BY SOFTWARE SOLUTION,  2020–2023 (USD BILLION)
                        TABLE 72 EUROPE: IOT TECHNOLOGY MARKET, BY SOFTWARE SOLUTION,  2024–2029 (USD BILLION)
                        TABLE 73 EUROPE: IOT TECHNOLOGY MARKET, BY PLATFORM, 2020–2023 (USD BILLION)
                        TABLE 74 EUROPE: IOT TECHNOLOGY MARKET, BY PLATFORM, 2024–2029 (USD BILLION)
                        TABLE 75 EUROPE: IOT TECHNOLOGY MARKET, BY SERVICE, 2020–2023 (USD BILLION)
                        TABLE 76 EUROPE: IOT TECHNOLOGY MARKET, BY SERVICE, 2024–2029 (USD BILLION)
             10.3.2 UK
                        10.3.2.1 Presence of robust digital infrastructure to fuel market growth
             10.3.3 GERMANY
                        10.3.3.1 Increased adoption of IoT solutions by automotive and manufacturing sectors to boost demand
             10.3.4 FRANCE
                        10.3.4.1 Rising demand for portable electronics in various sectors to drive market
             10.3.5 REST OF EUROPE
     10.4 ASIA PACIFIC 
             10.4.1 RECESSION IMPACT ON IOT TECHNOLOGY MARKET IN ASIA PACIFIC
                        FIGURE 58 ASIA PACIFIC: IOT TECHNOLOGY MARKET SNAPSHOT
                        TABLE 77 ASIA PACIFIC: IOT TECHNOLOGY MARKET, BY COUNTRY, 2020–2023 (USD BILLION)
                        TABLE 78 ASIA PACIFIC: IOT TECHNOLOGY MARKET, BY COUNTRY, 2024–2029 (USD BILLION)
                        TABLE 79 ASIA PACIFIC: IOT TECHNOLOGY MARKET, BY NODE COMPONENT,  2020–2023 (USD BILLION)
                        TABLE 80 ASIA PACIFIC: IOT TECHNOLOGY MARKET, BY NODE COMPONENT,  2024–2029 (USD MILLION)
                        TABLE 81 ASIA PACIFIC: IOT TECHNOLOGY MARKET, BY SOFTWARE SOLUTION,  2020–2023 (USD BILLION)
                        TABLE 82 ASIA PACIFIC: IOT TECHNOLOGY MARKET, BY SOFTWARE SOLUTION, 2024–2029 (USD BILLION)
                        TABLE 83 ASIA PACIFIC: IOT TECHNOLOGY MARKET, BY PLATFORM, 2020–2023 (USD BILLION)
                        TABLE 84 ASIA PACIFIC: IOT TECHNOLOGY MARKET, BY PLATFORM, 2024–2029 (USD BILLION)
                        TABLE 85 ASIA PACIFIC: IOT TECHNOLOGY MARKET, BY SERVICE, 2020–2023 (USD BILLION)
                        TABLE 86 ASIA PACIFIC: IOT TECHNOLOGY MARKET, BY SERVICE, 2024–2029 (USD BILLION)
             10.4.2 CHINA
                        10.4.2.1 Booming manufacturing sector to drive market
             10.4.3 JAPAN
                        10.4.3.1 Rising emphasis on developing robotics to boost demand
             10.4.4 SOUTH KOREA
                        10.4.4.1 Growing R&D for IoT technologies to drive market growth
             10.4.5 REST OF ASIA PACIFIC
     10.5 LATIN AMERICA 
             TABLE 87 LATIN AMERICA: IOT TECHNOLOGY MARKET, BY COUNTRY, 2020–2023 (USD BILLION)
             TABLE 88 LATIN AMERICA: IOT TECHNOLOGY MARKET, BY COUNTRY, 2024–2029 (USD BILLION)
             TABLE 89 LATIN AMERICA: IOT TECHNOLOGY MARKET, BY NODE COMPONENT,  2020–2023 (USD BILLION)
             TABLE 90 LATIN AMERICA: IOT TECHNOLOGY MARKET, BY NODE COMPONENT,  2024–2029 (USD MILLION)
             TABLE 91 LATIN AMERICA: IOT TECHNOLOGY MARKET, BY SOFTWARE SOLUTION,  2020–2023 (USD BILLION)
             TABLE 92 LATIN AMERICA: IOT TECHNOLOGY MARKET, BY SOFTWARE SOLUTION,  2024–2029 (USD BILLION)
             TABLE 93 LATIN AMERICA: IOT TECHNOLOGY MARKET, BY PLATFORM, 2020–2023 (USD BILLION)
             TABLE 94 LATIN AMERICA: IOT TECHNOLOGY MARKET, BY PLATFORM, 2024–2029 (USD BILLION)
             TABLE 95 LATIN AMERICA: IOT TECHNOLOGY MARKET, BY SERVICE, 2020–2023 (USD BILLION)
             TABLE 96 LATIN AMERICA: IOT TECHNOLOGY MARKET, BY SERVICE, 2024–2029 (USD BILLION)
             10.5.1 MEXICO
                        10.5.1.1 Rising preference for new technologies in manufacturing sector to fuel market growth
             10.5.2 BRAZIL
                        10.5.2.1 Growing demand for smart home devices and wearables to drive market
             10.5.3 COLOMBIA
                        10.5.3.1 Growing focus on developing manufacturing, construction, and agriculture sectors to boost demand
             10.5.4 REST OF LATIN AMERICA
     10.6 ROW 
             10.6.1 RECESSION IMPACT ON IOT TECHNOLOGY MARKET IN ROW
                        TABLE 97 ROW: IOT TECHNOLOGY MARKET, BY COUNTRY, 2020–2023 (USD BILLION)
                        TABLE 98 ROW: IOT TECHNOLOGY MARKET, BY COUNTRY, 2024–2029 (USD BILLION)
                        TABLE 99 MIDDLE EAST: IOT TECHNOLOGY MARKET, BY COUNTRY, 2020–2023 (USD BILLION)
                        TABLE 100 MIDDLE EAST: IOT TECHNOLOGY MARKET, BY COUNTRY, 2024–2029 (USD BILLION)
                        TABLE 101 ROW: IOT TECHNOLOGY MARKET, BY NODE COMPONENT, 2020–2023 (USD BILLION)
                        TABLE 102 ROW: IOT TECHNOLOGY MARKET, BY NODE COMPONENT, 2024–2029 (USD MILLION)
                        TABLE 103 ROW: IOT TECHNOLOGY MARKET, BY SOFTWARE SOLUTION, 2020–2023 (USD BILLION)
                        TABLE 104 ROW: IOT TECHNOLOGY MARKET, BY SOFTWARE SOLUTION, 2024–2029 (USD BILLION)
                        TABLE 105 ROW: IOT TECHNOLOGY MARKET, BY PLATFORM, 2020–2023 (USD BILLION)
                        TABLE 106 ROW: IOT TECHNOLOGY MARKET, BY PLATFORM, 2024–2029 (USD BILLION)
                        TABLE 107 ROW: IOT TECHNOLOGY MARKET, BY SERVICE, 2020–2023 (USD BILLION)
                        TABLE 108 ROW: IOT TECHNOLOGY MARKET, BY SERVICE, 2024–2029 (USD BILLION)
             10.6.2 MIDDLE EAST
                        10.6.2.1 Increasing emphasis on developing IT infrastructure to drive market
                        10.6.2.2 GCC
                        10.6.2.3 Rest of Middle East
             10.6.3 AFRICA
                        10.6.3.1 Significant development in cellular technologies to drive market
 
11 COMPETITIVE LANDSCAPE (Page No. - 192)
     11.1 OVERVIEW 
     11.2 KEY PLAYER STRATEGIES/RIGHT TO WIN, 2020–2024 
             TABLE 109 KEY PLAYER STRATEGIES/RIGHT TO WIN, 2020–2024
     11.3 REVENUE ANALYSIS, 2019–2023 
             FIGURE 59 IOT TECHNOLOGY MARKET: REVENUE ANALYSIS OF TOP FIVE PLAYERS,  2019–2023
     11.4 MARKET SHARE ANALYSIS, 2023 
             FIGURE 60 IOT TECHNOLOGY MARKET SHARE ANALYSIS, 2023
             TABLE 110 IOT TECHNOLOGY MARKET: DEGREE OF COMPETITION, 2023
     11.5 COMPANY VALUATION AND FINANCIAL METRICS, 2024 
             FIGURE 61 IOT TECHNOLOGY MARKET: COMPANY VALUATION, 2024 (USD BILLION)
             FIGURE 62 IOT TECHNOLOGY MARKET: FINANCIAL METRICS (EV/EBITDA), 2022
     11.6 BRAND/PRODUCT COMPARISON 
             FIGURE 63 BRAND/PRODUCT COMPARISON
     11.7 COMPANY EVALUATION MATRIX: KEY PLAYERS, 2023 
             11.7.1 STARS
             11.7.2 EMERGING LEADERS
             11.7.3 PERVASIVE PLAYERS
             11.7.4 PARTICIPANTS
                        FIGURE 64 IOT TECHNOLOGY MARKET: COMPANY EVALUATION MATRIX  (KEY PLAYERS), 2023
             11.7.5 COMPANY FOOTPRINT: KEY PLAYERS, 2023
                        11.7.5.1 Company footprint
                                     FIGURE 65 IOT TECHNOLOGY MARKET: COMPANY FOOTPRINT
                        11.7.5.2 Node component footprint
                                     TABLE 111 IOT TECHNOLOGY MARKET: NODE COMPONENT FOOTPRINT
                        11.7.5.3 Software solution footprint
                                     TABLE 112 IOT TECHNOLOGY MARKET: SOFTWARE SOLUTION FOOTPRINT
                        11.7.5.4 Service footprint
                                     TABLE 113 IOT TECHNOLOGY MARKET: SERVICE FOOTPRINT
                        11.7.5.5 End-use application footprint
                                     TABLE 114 IOT TECHNOLOGY MARKET: END-USE APPLICATION FOOTPRINT
                        11.7.5.6 Region footprint
                                     TABLE 115 IOT TECHNOLOGY MARKET: REGION FOOTPRINT
     11.8 COMPANY EVALUATION MATRIX: STARTUPS/SMES, 2023 
             11.8.1 PROGRESSIVE COMPANIES
             11.8.2 RESPONSIVE COMPANIES
             11.8.3 DYNAMIC COMPANIES
             11.8.4 STARTING BLOCKS
                        FIGURE 66 IOT TECHNOLOGY MARKET: COMPANY EVALUATION MATRIX (STARTUPS/SMES), 2023
             11.8.5 COMPETITIVE BENCHMARKING: STARTUPS/SMES, 2023
                        11.8.5.1 List of key startups/SMEs
                                     TABLE 116 IOT TECHNOLOGY MARKET: LIST OF KEY STARTUPS/SMES
                        11.8.5.2 Competitive benchmarking of key startups/SMEs
                                     TABLE 117 IOT TECHNOLOGY MARKET: COMPETITIVE BENCHMARKING OF KEY STARTUPS/SMES
     11.9 COMPETITIVE SCENARIOS AND TRENDS 
             11.9.1 PRODUCT LAUNCHES
                        TABLE 118 IOT TECHNOLOGY MARKET: PRODUCT LAUNCHES, JANUARY 2022–JANUARY 2024
             11.9.2 DEALS
                        TABLE 119 IOT TECHNOLOGY MARKET: DEALS, JANUARY 2022–JANUARY 2024
             11.9.3 EXPANSIONS
                        TABLE 120 IOT TECHNOLOGY MARKET: EXPANSIONS, JANUARY 2022–JANUARY 2024
 
12 COMPANY PROFILES (Page No. - 217)
(Business Overview, Products Offered, Recent Developments, MnM View Right to win, Strategic choices made, Weaknesses and competitive threats) *  
     12.1 INTRODUCTION 
     12.2 KEY PLAYERS 
             12.2.1 INTEL CORPORATION
                        TABLE 121 INTEL CORPORATION: COMPANY OVERVIEW
                        FIGURE 67 INTEL CORPORATION: COMPANY SNAPSHOT
                        TABLE 122 INTEL CORPORATION: PRODUCTS/SOLUTIONS/SERVICES OFFERED
                        TABLE 123 INTEL CORPORATION: PRODUCT LAUNCHES
                        TABLE 124 INTEL CORPORATION: DEALS
             12.2.2 QUALCOMM TECHNOLOGIES, INC.
                        TABLE 125 QUALCOMM TECHNOLOGIES, INC.: COMPANY OVERVIEW
                        FIGURE 68 QUALCOMM TECHNOLOGIES, INC.: COMPANY SNAPSHOT
                        TABLE 126 QUALCOMM TECHNOLOGIES, INC.: PRODUCTS/SOLUTIONS/SERVICES OFFERED
                        TABLE 127 QUALCOMM TECHNOLOGIES, INC.: PRODUCT LAUNCHES
                        TABLE 128 QUALCOMM TECHNOLOGIES, INC.: DEALS
             12.2.3 TEXAS INSTRUMENTS INCORPORATED
                        TABLE 129 TEXAS INSTRUMENTS INCORPORATED: COMPANY OVERVIEW
                        FIGURE 69 TEXAS INSTRUMENTS INCORPORATED: COMPANY SNAPSHOT
                        TABLE 130 TEXAS INSTRUMENTS INCORPORATED: PRODUCTS/SOLUTIONS/SERVICES OFFERED
                        TABLE 131 TEXAS INSTRUMENTS: EXPANSIONS
             12.2.4 STMICROELECTRONICS
                        TABLE 132 STMICROELECTRONICS: COMPANY OVERVIEW
                        FIGURE 70 STMICROELECTRONICS: COMPANY SNAPSHOT
                        TABLE 133 STMICROELECTRONICS: PRODUCTS/SOLUTIONS/SERVICES OFFERED
                        TABLE 134 STMICROELECTRONICS: PRODUCT LAUNCHES
                        TABLE 135 STMICROELECTRONICS: DEALS
             12.2.5 IBM
                        TABLE 136 IBM: COMPANY OVERVIEW
                        FIGURE 71 IBM: COMPANY SNAPSHOT
                        TABLE 137 IBM: PRODUCTS/SOLUTIONS/SERVICES OFFERED
                        TABLE 138 IBM: PRODUCT LAUNCHES
                        TABLE 139 IBM: DEALS
             12.2.6 HEWLETT PACKARD ENTERPRISE DEVELOPMENT LP
                        TABLE 140 HEWLETT PACKARD ENTERPRISE DEVELOPMENT LP: COMPANY OVERVIEW
                        FIGURE 72 HEWLETT PACKARD ENTERPRISE DEVELOPMENT LP: COMPANY SNAPSHOT
                        TABLE 141 HEWLETT PACKARD ENTERPRISE DEVELOPMENT LP: PRODUCTS/SOLUTIONS/SERVICES OFFERED
                        TABLE 142 HEWLETT PACKARD ENTERPRISE DEVELOPMENT LP: DEALS
                        TABLE 143 HEWLETT PACKARD ENTERPRISE DEVELOPMENT LP: EXPANSIONS
             12.2.7 CISCO SYSTEMS, INC.
                        TABLE 144 CISCO SYSTEMS, INC.: COMPANY OVERVIEW
                        FIGURE 73 CISCO SYSTEMS, INC.: COMPANY SNAPSHOT
                        TABLE 145 CISCO SYSTEMS, INC.: PRODUCTS/SOLUTIONS/SERVICES OFFERED
                        TABLE 146 CISCO SYSTEMS, INC.: PRODUCT LAUNCHES
                        TABLE 147 CISCO SYSTEMS, INC.: DEALS
             12.2.8 MICROSOFT
                        TABLE 148 MICROSOFT: COMPANY OVERVIEW
                        FIGURE 74 MICROSOFT: COMPANY SNAPSHOT
                        TABLE 149 MICROSOFT: PRODUCTS/SOLUTIONS/SERVICES OFFERED
                        TABLE 150 MICROSOFT: DEALS
             12.2.9 PTC
                        TABLE 151 PTC: COMPANY OVERVIEW
                        FIGURE 75 PTC: COMPANY SNAPSHOT
                        TABLE 152 PTC: PRODUCTS/SOLUTIONS/SERVICES OFFERED
                        TABLE 153 PTC: PRODUCT LAUNCHES
                        TABLE 154 PTC: DEALS
             12.2.10 AMAZON WEB SERVICES, INC.
                        TABLE 155 AMAZON WEB SERVICES, INC.: COMPANY OVERVIEW
                        FIGURE 76 AMAZON WEB SERVICES, INC.: COMPANY SNAPSHOT
                        TABLE 156 AMAZON WEB SERVICES, INC.: PRODUCTS/SOLUTIONS/SERVICES OFFERED
                        TABLE 157 AMAZON WEB SERVICES, INC.: PRODUCT LAUNCHES
                        TABLE 158 AMAZON WEB SERVICES, INC.: DEALS
     12.3 OTHER PLAYERS 
             12.3.1 GENERAL ELECTRIC COMPANY
             12.3.2 SOFTEQ DEVELOPMENT CORP.
             12.3.3 SCIENCESOFT USA CORPORATION
             12.3.4 ORACLE
             12.3.5 SIEMENS
             12.3.6 SAP SE
             12.3.7 ROBERT BOSCH GMBH
             12.3.8 HUAWEI TECHNOLOGIES CO., LTD.
             12.3.9 SCHNEIDER ELECTRIC
             12.3.10 ARM LIMITED
             12.3.11 NXP SEMICONDUCTORS
             12.3.12 TE CONNECTIVITY
             12.3.13 SOFTWARE AG
             12.3.14 MICROCHIP TECHNOLOGY INC.
             12.3.15 VATES
             12.3.16 CELLHIRE PLC
             12.3.17 CLEARBLADE
             12.3.18 SOLULAB
             12.3.19 KONSTANT INFOSOLUTIONS
             12.3.20 BINARIKS INC.
*Details on Business Overview, Products Offered, Recent Developments, MnM View, Right to win, Strategic choices made, Weaknesses and competitive threats might not be captured in case of unlisted companies.  
 
13 APPENDIX (Page No. - 293)
     13.1 DISCUSSION GUIDE 
     13.2 KNOWLEDGESTORE: MARKETSANDMARKETS’  SUBSCRIPTION PORTAL 
     13.3 CUSTOMIZATION OPTIONS 
     13.4 RELATED REPORTS 
     13.5 AUTHOR DETAILS 


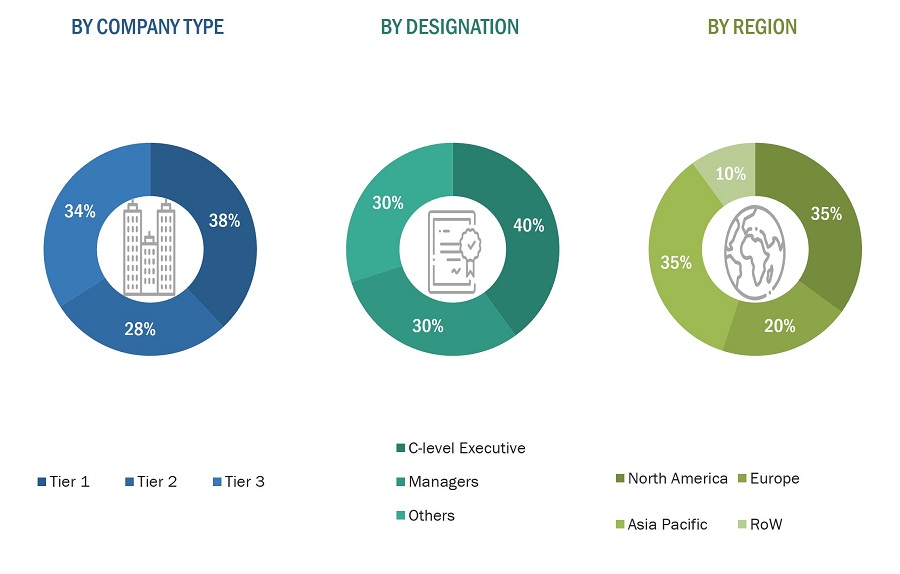
The research process for this study included systematic gathering, recording, and analysis of data about customers and companies operating in the IoT technology market. This process involved the extensive use of secondary sources, directories, and databases (Factiva, Oanda, and OneSource) for identifying and collecting valuable information for the comprehensive, technical, market-oriented, and commercial study of the IoT technology market. In-depth interviews were conducted with primary respondents, including experts from core and related industries and preferred manufacturers, to obtain and verify critical qualitative and quantitative information as well as to assess growth prospects. Key players in the IoT technology market were identified through secondary research, and their market rankings were determined through primary and secondary research. This research included studying annual reports of top players and interviewing key industry experts such as CEOs, directors, and marketing executives.

Secondary Research

In the secondary research process, various secondary sources were referred to for identifying and collecting information important for this study. Secondary sources included corporate filings, such as annual reports, investor presentations, and financial statements; trade, business, and professional associations; white papers; IoT technology products-related journals; certified publications; articles by recognized authors; directories; and databases.

Secondary research was conducted to obtain key information about the industry supply chain, market value chain, key players, market classification and segmentation as per industry trends to the bottom-most level, geographic markets, and key developments from both market- and technology-oriented perspectives. Data from secondary research was collected and analyzed to determine the overall market size, which was further validated by primary research.

Primary Research

In the primary research process, various primary sources from the supply and demand sides were interviewed to obtain qualitative and quantitative information for this report. Primary sources from the supply side included industry experts such as CEOs, VPs, marketing directors, technology & innovation directors, and key executives from major companies in the IoT technology market.

After going through market engineering (which includes calculations for market statistics, market breakdown, market size estimations, market forecasting, and data triangulation), extensive primary research was conducted to gather information and verify and validate the critical numbers obtained. Primary research was conducted to identify segmentation types, industry trends, key players, competitive landscape, and key market dynamics such as drivers, restraints, opportunities, and challenges, along with the key strategies adopted by players operating in the market.
IoT Technology Market
 Size, and Share

To know about the assumptions considered for the study, download the pdf brochure

Market size Estimation

In the complete market engineering process, both top-down and bottom-up approaches were used, along with several data triangulation methods, to estimate and forecast the size of the market and its segments and subsegments listed in the report. Extensive qualitative and quantitative analyses were carried out on the complete market engineering process to list the key information/insights pertaining to the IoT technology market.

The key players in the market were identified through secondary research, and their rankings in the respective regions were determined through primary and secondary research. This entire procedure involved the study of the annual and financial reports of top players, as well as interviews with industry experts such as chief executive officers, vice presidents, directors, and marketing executives for quantitative and qualitative key insights. All percentage shares, splits, and breakdowns were determined using secondary sources and verified through primary sources. All parameters that affect the markets covered in this research study were accounted for, viewed in extensive detail, verified through primary research, and analyzed to obtain the final quantitative and qualitative data. This data was consolidated and enhanced with detailed inputs and analysis from MarketsandMarkets and presented in this report.

IoT Technology Market: Bottom-up Approach

IoT Technology Market
 Size, and Bottom-up Approach

IoT Technology Market: Top-Down Approach

IoT Technology Market
 Size, and Top-Down  Approach

Data Triangulation

After arriving at the overall size of the IoT technology market from the market size estimation process explained above, the total market was split into several segments and subsegments. Where applicable, the market breakdown and data triangulation procedures were employed to complete the overall market engineering process and arrive at the exact statistics for all segments and subsegments. The data was triangulated by studying various factors and trends from both the demand and supply sides. Along with this, the market size was validated using top-down and bottom-up approaches.

Market Definition

IoT is a key digital transformation technology, enabling businesses to increase their operational efficiency. Other technologies, such as edge computing, digital twin, Wi-Fi, and big data analytics, are spurring the demand for the digital transformation of businesses. Various application areas, such as retail, manufacturing, transportation, and healthcare, are undergoing digital transformation. Hence, the growing demand for IoT-based digital transformation of businesses is expected to provide growth opportunities for the IoT technology market during the forecast period.

Key Stakeholders

  • Original technology designers and suppliers
  • System integrators
  • Electronic hardware equipment manufacturers
  • Technical universities
  • Government research agencies and private research organizations
  • Research institutes and organizations
  • Market research and consulting firms
  • Sensor manufacturers
  • Technology standard organizations, forums, alliances, and associations
  • Raw material and manufacturing equipment suppliers
  • Semiconductor wafer vendors
  • Fabless players
  • EDA and IP core vendors
  • Foundry players
  • Original equipment manufacturers (OEMs)
  • Original design manufacturers (ODM) and OEM technology solution providers
  • Distributors and retailers
  • Technology investors
  • Operating system (OS) vendors
  • Content providers
  • Software providers

Report Objectives

  • To define and forecast the IoT technology market size, by node component, software solution, platform, service, and end-use application, in terms of value.
  • To describe and forecast the global IoT technology market, by node components, in terms of volume.
  • To describe and forecast the market size for various segments with regard to four main regions—North America, Latin America, Europe, Asia Pacific, and the Rest of the World (RoW), in terms of value.
  • To provide detailed information regarding major factors, such as drivers, restraints, opportunities, and challenges influencing the market growth
  • To analyze the supply chain, trends/disruptions impacting customer business, market/ecosystem map, pricing analysis, and regulatory landscape pertaining to the IoT technology market.
  • To analyze opportunities in the market for stakeholders by identifying the high-growth segments of the market
  • To describe in brief the value chain of IoT technology solutions.
  • To strategically analyze micromarkets1 with respect to individual growth trends, prospects, and contributions to the overall market
  • To profile key players and comprehensively analyze their market position in terms of their ranking and core competencies2, along with the detailed competitive landscape of the market.
  • To analyze competitive developments, such as product launches and developments, partnerships, agreements, expansions, acquisitions, contracts, alliances, and research & development (R&D), undertaken in the IoT technology market.
  • To benchmark market players using the proprietary ‘Company Evaluation Matrix,’ which analyzes market players on various parameters within the broad categories of business strategy excellence and strength of product portfolio.
  • To analyze the probable impact of the recession on the market.

Available customizations

With the given market data, MarketsandMarkets offers customizations according to the specific requirements of companies.

Product analysis

  • Detailed analysis and profiling of additional market players

The following customization options are available for the report:

  • Market sizing and forecast for additional countries
  • Additional five companies profiling
Custom Market Research Services

We will customize the research for you, in case the report listed above does not meet with your exact requirements. Our custom research will comprehensively cover the business information you require to help you arrive at strategic and profitable business decisions.

Request Customization

Instant Answers with GPT - Ask Now!

Ask real questions. Get complete answers !
Report Code
SE 2509
Published ON
Apr, 2024
Choose License Type
BUY NOW
  • SHARE
X
Request Customization
Speak to Analyst
Speak to Analyst
OR FACE-TO-FACE MEETING
PERSONALIZE THIS RESEARCH
  • Triangulate with your Own Data
  • Get Data as per your Format and Definition
  • Gain a Deeper Dive on a Specific Application, Geography, Customer or Competitor
  • Any level of Personalization
REQUEST A FREE CUSTOMIZATION
LET US HELP YOU!
  • What are the Known and Unknown Adjacencies Impacting the IoT Technology Market
  • What will your New Revenue Sources be?
  • Who will be your Top Customer; what will make them switch?
  • Defend your Market Share or Win Competitors
  • Get a Scorecard for Target Partners
CUSTOMIZED WORKSHOP REQUEST
+1-888-600-6441
  • Call Us
  • +1-888-600-6441 (Corporate office hours)
  • +1-888-600-6441 (US/Can toll free)
  • +44-800-368-9399 (UK office hours)
CONNECT WITH US
ABOUT TRUST ONLINE
©2024 MarketsandMarkets Research Private Ltd. All rights reserved
DMCA.com Protection Status Website Feedback