ESG Reporting Software Market

ESG Reporting Software Market by Offering (Software and Services), Deployment Type (On-premises and Cloud), Organization Size (Large Enterprises and SMEs), Vertical (BFSI and Government, Public Sector, and Non-profit), & Region - Global Forecast to 2029

Report Code: TC 8523 May, 2024, by marketsandmarkets.com

[258 Pages Report] The ESG reporting software market is expected to grow from USD 0.9 billion in 2024 to USD 2.1 billion by 2029 at a Compound Annual Growth Rate (CAGR) of 17.0% during the forecast period. ESG reporting software has become essential for organizations that effectively manage and report their sustainability and ethical practices. This software enables companies to collect, analyze, and report data on their environmental impact, social responsibilities, and governance policies. The growing emphasis on ESG factors is driven by increased regulatory requirements, investor and stakeholder demand for transparency, and the need for companies to demonstrate their commitment to sustainability. The market for ESG reporting software is expanding rapidly across various sectors, including finance, manufacturing, retail, energy, and technology. These sectors adopt ESG reporting software to enhance operational efficiency, comply with regulatory requirements, and improve sustainability initiatives. The software integrates comprehensive sustainability metrics, advanced data analytics, and real-time reporting capabilities, offering a holistic view of a company's ESG performance.

Key drivers for adopting ESG reporting software include rising regulatory requirements, which mandate more detailed and frequent sustainability reporting; growing investor and stakeholder demand for transparency and accountability; and the increasing importance of sustainability in corporate strategies. These factors compel organizations to adopt sophisticated tools to manage and report their ESG activities accurately and efficiently. ESG reporting software solutions provide end-to-end management of ESG data, including data collection, performance tracking, compliance reporting, and stakeholder engagement. These solutions often include data integration, analytics, and reporting platforms supported by APIs, SDKs, and other connected technologies. Using cloud-based solutions and advanced analytics is pivotal in reshaping traditional ESG reporting practices, offering enhanced data accessibility, real-time reporting, scalability, and improved collaboration across departments.

The adoption of ESG reporting software is also driven by technological advancements, such as integrating IoT sensors and real-time data feeds, which enable organizations to monitor their ESG performance continuously. These technologies provide accurate and timely data, helping companies identify areas for improvement and take proactive measures to enhance their sustainability practices. Moreover, the increasing emphasis on sustainability and energy efficiency has prompted organizations to adopt ESG reporting software to demonstrate their commitment to environmental stewardship. Companies are leveraging these solutions to reduce their carbon footprint, improve resource management, and enhance their overall sustainability performance.

In conclusion, ESG reporting software is crucial for organizations aiming to meet regulatory requirements, satisfy investor and stakeholder expectations, and integrate sustainability into their core business strategies. The market for these solutions is growing, driven by the need for transparency, regulatory compliance, and the increasing importance of sustainability in the corporate world.
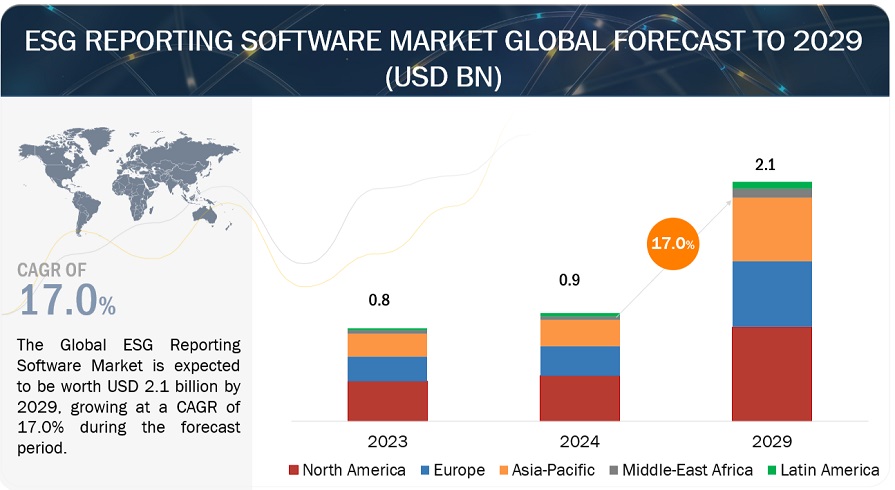
ESG Reporting Software Market

To know about the assumptions considered for the study, Request for Free Sample Report
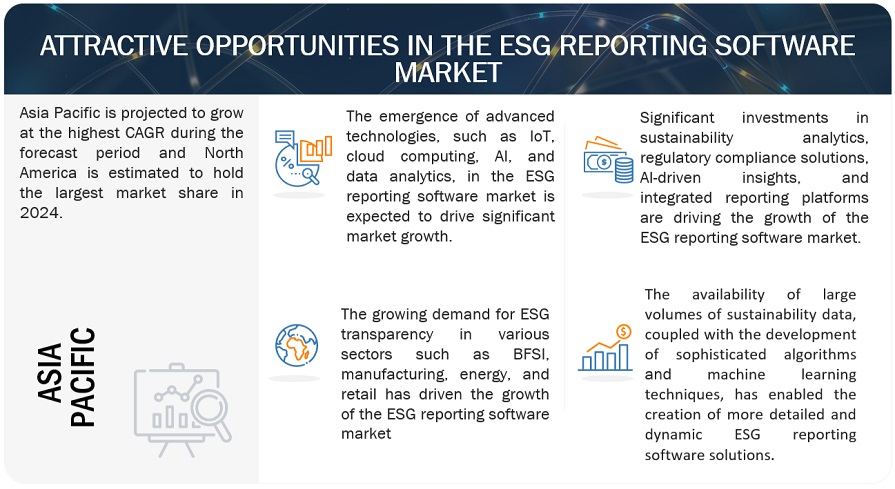
ESG Reporting Software Market Opportunities

To know about the assumptions considered for the study, download the pdf brochure

Recession Impact on the ESG Reporting Software Market

The recession has notably influenced the global ESG reporting software market by intensifying the focus on cost efficiency and return on investment. Companies facing economic uncertainties are scrutinizing their expenditures more rigorously, which can initially slow the adoption of ESG software. Organizations might delay or scale back on ESG initiatives perceived as non-essential, prioritizing immediate financial stability over long-term sustainability goals. However, for ESG reporting software vendors, this period has highlighted the necessity of demonstrating clear, tangible benefits, such as cost savings through resource optimization and risk management, to justify their solutions.

ESG Reporting Software Market Dynamics

Driver:  Growing demand for ESG reporting software to navigate and mitigate ESG risks

Effective ESG reporting software is instrumental in helping companies navigate and mitigate ESG risks, which are increasingly critical in today's business environment. This software enables organizations to identify and monitor various ESG risks, such as climate change impacts, supply chain disruptions, labor practices, and regulatory compliance, by providing robust data analytics and reporting capabilities. Companies can prioritize and address the most significant ESG risks through comprehensive risk assessments, enhancing resilience and sustainability.

Moreover, ESG reporting software facilitates proactive risk management strategies by allowing companies to set thresholds, benchmarks, and targets related to ESG performance metrics. Real-time monitoring and alerts help organizations quickly respond to emerging risks and take corrective actions to mitigate potential impacts. This proactive approach reduces operational and reputational risks and improves long-term business continuity and stakeholder trust.

Restraint: Regulatory uncertainty hindering the adoption and expansion of ESG reporting software

Regulatory uncertainty poses a significant challenge for adopting and expanding ESG reporting solutions across industries. The evolving landscape of ESG regulations introduces complexities and ambiguities that companies must navigate. This uncertainty stems from varying regulatory requirements across different regions and jurisdictions and frequent updates and revisions to existing standards. For businesses, regulatory uncertainty translates into difficulty in setting clear ESG goals and strategies and determining the appropriate metrics and methodologies for reporting. Moreover, compliance with these regulations requires substantial resources, including investments in ESG reporting software, data collection processes, and staff training. The lack of standardized frameworks and guidelines further complicates efforts to achieve consistency and comparability in ESG reporting practices.

Opportunity: Enhancing sustainability  through integration with enterprise systems integration

Integrating ESG reporting software with enterprise systems would enable seamless incorporation of ESG data into broader organizational operations. ESG reporting software can integrate with various enterprise systems, such as ERP, CRM, and HCM  platforms, to consolidate data and streamline reporting processes. This integration enhances data accuracy, reduces duplication of efforts, and facilitates real-time reporting, enabling organizations to make informed decisions based on comprehensive ESG insights. Moreover, integrating ESG reporting software with enterprise systems allows companies to align ESG goals with overall business strategies. By combining financial and operational data with ESG metrics, organizations can gain a holistic view of their sustainability performance and identify opportunities for improvement.

Challenge: Rising pressure on corporate boards and government leaders to enhance ESG skills

The rise in the broadened scope of corporate board responsibilities also requires sincere focus and timeline commitment from board members to meet their legal duties. Pressure on boards to shape their ESG credentials is set to grow as investors demand better accountability from the topmost hierarchical focus on sustainability. Efforts to diversify boards and create policies that refer to meaningful diversity, equity, and inclusion will continue to evolve from a mere pen-and-paper approach into a holistic appreciation of how differences in identities, expertise, and leadership styles can drive growth and innovation. Therefore, there is substantial pressure on corporate boards to strengthen their ESG skills and integrate sustainability into their policy and planning strategies. Specifically, they will need to add adaptation and resilience methodologies to their investment plans amidst the growing economic impact of climate change.

ESG Reporting Software Market Ecosystem
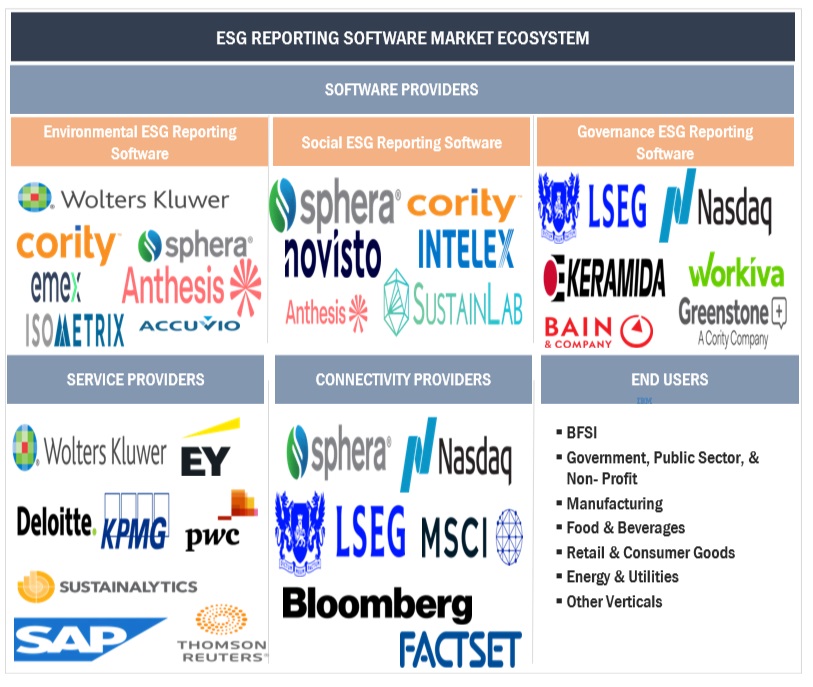
Top Companies in ESG Reporting Software Market

Based on software type, the environmental ESG reporting software segment will grow to the largest market share during the forecast period.

Environmental ESG reporting software is a specialized tool designed to help organizations track, manage, and report their environmental performance as part of their broader ESG reporting efforts.

This software enables companies to collect, analyze, and report data on various environmental metrics such as carbon emissions, energy consumption, water usage, waste generation, and air and water quality. It streamlines the data collection by allowing organizations to gather information from multiple sources, including internal systems, third-party providers, and manual inputs. Environmental ESG reporting software includes features such as data validation and normalization to ensure the accuracy and consistency of the collected data. Additionally, it helps organizations calculate critical environmental performance indicators (KPIs) and generate comprehensive reports that comply with industry standards and regulatory requirements. This software enables companies to communicate their environmental performance effectively to internal and external stakeholders, including investors, customers, regulators, and the general public, by providing customizable dashboards, reporting templates, and data visualization tools. Overall, environmental ESG reporting software plays a crucial role in helping organizations monitor and manage their environmental impact, identify areas for improvement, and demonstrate their commitment to sustainability and corporate responsibility.

By vertical, the government, public, & non-profit segments will hold the second-largest market size during the forecast period.

Given the emphasis on global emissions reporting, one popular approach has been to treat a government's ESG exposures the same as a country's national aggregate emissions. Governments can help with the management and transition costs of ESG risks and exert significant influence over outcomes through their policy and regulatory functions. Still, initial measurement and attribution of ESG risks appear to be best captured by assigning them to each sector. Because the objectives of the public sector are linked to public interest and benefit, public bodies have strong incentives to be more transparent about their impact. Climate change has sparked unprecedented public interest, and sustainability reports enable governments to demonstrate their progress in reducing emissions. The public sector is the most significant economic sector in most countries, significantly impacting the environment. It serves two functions: essential services such as the armed forces, healthcare, public transportation, and waste collection, all contributing to climate change. However, it is also a regulator and standard setter, proposing an environmental regulatory framework. This reality implies that the public sector, not just private sector companies, will be essential in achieving net zero goals.

As per region, North America will witness the largest market share during the forecast period.

In North America, ESG reporting software is crucial in helping companies track, manage, and report their sustainability initiatives and performance. With the increasing focus on corporate social responsibility and sustainable business practices, the region has a growing demand for ESG reporting software. These software solutions provide companies with the tools to collect, analyze, and report data on their environmental impact, social initiatives, and corporate governance practices.

North America's ESG reporting software market is experiencing significant growth, driven by several factors, including regulatory requirements, investor pressure, and stakeholder expectations. Many companies recognize the importance of ESG reporting for compliance and maintaining a positive reputation, attracting investors, and mitigating risks. As a result, there is a rising adoption of ESG reporting software across various industries in the region. The market is becoming increasingly competitive, with established software providers and new entrants vying for market share by offering innovative features, user-friendly interfaces, and customizable solutions to meet the diverse needs of companies seeking to enhance their ESG performance and reporting capabilities.
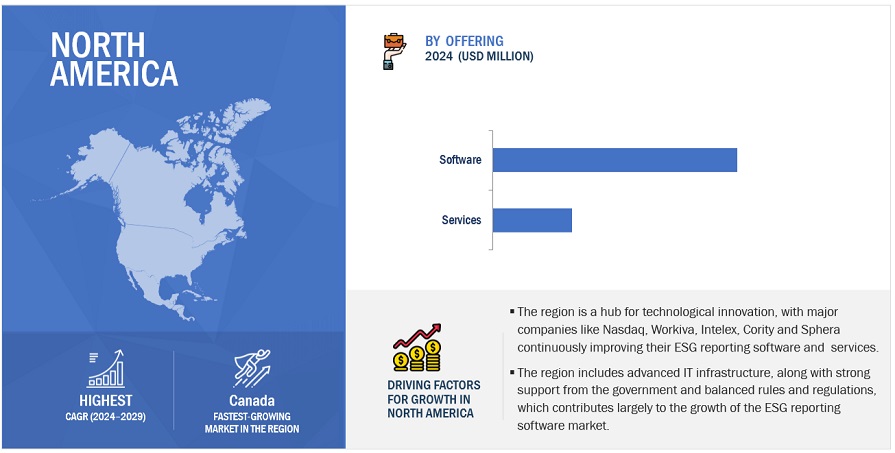
North American ESG Reporting Software Market Size, and Share

Key Market Players

The ESG reporting software market is dominated by a few globally established players such as Wolters Kluwer (Netherlands), Nasdaq (US), PWC (UK), Workiva (US), LSEG(UK), Greenstone (UK), Diligent (US), Sphera (US), Cority (Canada),  and Intelex (Canada), among others, are the key vendors that secured ESG reporting software market contracts in last few years. These vendors can bring global processes and execution expertise; the local players only have limited expertise. Adopting cloud-based solutions and advanced analytics in the thriving ESG reporting software market is pivotal in reshaping traditional reporting practices. Companies leveraging these technologies capitalize on several advantages: enhanced data accessibility, real-time reporting, scalability, and improved collaboration across departments.

Get online access to the report on the World's First Market Intelligence Cloud

  • Easy to Download Historical Data & Forecast Numbers
  • Company Analysis Dashboard for high growth potential opportunities
  • Research Analyst Access for customization & queries
  • Competitor Analysis with Interactive dashboard
  • Latest News, Updates & Trend analysis
Request Sample

Scope of the Report

Report Metrics

Details

Market Size Available For Years

2019–2029

Base Year Considered

2023

Forecast Period

2024–2029

Forecast Units

Value (USD Million/Billion)

Segments Covered

Offering, Deployment Type, Organization Size, and Vertical

Regions Covered

North America, Europe, Asia Pacific, Middle East & Africa, and Latin America

Companies Covered

Wolters Kluwer (Netherlands), Nasdaq(US), PWC(UK), Workiva(US), LSEG(UK), Greenstone(UK), Diligent(US), Sphera(US), Cority(Canada), Intelex(Canada), Novisto(Canada), Emex(Ireland), IBM(US), Anthesis(UK), Diginex(Hong Kong), Bain & Company(US), Keramida(US), Isometrix(US), Vervantis(US), Accuvio(Ireland), ESG Flo(US), Measurabl(US), Plan A(Germany), SustainLab(Sweden), and ESG Go(US)

This research report categorizes the ESG reporting software market to forecast revenue and analyze trends in each of the following submarkets:

By Offering:
  • Software
    • Environmental ESG Reporting Software
    • Social ESG Reporting Software
    • Governance ESG Reporting Software
  • Services
    • Consulting
    • Integration & Deployment
    • Support & Maintenance

By Deployment Type:

  • On-Premises
  • Cloud

By Organization Size:

  • SMEs
  • Large Enterprises

By Vertical:

  • BFSI
  • Government, Public Sector, & Non-Profit
  • Manufacturing
  • Food & Beverages
  • Retail & Consumer Goods
  • Energy & Utilities
  • Other Verticals

By Region:

  • North America
    • United States
    • Canada
  • Europe
    • United Kingdom
    • Germany
    • Italy
    • Rest of Europe
  • Asia Pacific
    • China
    • Japan
    • Rest of Asia Pacific
  • Middle East & Africa
    • GCC
    • South Africa
    • Rest of the Middle East & Africa
  • Latin America
    • Brazil
    • Rest of Latin America

Recent Developments:

  • Carbon accounting firm Minimum has expanded its operations to the United States and partnered with Nasdaq to enhance its sustainability reporting tools. This partnership aims to provide Nasdaq's ESG Advisory clients with comprehensive visibility into their carbon footprints and assist them in navigating industry and regulatory changes. Minimum's enterprise Carbon Accounting Software offers fully customizable and auditable data infrastructure, enabling businesses to surface, interpret, and disclose their emissions data seamlessly.
  • LSEG, in partnership with ESG.AI, launched a new next-generation ESG analytics platform aimed at major companies, banks, asset managers, and consultants. The platform combines LSEG's extensive financial markets dataset with ESG.AI's technology to provide real-time ESG data, up-to-the-minute ESG scores, and visualization and performance optimization tools.
  • PwC and Blackstone collaborated to provide clients access to Sphera's ESG software solutions. This partnership aims to support organizations implementing transparent and auditable ESG reporting, addressing evolving regulatory requirements, and managing ESG risks effectively.

Frequently Asked Questions (FAQ):

To speak to our analyst for a discussion on the above findings, click Speak to Analyst

TABLE OF CONTENTS
 
1 INTRODUCTION (Page No. - 26)
    1.1 STUDY OBJECTIVES 
    1.2 MARKET DEFINITION 
           1.2.1 INCLUSIONS AND EXCLUSIONS
    1.3 STUDY SCOPE 
           1.3.1 MARKET SEGMENTATION
           1.3.2 REGIONS COVERED
    1.4 YEARS CONSIDERED 
    1.5 CURRENCY CONSIDERED 
           TABLE 1 USD EXCHANGE RATES, 2019–2023
    1.6 STAKEHOLDERS 
    1.7 SUMMARY OF CHANGES 
           1.7.1 RECESSION IMPACT
 
2 RESEARCH METHODOLOGY (Page No. - 32)
    2.1 RESEARCH DATA 
           FIGURE 1 ESG REPORTING SOFTWARE MARKET: RESEARCH DESIGN
           2.1.1 SECONDARY DATA
           2.1.2 PRIMARY DATA
                    2.1.2.1 Breakup of primary interviews
                    2.1.2.2 Key insights from industry experts
    2.2 DATA TRIANGULATION 
           FIGURE 2 ESG REPORTING SOFTWARE MARKET: DATA TRIANGULATION
    2.3 MARKET SIZE ESTIMATION 
           FIGURE 3 ESG REPORTING SOFTWARE MARKET: TOP-DOWN AND BOTTOM-UP APPROACHES
           2.3.1 TOP-DOWN APPROACH
                    FIGURE 4 MARKET SIZE ESTIMATION METHODOLOGY: TOP-DOWN APPROACH
           2.3.2 BOTTOM-UP APPROACH
                    FIGURE 5 MARKET SIZE ESTIMATION METHODOLOGY: BOTTOM-UP APPROACH
                    FIGURE 6 ESG REPORTING SOFTWARE MARKET: RESEARCH FLOW
           2.3.3 MARKET ESTIMATION APPROACHES
                    FIGURE 7 MARKET SIZE ESTIMATION METHODOLOGY: SUPPLY-SIDE ANALYSIS
                    FIGURE 8 MARKET SIZE ESTIMATION METHODOLOGY: BOTTOM-UP APPROACH FROM SUPPLY SIDE - COLLECTIVE REVENUE OF VENDORS
                    FIGURE 9 BOTTOM-UP APPROACH FROM SUPPLY SIDE: COLLECTIVE REVENUE OF VENDORS
                    FIGURE 10 DEMAND-SIDE APPROACH: ESG REPORTING SOFTWARE MARKET
    2.4 MARKET FORECAST 
           TABLE 2 FACTOR ANALYSIS
    2.5 RECESSION IMPACT ON ESG REPORTING SOFTWARE MARKET 
    2.6 RESEARCH ASSUMPTIONS 
    2.7 LIMITATIONS AND RISK ASSESSMENT 
 
3 EXECUTIVE SUMMARY (Page No. - 47)
    FIGURE 11 ESG REPORTING SOFTWARE MANAGEMENT MARKET SNAPSHOT, 2021–2029 
    FIGURE 12 TOP MARKET SEGMENTS IN TERMS OF GROWTH RATE 
    FIGURE 13 NORTH AMERICA TO ACCOUNT FOR LARGEST SHARE DURING FORECAST PERIOD 
 
4 PREMIUM INSIGHTS (Page No. - 51)
    4.1 ATTRACTIVE GROWTH OPPORTUNITIES FOR PLAYERS IN ESG REPORTING SOFTWARE MARKET 
           FIGURE 14 RISING REGULATORY PRESSURES ACROSS VERTICALS AND INVESTOR DEMAND TO PROPEL ESG REPORTING SOFTWARE MARKET GROWTH
    4.2 ESG REPORTING SOFTWARE MARKET, BY OFFERING, 2024 VS. 2029 
           FIGURE 15 SOFTWARE SEGMENT TO ACCOUNT FOR LARGER MARKET SHARE DURING FORECAST PERIOD
    4.3 ESG REPORTING SOFTWARE MARKET, BY SOFTWARE TYPE, 2024 VS. 2029 
           FIGURE 16 ENVIRONMENTAL ESG REPORTING SOFTWARE SEGMENT TO ACCOUNT FOR LARGEST MARKET SHARE IN 2029
    4.4 ESG REPORTING SOFTWARE MARKET, BY DEPLOYMENT TYPE, 2024 VS. 2029 
           FIGURE 17 ON-PREMISES SEGMENT TO ACCOUNT FOR LARGER MARKET SHARE DURING FORECAST PERIOD
    4.5 ESG REPORTING SOFTWARE MARKET, BY ORGANIZATION SIZE, 2024 VS. 2029 
           FIGURE 18 LARGE ENTERPRISES SEGMENT TO ACCOUNT FOR LARGER MARKET SHARE DURING FORECAST PERIOD
    4.6 ESG REPORTING SOFTWARE MARKET, BY VERTICAL, 2024 VS. 2029 
           FIGURE 19 BFSI SEGMENT TO ACCOUNT FOR LARGEST MARKET SHARE DURING FORECAST PERIOD
    4.7 ESG REPORTING SOFTWARE MARKET, BY REGION, 2024 VS. 2029 
           FIGURE 20 ASIA PACIFIC TO EMERGE AS BEST MARKET FOR INVESTMENTS IN NEXT FIVE YEARS
 
5 MARKET OVERVIEW AND INDUSTRY TRENDS (Page No. - 55)
    5.1 INTRODUCTION 
    5.2 MARKET DYNAMICS 
           FIGURE 21 ESG REPORTING SOFTWARE MARKET: DRIVERS, RESTRAINTS, OPPORTUNITIES, AND CHALLENGES
           5.2.1 DRIVERS
                    5.2.1.1 Consistent growth in corporate data volume
                    5.2.1.2 Proliferation in growth of credible corporate disclosures
                    5.2.1.3 Emphasis on automated data collection, reporting, and reduced manual efforts
                    5.2.1.4 Growing demand for navigating and mitigating ESG risks
           5.2.2 RESTRAINTS
                    5.2.2.1 Huge initial capital expenditure
                    5.2.2.2 Regulatory uncertainty hindering adoption and expansion of ESG reporting software
           5.2.3 OPPORTUNITIES
                    5.2.3.1 Climate testing to gain traction among financial service organizations
                    5.2.3.2 Assessment of natural capital and biodiversity risks to grow significantly
                    5.2.3.3 Enhancing sustainability through integration with enterprise systems
           5.2.4 CHALLENGES
                    5.2.4.1 Inadequate management practices and lack of skilled workforce
                    5.2.4.2 Rising pressure on corporate boards and government leaders to enhance ESG skills
    5.3 CASE STUDY ANALYSIS 
           5.3.1 MOSAIC COMPANY REDUCED EMISSIONS AND ADAPTED TO CHANGING REGULATORY ENVIRONMENTS WITH PWC
           5.3.2 SOUTHWEST AIRLINES STREAMLINED INTERNAL AND EXTERNAL REPORTING BY DEPLOYING WORKIVA’S SOLUTIONS
           5.3.3 DAVINES GROUP IMPROVED DATA ACCURACY AND REPORTING WITH GREENSTONE’S ESG SOFTWARE
           5.3.4 MELBOURNE WATER STREAMLINED SUSTAINABILITY REPORTING TO CREATE SINGLE SYSTEM OF RECORD FOR ENERGY USE AND ESG PERFORMANCE WITH IBM’S ENVIZI SUITE
           5.3.5 NORTHROP GRUMMAN MAXIMIZED EFFICIENCY WITH IMPROVED DATA MANAGEMENT BY DEPLOYING SPHERA’S SOLUTION
    5.4 ECOSYSTEM ANALYSIS 
           TABLE 1 ESG REPORTING SOFTWARE MARKET: ECOSYSTEM
           FIGURE 22 KEY PLAYERS IN ESG REPORTING SOFTWARE MARKET ECOSYSTEM
    5.5 VALUE CHAIN ANALYSIS 
           FIGURE 23 ESG REPORTING SOFTWARE MARKET: VALUE CHAIN ANALYSIS
    5.6 PRICING ANALYSIS 
           5.6.1 AVERAGE SELLING PRICE TREND OF KEY PLAYERS, BY SOFTWARE
                    TABLE 2 INDICATIVE PRICING ANALYSIS OF ESG REPORTING SOFTWARE MARKET, BY SOFTWARE
           5.6.2 AVERAGE SELLING PRICE TREND OF KEY PLAYERS, BY ORGANIZATION SIZE
    5.7 PATENT ANALYSIS 
           FIGURE 24 NUMBER OF PATENTS PUBLISHED, 2013–2023
           FIGURE 25 NUMBER OF PATENTS GRANTED FOR ESG REPORTING SOFTWARE MARKET (GLOBAL) IN 2023
           TABLE 3 TOP 10 PATENT OWNERS IN LAST 10 YEARS
    5.8 TECHNOLOGY ANALYSIS 
           5.8.1 KEY TECHNOLOGIES
                    5.8.1.1 Cloud computing
                    5.8.1.2 Data analytics and business intelligence tools
           5.8.2 COMPLEMENTARY TECHNOLOGIES
                    5.8.2.1 IoT
                    5.8.2.2 Cybersecurity
           5.8.3 ADJACENT TECHNOLOGIES
                    5.8.3.1 AI/ML
                    5.8.3.2 Blockchain
    5.9 REGULATORY LANDSCAPE 
           5.9.1 REGULATORY BODIES, GOVERNMENT AGENCIES, AND OTHER ORGANIZATIONS
                    TABLE 4 NORTH AMERICA: LIST OF REGULATORY BODIES, GOVERNMENT AGENCIES, AND OTHER ORGANIZATIONS
                    TABLE 5 EUROPE: LIST OF REGULATORY BODIES, GOVERNMENT AGENCIES, AND OTHER ORGANIZATIONS
                    TABLE 6 ASIA PACIFIC: LIST OF REGULATORY BODIES, GOVERNMENT AGENCIES, AND OTHER ORGANIZATIONS
                    TABLE 7 ROW: LIST OF REGULATORY BODIES, GOVERNMENT AGENCIES, AND OTHER ORGANIZATIONS
           5.9.2 REGULATIONS, BY REGION
                    5.9.2.1 North America
                    5.9.2.2 Europe
                    5.9.2.3 Asia Pacific
                    5.9.2.4 Middle East & South Africa
                    5.9.2.5 Latin America
           5.9.3 REGULATORY IMPLICATIONS AND INDUSTRY STANDARDS
                    5.9.3.1 General Data Protection Regulation (GDPR)
                    5.9.3.2 SEC Rule 17a-4
                    5.9.3.3 ISO/IEC 27001
                    5.9.3.4 System and Organization Controls (SOC) 2 type II compliance
                    5.9.3.5 Financial Industry Regulatory Authority (FINRA)
                    5.9.3.6 Freedom of Information Act (FOIA)
                    5.9.3.7 Health Insurance Portability and Accountability Act (HIPAA)
    5.10 PORTER’S FIVE FORCES ANALYSIS 
           TABLE 8 PORTER’S FIVE FORCES’ IMPACT ON ESG REPORTING SOFTWARE MARKET
           FIGURE 26 PORTER’S FIVE FORCES ANALYSIS: ESG REPORTING SOFTWARE MARKET
           5.10.1 THREAT OF NEW ENTRANTS
           5.10.2 THREAT OF SUBSTITUTES
           5.10.3 BARGAINING POWER OF SUPPLIERS
           5.10.4 BARGAINING POWER OF BUYERS
           5.10.5 INTENSITY OF COMPETITIVE RIVALRY
    5.11 KEY CONFERENCES AND EVENTS, 2024–2025 
                    TABLE 9 ESG REPORTING SOFTWARE MARKET: KEY CONFERENCES AND EVENTS, 2024–2025
    5.12 TRENDS/DISRUPTIONS IMPACTING CUSTOMERS’ BUSINESSES 
                    FIGURE 27 ESG REPORTING SOFTWARE MARKET: TRENDS/DISRUPTIONS IMPACTING CUSTOMERS’ BUSINESSES
    5.13 KEY STAKEHOLDERS AND BUYING CRITERIA 
           5.13.1 KEY STAKEHOLDERS IN BUYING PROCESS
                    FIGURE 28 INFLUENCE OF STAKEHOLDERS ON BUYING PROCESS FOR TOP THREE VERTICALS
                    TABLE 10 INFLUENCE OF STAKEHOLDERS ON BUYING PROCESS FOR TOP THREE VERTICALS
    5.14 BUYING CRITERIA 
                    FIGURE 29 KEY BUYING CRITERIA FOR TOP THREE VERTICALS
                    TABLE 11 KEY BUYING CRITERIA FOR TOP THREE VERTICALS
    5.15 BUSINESS MODEL ANALYSIS 
           5.15.1 SUBSCRIPTION-BASED MODEL
           5.15.2 PAY-PER-USE MODEL
           5.15.3 ENTERPRISE LICENSING MODEL
           5.15.4 FREEMIUM MODEL
           5.15.5 ENTERPRISE LICENSING MODEL
    5.16 INVESTMENT & FUNDING SCENARIO 
                    FIGURE 30 LEADING GLOBAL ESG REPORTING SOFTWARE MARKET VENDORS BY NUMBER OF INVESTORS AND FUNDING ROUNDS, 2023
 
6 ESG REPORTING SOFTWARE MARKET, BY OFFERING (Page No. - 84)
    6.1 INTRODUCTION 
           6.1.1 OFFERINGS: ESG REPORTING SOFTWARE MARKET DRIVERS
                    FIGURE 31 SERVICES SEGMENT TO GROW AT HIGHER CAGR DURING FORECAST PERIOD
                    TABLE 12 ESG REPORTING SOFTWARE MARKET, BY OFFERING, 2019–2023 (USD MILLION)
                    TABLE 13 ESG REPORTING SOFTWARE MARKET, BY OFFERING, 2024–2029 (USD MILLION)
    6.2 SOFTWARE 
           FIGURE 32 SOCIAL ESG REPORTING SOFTWARE SEGMENT TO GROW AT HIGHEST CAGR DURING FORECAST PERIOD
           TABLE 14 ESG REPORTING SOFTWARE MARKET, BY SOFTWARE, 2019–2023 (USD MILLION)
           TABLE 15 ESG REPORTING SOFTWARE MARKET, BY SOFTWARE, 2024–2029 (USD MILLION)
           TABLE 16 SOFTWARE: ESG REPORTING SOFTWARE MARKET, BY REGION, 2019–2023 (USD MILLION)
           TABLE 17 SOFTWARE: ESG REPORTING SOFTWARE MARKET, BY REGION, 2024–2029 (USD MILLION)
           6.2.1 SOFTWARE TYPES: ESG REPORTING SOFTWARE MARKET
                    6.2.1.1 Environmental ESG reporting software
                               6.2.1.1.1 Environmental ESG reporting software to help organizations calculate KPIs and generate comprehensive reports
                               TABLE 18 ENVIRONMENTAL ESG REPORTING SOFTWARE: ESG REPORTING SOFTWARE MARKET, BY REGION, 2019–2023 (USD MILLION)
                               TABLE 19 ENVIRONMENTAL ESG REPORTING SOFTWARE: ESG REPORTING SOFTWARE MARKET, BY REGION, 2024–2029 (USD MILLION)
                    6.2.1.2 Carbon emission tracking software
                               6.2.1.2.1 Emission inventory management
                               6.2.1.2.2 Carbon footprint calculation
                               6.2.1.2.3 Emission reduction goal tracking
                    6.2.1.3 Energy consumption monitoring software
                               6.2.1.3.1 Energy usage tracking
                               6.2.1.3.2 Demand-side management
                               6.2.1.3.3 Energy conservation measures tracking
                    6.2.1.4 Sustainability performance management software
                               6.2.1.4.1 Water usage tracking
                               6.2.1.4.2 Waste management and recycling
                               6.2.1.4.3 Biodiversity conservation efforts
                    6.2.1.5 Climate risk assessment software
                               6.2.1.5.1 Physical risk assessment
                               6.2.1.5.2 Transition risk analysis
                               6.2.1.5.3 Resilience planning and adaptation strategies
                    6.2.1.6 Environmental Impact Assessment (EIA) software
                               6.2.1.6.1 Project-specific impact assessment
                               6.2.1.6.2 Regulatory compliance evaluations
                               6.2.1.6.3 Mitigation measures planning and monitoring
           6.2.2 SOCIAL ESG REPORTING SOFTWARE
                    6.2.2.1 Social ESG reporting software to help organizations control their social impact, spot weak points, and contribute to CSR
                               TABLE 20 SOCIAL ESG REPORTING SOFTWARE: ESG REPORTING SOFTWARE MARKET, BY REGION, 2019–2023 (USD MILLION)
                               TABLE 21 SOCIAL ESG REPORTING SOFTWARE: ESG REPORTING SOFTWARE MARKET, BY REGION, 2024–2029 (USD MILLION)
                    6.2.2.2 Diversity metrics tracking software
                               6.2.2.2.1 Gender diversity
                               6.2.2.2.2 Ethnic diversity
                               6.2.2.2.3 LGBTQ+ representation
                               6.2.2.2.4 Accessibility initiatives
                    6.2.2.3 Labor practices reporting software
                               6.2.2.3.1 Labor rights compliance monitoring
                               6.2.2.3.2 Workplace safety programs
                               6.2.2.3.3 Employee engagement surveys
                    6.2.2.4 Community engagement tracking software
                               6.2.2.4.1 Community investment tracking
                               6.2.2.4.2 Stakeholder consultation platforms
                               6.2.2.4.3 SLO management
                    6.2.2.5 Human rights assessment software
                               6.2.2.5.1 Supply chain human rights audits
                               6.2.2.5.2 Human Rights Impact Assessments (HRIAs)
                               6.2.2.5.3 Human trafficking and modern slavery risk assessment
                    6.2.2.6 Social Impact Assessment (SIA) software
                               6.2.2.6.1 Social Return on Investment (SRoI) analysis audits
                               6.2.2.6.2 Community development indicators tracking
                               6.2.2.6.3 Poverty alleviation program evaluation
           6.2.3 GOVERNANCE ESG REPORTING SOFTWARE
                    6.2.3.1 Governance ESG reporting software organizations to simplify data collection by collecting information from various sources
                               TABLE 22 GOVERNANCE ESG REPORTING SOFTWARE: ESG REPORTING SOFTWARE MARKET, BY REGION, 2019–2023 (USD MILLION)
                               TABLE 23 GOVERNANCE ESG REPORTING SOFTWARE: ESG REPORTING SOFTWARE MARKET, BY REGION, 2024–2029 (USD MILLION)
                    6.2.3.2 Corporate governance reporting software
                               6.2.3.2.1 Board of directors management
                               6.2.3.2.2 Governance structure documentation
                               6.2.3.2.3 Shareholder engagement tools
                    6.2.3.3 Ethics and compliance management software
                               6.2.3.3.1 Code of conduct enforcement
                               6.2.3.3.2 Whistleblower hotline management
                               6.2.3.3.3 Compliance training and certification tracking
                    6.2.3.4 Risk management software
                               6.2.3.4.1 Enterprise Risk Management (ERM)
                               6.2.3.4.2 Internal control assessments
                               6.2.3.4.3 Risk heat maps and dashboards
                    6.2.3.5 Regulatory compliance tracking software
                               6.2.3.5.1 Regulatory change management
                               6.2.3.5.2 Compliance calendar and deadline tracking
                               6.2.3.5.3 Audit trail documentation
                    6.2.3.6 Internal audit software
                               6.2.3.6.1 Audit planning and scheduling
                               6.2.3.6.2 Audit findings management
                               6.2.3.6.3 Audit report generation and distribution
    6.3 SERVICES 
           TABLE 24 SERVICES: ESG REPORTING SOFTWARE MARKET, BY REGION, 2019–2023 (USD MILLION)
           TABLE 25 SERVICES: ESG REPORTING SOFTWARE MARKET, BY REGION, 2024–2029 (USD MILLION)
           6.3.1 CONSULTING
                    6.3.1.1 Consulting services to assess materiality of ESG issues, identify relevant reporting frameworks, and establish KPIs to measure performance
           6.3.2 INTEGRATION & DEPLOYMENT
                    6.3.2.1 Integration & deployment services to help in seamless integration of ESG reporting software with organization’s existing systems
           6.3.3 SUPPORT & MAINTENANCE
                    6.3.3.1 Support & maintenance services to ensure smooth operation and effectiveness of ESG reporting software
 
7 ESG REPORTING SOFTWARE MARKET, BY DEPLOYMENT TYPE (Page No. - 108)
    7.1 INTRODUCTION 
           FIGURE 33 CLOUD SEGMENT TO REGISTER HIGHER CAGR DURING FORECAST PERIOD
           7.1.1 DEPLOYMENT TYPES: ESG REPORTING SOFTWARE MARKET DRIVERS
                    TABLE 26 ESG REPORTING SOFTWARE MARKET, BY DEPLOYMENT TYPE, 2019–2023 (USD MILLION)
                    TABLE 27 ESG REPORTING SOFTWARE MARKET, BY DEPLOYMENT TYPE, 2024–2029 (USD MILLION)
    7.2 CLOUD 
           7.2.1 COST-EFFECTIVENESS, EASY ACCESS, AND SCALABILITY TO BOOST DEMAND FOR CLOUD-BASED ESG SOLUTIONS
                    TABLE 28 CLOUD: ESG REPORTING SOFTWARE MARKET, BY REGION, 2019–2023 (USD MILLION)
                    TABLE 29 CLOUD: ESG REPORTING SOFTWARE MARKET, BY REGION, 2024–2029 (USD MILLION)
    7.3 ON-PREMISES 
           7.3.1 RISING FOCUS ON SECURITY AND COMPLIANCE TO FUEL DEMAND FOR ON-PREMISES ESG REPORTING SOFTWARE
                    TABLE 30 ON-PREMISES: ESG REPORTING SOFTWARE MARKET, BY REGION, 2019–2023 (USD MILLION)
                    TABLE 31 ON-PREMISES: ESG REPORTING SOFTWARE MARKET, BY REGION, 2024–2029 (USD MILLION)
 
8 ESG REPORTING SOFTWARE MARKET, BY ORGANIZATION SIZE (Page No. - 113)
    8.1 INTRODUCTION 
           FIGURE 34 SMES SEGMENT TO REGISTER HIGHER CAGR DURING FORECAST PERIOD
           8.1.1 ORGANIZATION SIZES: ESG REPORTING SOFTWARE MARKET DRIVERS
                    TABLE 32 ESG REPORTING SOFTWARE MARKET, BY ORGANIZATION SIZE, 2019–2023 (USD MILLION)
                    TABLE 33 ESG REPORTING SOFTWARE MARKET, BY ORGANIZATION SIZE, 2024–2029 (USD MILLION)
    8.2 SMALL AND MEDIUM-SIZED ENTERPRISES 
           8.2.1 ESG REPORTING SOFTWARE TO OFFER CENTRALIZED DATA COLLECTION, ANALYSIS, AND REPORTING PLATFORM FOR SUSTAINABILITY DATA
                    TABLE 34 SMALL AND MEDIUM-SIZED ENTERPRISES: ESG REPORTING SOFTWARE MARKET, BY REGION, 2019–2023 (USD MILLION)
                    TABLE 35 SMALL AND MEDIUM-SIZED ENTERPRISES: ESG REPORTING SOFTWARE MARKET, BY REGION, 2024–2029 (USD MILLION)
    8.3 LARGE ENTERPRISES 
           8.3.1 ESG REPORTING SOFTWARE TO HELP LARGE-SCALE COMPANIES ENHANCE REPUTATION, MINIMIZE RISKS, AND REINFORCE THEIR COMPETITIVE EDGE FOR MANAGING RISKS
                    TABLE 36 LARGE ENTERPRISES: ESG REPORTING SOFTWARE MARKET, BY REGION, 2019–2023 (USD MILLION)
                    TABLE 37 LARGE ENTERPRISES: ESG REPORTING SOFTWARE MARKET, BY REGION, 2024–2029 (USD MILLION)
 
9 ESG REPORTING SOFTWARE MARKET, BY VERTICAL (Page No. - 118)
    9.1 INTRODUCTION 
           FIGURE 35 BFSI SEGMENT TO ACCOUNT FOR LARGEST MARKET DURING FORECAST PERIOD
           9.1.1 VERTICALS: ESG REPORTING SOFTWARE MARKET DRIVERS
           TABLE 38 ESG REPORTING SOFTWARE MARKET, BY VERTICAL, 2019–2023 (USD MILLION)
           TABLE 39 ESG REPORTING SOFTWARE MARKET, BY VERTICAL, 2024–2029 (USD MILLION)
    9.2 BFSI 
           9.2.1 NEED FOR CAPITAL INVESTMENT AND FINANCIAL SUPPORT TO SPUR DEMAND FOR ESG REPORTING SOFTWARE IN BFSI
           9.2.2 BFSI: APPLICATION AREAS
                    9.2.2.1 Risk management & compliance
                    9.2.2.2 Investment analysis & decision making
                    9.2.2.3 Stakeholder engagement & transparency
                    9.2.2.4 Credit risk management
                    9.2.2.5 Other BFSI application areas
                               TABLE 40 BFSI: ESG REPORTING SOFTWARE MARKET, BY REGION, 2019–2023 (USD MILLION)
                               TABLE 41 BFSI: ESG REPORTING SOFTWARE MARKET, BY REGION, 2024–2029 (USD MILLION)
    9.3 GOVERNMENT, PUBLIC SECTOR, AND NON-PROFIT 
           9.3.1 NEED FOR REGULATORY COMPLIANCE & REPORTING, POLICY DEVELOPMENT, AND IMPLEMENTATION TO PROPEL MARKET
           9.3.2 GOVERNMENT, PUBLIC SECTOR, AND NON-PROFIT: APPLICATION AREAS
                    9.3.2.1 Policy development & implementation
                    9.3.2.2 Regulatory compliance & reporting
                    9.3.2.3 Public service delivery optimization
                    9.3.2.4 Other government, public sector, and non-profit application areas
                               TABLE 42 GOVERNMENT, PUBLIC SECTOR, AND NON-PROFIT: ESG REPORTING SOFTWARE MARKET, BY REGION, 2019–2023 (USD MILLION)
                               TABLE 43 GOVERNMENT, PUBLIC SECTOR, AND NON-PROFIT: ESG REPORTING SOFTWARE MARKET, BY REGION, 2024–2029 (USD MILLION)
    9.4 MANUFACTURING 
           9.4.1 NEED TO CONTROL HIGH CARBON EMISSIONS AND WATER SCARCITY TO ACCELERATE MARKET GROWTH
           9.4.2 MANUFACTURING: APPLICATION AREAS
                    9.4.2.1 Environmental impact assessment & management
                    9.4.2.2 Supply chain sustainability
                    9.4.2.3 Energy efficiency & resource management
                    9.4.2.4 Compliance & regulatory reporting
                    9.4.2.5 Product lifecycle assessment
                    9.4.2.6 Risk identification & mitigation
                               TABLE 44 MANUFACTURING: ESG REPORTING SOFTWARE MARKET, BY REGION, 2019–2023 (USD MILLION)
                               TABLE 45 MANUFACTURING: ESG REPORTING SOFTWARE MARKET, BY REGION, 2024–2029 (USD MILLION)
    9.5 FOOD & BEVERAGES 
           9.5.1 ESG REPORTING SOFTWARE TO CREATE SUPPLY CHAIN TRANSPARENCY AND MANAGE WASTE AND CARBON EMISSION
           9.5.2 FOOD & BEVERAGES: APPLICATION AREAS
                    9.5.2.1 Supply chain transparency & visibility
                    9.5.2.2 Carbon & energy management
                    9.5.2.3 Waste management & conservation
                    9.5.2.4 Social responsibility & labor practices
                               TABLE 46 FOOD & BEVERAGES: ESG REPORTING SOFTWARE MARKET, BY REGION, 2019–2023 (USD MILLION)
                               TABLE 47 FOOD & BEVERAGES: ESG REPORTING SOFTWARE MARKET, BY REGION, 2024–2029 (USD MILLION)
    9.6 RETAIL & CONSUMER GOODS 
           9.6.1 ESG REPORTING SOFTWARE TO MONITOR ENERGY CONSUMPTION, WASTE GENERATION, SUPPLY CHAIN PRACTICES, LABOR STANDARDS, AND DIVERSITY INITIATIVES
           9.6.2 RETAIL & CONSUMER GOODS: APPLICATION AREAS
                    9.6.2.1 Supply chain transparency & sustainability
                    9.6.2.2 Energy & resource management
                    9.6.2.3 Corporate governance & ethics
                    9.6.2.4 Stakeholder communication & transparency
                               TABLE 48 RETAIL & CONSUMER GOODS: ESG REPORTING SOFTWARE MARKET, BY REGION, 2019–2023 (USD MILLION)
                               TABLE 49 RETAIL & CONSUMER GOODS: ESG REPORTING SOFTWARE MARKET, BY REGION, 2024–2029 (USD MILLION)
    9.7 ENERGY & UTILITIES 
           9.7.1 NEED FOR RENEWABLE ENERGY INTEGRATION & TRANSITION, CARBON FOOTPRINT MONITORING, AND RESOURCE CONSERVATION TO DRIVE MARKET
           9.7.2 ENERGY & UTILITIES: APPLICATION AREAS
                    9.7.2.1 Carbon footprint monitoring & reduction
                    9.7.2.2 Renewable energy integration & transition
                    9.7.2.3 Resource efficiency & conservation
                    9.7.2.4 Other energy & utilities application areas
                               TABLE 50 ENERGY & UTILITIES: ESG REPORTING SOFTWARE MARKET, BY REGION, 2019–2023 (USD MILLION)
                               TABLE 51 ENERGY & UTILITIES: ESG REPORTING SOFTWARE MARKET, BY REGION, 2024–2029 (USD MILLION)
    9.8 OTHER VERTICALS 
           TABLE 52 OTHER VERTICALS: ESG REPORTING SOFTWARE MARKET, BY REGION, 2019–2023 (USD MILLION)
           TABLE 53 OTHER VERTICALS: ESG REPORTING SOFTWARE MARKET, BY REGION, 2024–2029 (USD MILLION)
 
10 ESG REPORTING SOFTWARE MARKET, BY REGION (Page No. - 134)
     10.1 INTRODUCTION 
               FIGURE 36 NORTH AMERICA TO ACCOUNT FOR LARGEST MARKET BY 2029
               TABLE 54 ESG REPORTING SOFTWARE MARKET, BY REGION, 2019–2023 (USD MILLION)
               TABLE 55 ESG REPORTING SOFTWARE MARKET, BY REGION, 2024–2029 (USD MILLION)
     10.2 NORTH AMERICA 
             10.2.1 NORTH AMERICA: ESG REPORTING SOFTWARE MARKET DRIVERS
             10.2.2 NORTH AMERICA: RECESSION IMPACT
                       FIGURE 37 NORTH AMERICA: MARKET SNAPSHOT
                       TABLE 56 NORTH AMERICA: ESG REPORTING SOFTWARE MARKET, BY OFFERING, 2019–2023 (USD MILLION)
                       TABLE 57 NORTH AMERICA: ESG REPORTING SOFTWARE MARKET, BY OFFERING, 2024–2029 (USD MILLION)
                       TABLE 58 NORTH AMERICA: ESG REPORTING SOFTWARE MARKET, BY SOFTWARE, 2019–2023 (USD MILLION)
                       TABLE 59 NORTH AMERICA: ESG REPORTING SOFTWARE MARKET, BY SOFTWARE, 2024–2029 (USD MILLION)
                       TABLE 60 NORTH AMERICA: ESG REPORTING SOFTWARE MARKET, BY DEPLOYMENT TYPE, 2019–2023 (USD MILLION)
                       TABLE 61 NORTH AMERICA: ESG REPORTING SOFTWARE MARKET, BY DEPLOYMENT TYPE, 2024–2029 (USD MILLION)
                       TABLE 62 NORTH AMERICA: ESG REPORTING SOFTWARE MARKET, BY ORGANIZATION SIZE, 2019–2023 (USD MILLION)
                       TABLE 63 NORTH AMERICA: ESG REPORTING SOFTWARE MARKET, BY ORGANIZATION SIZE, 2024–2029 (USD MILLION)
                       TABLE 64 NORTH AMERICA: ESG REPORTING SOFTWARE MARKET, BY VERTICAL, 2019–2023 (USD MILLION)
                       TABLE 65 NORTH AMERICA: ESG REPORTING SOFTWARE MARKET, BY VERTICAL, 2024–2029 (USD MILLION)
                       TABLE 66 NORTH AMERICA: ESG REPORTING SOFTWARE MARKET, BY COUNTRY, 2019–2023 (USD MILLION)
                       TABLE 67 NORTH AMERICA: ESG REPORTING SOFTWARE MARKET, BY COUNTRY, 2024–2029 (USD MILLION)
             10.2.3 US
                       10.2.3.1 Need to monitor, manage, and report eco-friendly projects and sustainability outcome to fuel demand for ESG reporting software
                                   TABLE 68 US: ESG REPORTING SOFTWARE MARKET, BY DEPLOYMENT TYPE, 2019–2023 (USD MILLION)
                                   TABLE 69 US: ESG REPORTING SOFTWARE MARKET, BY DEPLOYMENT TYPE, 2024–2029 (USD MILLION)
                                   TABLE 70 US: ESG REPORTING SOFTWARE MARKET, BY ORGANIZATION SIZE, 2019–2023 (USD MILLION)
                                   TABLE 71 US: ESG REPORTING SOFTWARE MARKET, BY ORGANIZATION SIZE, 2024–2029 (USD MILLION)
             10.2.4 CANADA
                       10.2.4.1 Government initiatives for cloud adoption and stable economy and rising adoption of sustainability to drive market
                                   TABLE 72 CANADA: ESG REPORTING SOFTWARE MARKET, BY DEPLOYMENT TYPE, 2019–2023 (USD MILLION)
                                   TABLE 73 CANADA: ESG REPORTING SOFTWARE MARKET, BY DEPLOYMENT TYPE, 2024–2029 (USD MILLION)
                                   TABLE 74 CANADA: ESG REPORTING SOFTWARE MARKET, BY ORGANIZATION SIZE, 2019–2023 (USD MILLION)
                                   TABLE 75 CANADA: ESG REPORTING SOFTWARE MARKET, BY ORGANIZATION SIZE, 2024–2029 (USD MILLION)
     10.3 EUROPE 
             10.3.1 EUROPE: ESG REPORTING SOFTWARE MARKET DRIVERS
                       10.3.2 EUROPE: RECESSION IMPACT
                       TABLE 76 EUROPE: ESG REPORTING SOFTWARE MARKET, BY OFFERING, 2019–2023 (USD MILLION)
                       TABLE 77 EUROPE: ESG REPORTING SOFTWARE MARKET, BY OFFERING, 2024–2029 (USD MILLION)
                       TABLE 78 EUROPE: ESG REPORTING SOFTWARE MARKET, BY SOFTWARE, 2019–2023 (USD MILLION)
                       TABLE 79 EUROPE: ESG REPORTING SOFTWARE MARKET, BY SOFTWARE, 2024–2029 (USD MILLION)
                       TABLE 80 EUROPE: ESG REPORTING SOFTWARE MARKET, BY DEPLOYMENT TYPE, 2019–2023 (USD MILLION)
                       TABLE 81 EUROPE: ESG REPORTING SOFTWARE MARKET, BY DEPLOYMENT TYPE, 2024–2029 (USD MILLION)
                       TABLE 82 EUROPE: ESG REPORTING SOFTWARE MARKET, BY ORGANIZATION SIZE, 2019–2023 (USD MILLION)
                       TABLE 83 EUROPE: ESG REPORTING SOFTWARE MARKET, BY ORGANIZATION SIZE, 2024–2029 (USD MILLION)
                       TABLE 84 EUROPE: ESG REPORTING SOFTWARE MARKET, BY VERTICAL, 2019–2023 (USD MILLION)
                       TABLE 85 EUROPE: ESG REPORTING SOFTWARE MARKET, BY VERTICAL, 2024–2029 (USD MILLION)
                       TABLE 86 EUROPE: ESG REPORTING SOFTWARE MARKET, BY COUNTRY, 2019–2023 (USD MILLION)
                       TABLE 87 EUROPE: ESG REPORTING SOFTWARE MARKET, BY COUNTRY, 2024–2029 (USD MILLION)
             10.3.3 UK
                       10.3.3.1 Increased operational efficiency and rising focus on importance of sustainability to boost demand for ESG reporting software
                                   TABLE 88 UK: ESG REPORTING SOFTWARE MARKET, BY DEPLOYMENT TYPE, 2019–2023 (USD MILLION)
                                   TABLE 89 UK: ESG REPORTING SOFTWARE MARKET, BY DEPLOYMENT TYPE, 2024–2029 (USD MILLION)
                                   TABLE 90 UK: ESG REPORTING SOFTWARE MARKET, BY ORGANIZATION SIZE, 2019–2023 (USD MILLION)
                                   TABLE 91 UK: ESG REPORTING SOFTWARE MARKET, BY ORGANIZATION SIZE, 2024–2029 (USD MILLION)
             10.3.4 GERMANY
                       10.3.4.1 Rising Internet use, rapid implementation of new technologies, and increasing adoption of digitalization to propel market
                                   TABLE 92 GERMANY: ESG REPORTING SOFTWARE MARKET, BY DEPLOYMENT TYPE, 2019–2023 (USD MILLION)
                                   TABLE 93 GERMANY: ESG REPORTING SOFTWARE MARKET, BY DEPLOYMENT TYPE, 2024–2029 (USD MILLION)
                                   TABLE 94 GERMANY: ESG REPORTING SOFTWARE MARKET, BY ORGANIZATION SIZE, 2019–2023 (USD MILLION)
                                   TABLE 95 GERMANY: ESG REPORTING SOFTWARE MARKET, BY ORGANIZATION SIZE, 2024–2029 (USD MILLION)
             10.3.5 ITALY
                       10.3.5.1 Increasing reporting regulations and rising demand for ESG disclosures to spur market growth
                                   TABLE 96 ITALY: ESG REPORTING SOFTWARE MARKET, BY DEPLOYMENT TYPE, 2019–2023 (USD MILLION)
                                   TABLE 97 ITALY: ESG REPORTING SOFTWARE MARKET, BY DEPLOYMENT TYPE, 2024–2029 (USD MILLION)
                                   TABLE 98 ITALY: ESG REPORTING SOFTWARE MARKET, BY ORGANIZATION SIZE, 2019–2023 (USD MILLION)
                                   TABLE 99 ITALY: ESG REPORTING SOFTWARE MARKET, BY ORGANIZATION SIZE, 2024–2029 (USD MILLION)
             10.3.6 REST OF EUROPE
                       TABLE 100 REST OF EUROPE: ESG REPORTING SOFTWARE MARKET, BY DEPLOYMENT TYPE, 2019–2023 (USD MILLION)
                       TABLE 101 REST OF EUROPE: ESG REPORTING SOFTWARE MARKET, BY DEPLOYMENT TYPE, 2024–2029 (USD MILLION)
                       TABLE 102 REST OF EUROPE: ESG REPORTING SOFTWARE MARKET, BY ORGANIZATION SIZE, 2019–2023 (USD MILLION)
                       TABLE 103 REST OF EUROPE: ESG REPORTING SOFTWARE MARKET, BY ORGANIZATION SIZE, 2024–2029 (USD MILLION)
     10.4 ASIA PACIFIC 
             10.4.1 ASIA PACIFIC: ESG REPORTING SOFTWARE MARKET DRIVERS
             10.4.2 ASIA PACIFIC: RECESSION IMPACT
                       FIGURE 38 ASIA PACIFIC: MARKET SNAPSHOT
                       TABLE 104 ASIA PACIFIC: ESG REPORTING SOFTWARE MARKET, BY OFFERING, 2019–2023 (USD MILLION)
                       TABLE 105 ASIA PACIFIC: ESG REPORTING SOFTWARE MARKET, BY OFFERING, 2024–2029 (USD MILLION)
                       TABLE 106 ASIA PACIFIC: ESG REPORTING SOFTWARE MARKET, BY SOFTWARE, 2019–2023 (USD MILLION)
                       TABLE 107 ASIA PACIFIC: ESG REPORTING SOFTWARE MARKET, BY SOFTWARE, 2024–2029 (USD MILLION)
                       TABLE 108 ASIA PACIFIC: ESG REPORTING SOFTWARE MARKET, BY DEPLOYMENT TYPE, 2019–2023 (USD MILLION)
                       TABLE 109 ASIA PACIFIC: ESG REPORTING SOFTWARE MARKET, BY DEPLOYMENT TYPE, 2024–2029 (USD MILLION)
                       TABLE 110 ASIA PACIFIC: ESG REPORTING SOFTWARE MARKET, BY ORGANIZATION SIZE, 2019–2023 (USD MILLION)
                       TABLE 111 ASIA PACIFIC: ESG REPORTING SOFTWARE MARKET, BY ORGANIZATION SIZE, 2024–2029 (USD MILLION)
                       TABLE 112 ASIA PACIFIC: ESG REPORTING SOFTWARE MARKET, BY VERTICAL, 2019–2023 (USD MILLION)
                       TABLE 113 ASIA PACIFIC: ESG REPORTING SOFTWARE MARKET, BY VERTICAL, 2024–2029 (USD MILLION)
                       TABLE 114 ASIA PACIFIC: ESG REPORTING SOFTWARE MARKET, BY COUNTRY, 2019–2023 (USD MILLION)
                       TABLE 115 ASIA PACIFIC: ESG REPORTING SOFTWARE MARKET, BY COUNTRY, 2024–2029 (USD MILLION)
             10.4.3 CHINA
                       10.4.3.1 Focus on corporate social responsibility and sustainable business practices and increased adoption of new technologies to foster market
                                   TABLE 116 CHINA: ESG REPORTING SOFTWARE MARKET, BY DEPLOYMENT TYPE, 2019–2023 (USD MILLION)
                                   TABLE 117 CHINA: ESG REPORTING SOFTWARE MARKET, BY DEPLOYMENT TYPE, 2024–2029 (USD MILLION)
                                   TABLE 118 CHINA: ESG REPORTING SOFTWARE MARKET, BY ORGANIZATION SIZE, 2019–2023 (USD MILLION)
                                   TABLE 119 CHINA: ESG REPORTING SOFTWARE MARKET, BY ORGANIZATION SIZE, 2024–2029 (USD MILLION)
             10.4.4 JAPAN
                       10.4.4.1 Enterprises’ shift toward digital transformation and focus on streamlining business process to drive market
                                   TABLE 120 JAPAN: ESG REPORTING SOFTWARE MARKET, BY DEPLOYMENT TYPE, 2019–2023 (USD MILLION)
                                   TABLE 121 JAPAN: ESG REPORTING SOFTWARE MARKET, BY DEPLOYMENT TYPE, 2024–2029 (USD MILLION)
                                   TABLE 122 JAPAN: ESG REPORTING SOFTWARE MARKET, BY ORGANIZATION SIZE, 2019–2023 (USD MILLION)
                                   TABLE 123 JAPAN: ESG REPORTING SOFTWARE MARKET, BY ORGANIZATION SIZE, 2024–2029 (USD MILLION)
             10.4.5 REST OF ASIA PACIFIC
                       TABLE 124 REST OF ASIA PACIFIC: ESG REPORTING SOFTWARE MARKET, BY DEPLOYMENT TYPE, 2019–2023 (USD MILLION)
                       TABLE 125 REST OF ASIA PACIFIC: ESG REPORTING SOFTWARE MARKET, BY DEPLOYMENT TYPE, 2024–2029 (USD MILLION)
                       TABLE 126 REST OF ASIA PACIFIC: ESG REPORTING SOFTWARE MARKET, BY ORGANIZATION SIZE, 2019–2023 (USD MILLION)
                       TABLE 127 REST OF ASIA PACIFIC: ESG REPORTING SOFTWARE MARKET, BY ORGANIZATION SIZE, 2024–2029 (USD MILLION)
     10.5 MIDDLE EAST & AFRICA 
             10.5.1 MIDDLE EAST & AFRICA: ESG REPORTING SOFTWARE MARKET DRIVERS
             10.5.2 MIDDLE EAST & AFRICA: RECESSION IMPACT
                       TABLE 128 MIDDLE EAST & AFRICA: ESG REPORTING SOFTWARE MARKET, BY OFFERING, 2019–2023 (USD MILLION)
                       TABLE 129 MIDDLE EAST & AFRICA: ESG REPORTING SOFTWARE MARKET, BY OFFERING, 2024–2029 (USD MILLION)
                       TABLE 130 MIDDLE EAST & AFRICA: ESG REPORTING SOFTWARE MARKET, BY SOFTWARE, 2019–2023 (USD MILLION)
                       TABLE 131 MIDDLE EAST & AFRICA: ESG REPORTING SOFTWARE MARKET, BY SOFTWARE, 2024–2029 (USD MILLION)
                       TABLE 132 MIDDLE EAST & AFRICA: ESG REPORTING SOFTWARE MARKET, BY DEPLOYMENT TYPE, 2019–2023 (USD MILLION)
                       TABLE 133 MIDDLE EAST & AFRICA: ESG REPORTING SOFTWARE MARKET, BY DEPLOYMENT TYPE, 2024–2029 (USD MILLION)
                       TABLE 134 MIDDLE EAST & AFRICA: ESG REPORTING SOFTWARE MARKET, BY ORGANIZATION SIZE, 2019–2023 (USD MILLION)
                       TABLE 135 MIDDLE EAST & AFRICA: ESG REPORTING SOFTWARE MARKET, BY ORGANIZATION SIZE, 2024–2029 (USD MILLION)
                       TABLE 136 MIDDLE EAST & AFRICA: ESG REPORTING SOFTWARE MARKET, BY VERTICAL, 2019–2023 (USD MILLION)
                       TABLE 137 MIDDLE EAST & AFRICA: ESG REPORTING SOFTWARE MARKET, BY VERTICAL, 2024–2029 (USD MILLION)
                       TABLE 138 MIDDLE EAST & AFRICA: ESG REPORTING SOFTWARE MARKET, BY SUBREGION, 2019–2023 (USD MILLION)
                       TABLE 139 MIDDLE EAST & AFRICA: ESG REPORTING SOFTWARE MARKET, BY SUBREGION, 2024–2029 (USD MILLION)
             10.5.3 GULF COOPERATION COUNCIL COUNTRIES
                       10.5.3.1 Increasing emphasis on corporate social responsibility, sustainable business practices, and rising digital transformation to drive market
                                   TABLE 140 GULF COOPERATION COUNCIL COUNTRIES: ESG REPORTING SOFTWARE MARKET, BY DEPLOYMENT TYPE, 2019–2023 (USD MILLION)
                                   TABLE 141 GULF COOPERATION COUNCIL COUNTRIES: ESG REPORTING SOFTWARE MARKET, BY DEPLOYMENT TYPE, 2024–2029 (USD MILLION)
                                   TABLE 142 GULF COOPERATION COUNCIL COUNTRIES: ESG REPORTING SOFTWARE MARKET, BY ORGANIZATION SIZE, 2019–2023 (USD MILLION)
                                   TABLE 143 GULF COOPERATION COUNCIL COUNTRIES: ESG REPORTING SOFTWARE MARKET, BY ORGANIZATION SIZE, 2024–2029 (USD MILLION)
                       10.5.3.2 KSA
                       10.5.3.3 UAE
                       10.5.3.4 Rest of GCC Countries
             10.5.4 SOUTH AFRICA
                       10.5.4.1 Inclusive Digital Transformation initiative and increasing emphasis on corporate social responsibility to foster market growth
                                   TABLE 144 SOUTH AFRICA: ESG REPORTING SOFTWARE MARKET, BY DEPLOYMENT TYPE, 2019–2023 (USD MILLION)
                                   TABLE 145 SOUTH AFRICA: ESG REPORTING SOFTWARE MARKET, BY DEPLOYMENT TYPE, 2024–2029 (USD MILLION)
                                   TABLE 146 SOUTH AFRICA: ESG REPORTING SOFTWARE MARKET, BY ORGANIZATION SIZE, 2019–2023 (USD MILLION)
                                   TABLE 147 SOUTH AFRICA: ESG REPORTING SOFTWARE MARKET, BY ORGANIZATION SIZE, 2024–2029 (USD MILLION)
             10.5.5 REST OF MIDDLE EAST & AFRICA
                       TABLE 148 REST OF MIDDLE EAST & AFRICA: ESG REPORTING SOFTWARE MARKET, BY DEPLOYMENT TYPE, 2019–2023 (USD MILLION)
                       TABLE 149 REST OF MIDDLE EAST & AFRICA: ESG REPORTING SOFTWARE MARKET, BY DEPLOYMENT TYPE, 2024–2029 (USD MILLION)
                       TABLE 150 REST OF MIDDLE EAST & AFRICA: ESG REPORTING SOFTWARE MARKET, BY ORGANIZATION SIZE, 2019–2023 (USD MILLION)
                       TABLE 151 REST OF MIDDLE EAST & AFRICA: ESG REPORTING SOFTWARE MARKET, BY ORGANIZATION SIZE, 2024–2029 (USD MILLION)
     10.6 LATIN AMERICA 
             10.6.1 LATIN AMERICA: ESG REPORTING SOFTWARE MARKET DRIVERS
             10.6.2 LATIN AMERICA: RECESSION IMPACT
                       TABLE 152 LATIN AMERICA: ESG REPORTING SOFTWARE MARKET, BY OFFERING, 2019–2023 (USD MILLION)
                       TABLE 153 LATIN AMERICA: ESG REPORTING SOFTWARE MARKET, BY OFFERING, 2024–2029 (USD MILLION)
                       TABLE 154 LATIN AMERICA: ESG REPORTING SOFTWARE MARKET, BY SOFTWARE, 2019–2023 (USD MILLION)
                       TABLE 155 LATIN AMERICA: ESG REPORTING SOFTWARE MARKET, BY SOFTWARE, 2024–2029 (USD MILLION)
                       TABLE 156 LATIN AMERICA: ESG REPORTING SOFTWARE MARKET, BY DEPLOYMENT TYPE, 2019–2023 (USD MILLION)
                       TABLE 157 LATIN AMERICA: ESG REPORTING SOFTWARE MARKET, BY DEPLOYMENT TYPE, 2024–2029 (USD MILLION)
                       TABLE 158 LATIN AMERICA: ESG REPORTING SOFTWARE MARKET, BY ORGANIZATION SIZE, 2019–2023 (USD MILLION)
                       TABLE 159 LATIN AMERICA: ESG REPORTING SOFTWARE MARKET, BY ORGANIZATION SIZE, 2024–2029 (USD MILLION)
                       TABLE 160 LATIN AMERICA: ESG REPORTING SOFTWARE MARKET, BY VERTICAL, 2019–2023 (USD MILLION)
                       TABLE 161 LATIN AMERICA: ESG REPORTING SOFTWARE MARKET, BY VERTICAL, 2024–2029 (USD MILLION)
                       TABLE 162 LATIN AMERICA: ESG REPORTING SOFTWARE MARKET, BY COUNTRY, 2019–2023 (USD MILLION)
                       TABLE 163 LATIN AMERICA: ESG REPORTING SOFTWARE MARKET, BY COUNTRY, 2024–2029 (USD MILLION)
             10.6.3 BRAZIL
                       10.6.3.1 Rapid digital transformation initiatives and need to strengthen digital security to accelerate market growth
                                   TABLE 164 BRAZIL: ESG REPORTING SOFTWARE MARKET, BY DEPLOYMENT TYPE, 2019–2023 (USD MILLION)
                                   TABLE 165 BRAZIL: ESG REPORTING SOFTWARE MARKET, BY DEPLOYMENT TYPE, 2024–2029 (USD MILLION)
                                   TABLE 166 BRAZIL: ESG REPORTING SOFTWARE MARKET, BY ORGANIZATION SIZE, 2019–2023 (USD MILLION)
                                   TABLE 167 BRAZIL: ESG REPORTING SOFTWARE MARKET, BY ORGANIZATION SIZE, 2024–2029 (USD MILLION)
             10.6.4 REST OF LATIN AMERICA
                       TABLE 168 REST OF LATIN AMERICA: ESG REPORTING SOFTWARE MARKET, BY DEPLOYMENT TYPE, 2019–2023 (USD MILLION)
                       TABLE 169 REST OF LATIN AMERICA: ESG REPORTING SOFTWARE MARKET, BY DEPLOYMENT TYPE, 2024–2029 (USD MILLION)
                       TABLE 170 REST OF LATIN AMERICA: ESG REPORTING SOFTWARE MARKET, BY ORGANIZATION SIZE, 2019–2023 (USD MILLION)
                       TABLE 171 REST OF LATIN AMERICA: ESG REPORTING SOFTWARE MARKET, BY ORGANIZATION SIZE, 2024–2029 (USD MILLION)
 
11 COMPETITIVE LANDSCAPE (Page No. - 182)
     11.1 OVERVIEW 
     11.2 KEY PLAYER STRATEGIES/RIGHT TO WIN 
               TABLE 172 OVERVIEW OF STRATEGIES ADOPTED BY KEY ESG REPORTING SOFTWARE MARKET VENDORS
     11.3 REVENUE ANALYSIS 
               FIGURE 39 TOP FOUR PLAYERS DOMINATING MARKET IN LAST FIVE YEARS
     11.4 MARKET SHARE ANALYSIS 
               FIGURE 40 ESG REPORTING SOFTWARE MARKET SHARE ANALYSIS, 2023
               TABLE 173 ESG REPORTING SOFTWARE MARKET: DEGREE OF COMPETITION
     11.5 BRAND/PRODUCT COMPARISON 
               FIGURE 41 BRAND/PRODUCT COMPARISON
     11.6 COMPANY EVALUATION MATRIX: KEY PLAYERS, 2023 
             11.6.1 STARS
             11.6.2 EMERGING LEADERS
             11.6.3 PERVASIVE PLAYERS
             11.6.4 PARTICIPANTS
                       FIGURE 42 ESG REPORTING SOFTWARE MARKET: COMPANY EVALUATION MATRIX (KEY PLAYERS), 2023
             11.6.5 COMPANY FOOTPRINT: KEY PLAYERS, 2023
                       FIGURE 43 ESG REPORTING SOFTWARE MARKET: OVERALL COMPANY FOOTPRINT
                       TABLE 174 ESG REPORTING SOFTWARE MARKET: REGIONAL FOOTPRINT
                       TABLE 175 ESG REPORTING SOFTWARE MARKET: OFFERING FOOTPRINT
                       TABLE 176 ESG REPORTING SOFTWARE MARKET: ORGANIZATION SIZE FOOTPRINT
                       TABLE 177 ESG REPORTING SOFTWARE MARKET: VERTICAL FOOTPRINT
     11.7 COMPANY EVALUATION MATRIX: START-UPS/SMES, 2023 
             11.7.1 PROGRESSIVE COMPANIES
             11.7.2 RESPONSIVE COMPANIES
             11.7.3 DYNAMIC COMPANIES
             11.7.4 STARTING BLOCKS
                       FIGURE 44 ESG REPORTING SOFTWARE MARKET: COMPANY EVALUATION MATRIX (START-UPS/SMES), 2023
             11.7.5 COMPETITIVE BENCHMARKING: START-UPS/SMES, 2023
                       TABLE 178 ESG REPORTING SOFTWARE MARKET: KEY START-UPS/SMES, 2023
                       TABLE 179 ESG REPORTING SOFTWARE MARKET: COMPETITIVE BENCHMARKING OF KEY START-UPS/SMES, 2023
     11.8 COMPANY VALUATION AND FINANCIAL METRICS 
               FIGURE 45 COMPANY VALUATION AND FINANCIAL METRICS
     11.9 COMPETITIVE SCENARIO AND TRENDS 
             11.9.1 PRODUCT LAUNCHES AND ENHANCEMENTS
                       TABLE 180 ESG REPORTING SOFTWARE MARKET: PRODUCT LAUNCHES AND ENHANCEMENTS, MAY 2022–APRIL 2024
             11.9.2 DEALS
                       TABLE 181 ESG REPORTING SOFTWARE MARKET: DEALS, SEPTEMBER 2021–FEBRUARY 2024
 
12 COMPANY PROFILES (Page No. - 202)
     12.1 KEY PLAYERS 
(Business Overview, Products/Solutions/Services offered, Recent Developments, MnM View)*
             12.1.1 WOLTERS KLUWER
                       TABLE 182 WOLTERS KLUWER: BUSINESS OVERVIEW
                       FIGURE 46 WOLTERS KLUWER: COMPANY SNAPSHOT
                       TABLE 183 WOLTERS KLUWER: PRODUCTS/SOLUTIONS/SERVICES OFFERED
                       TABLE 184 WOLTERS KLUWER: PRODUCT LAUNCHES AND ENHANCEMENTS
                       TABLE 185 WOLTERS KLUWER: DEALS
             12.1.2 NASDAQ
                       TABLE 186 NASDAQ: BUSINESS OVERVIEW
                       FIGURE 47 NASDAQ: COMPANY SNAPSHOT
                       TABLE 187 NASDAQ: PRODUCTS/SOLUTIONS/SERVICES OFFERED
                       TABLE 188 NASDAQ: PRODUCT LAUNCHES
                       TABLE 189 NASDAQ: DEALS
             12.1.3 PWC
                       TABLE 190 PWC: BUSINESS OVERVIEW
                       FIGURE 48 PWC: COMPANY SNAPSHOT
                       TABLE 191 PWC: PRODUCTS/SOLUTIONS/SERVICES OFFERED
                       TABLE 192 PWC: DEALS
             12.1.4 WORKIVA
                       TABLE 193 WORKIVA: BUSINESS OVERVIEW
                       FIGURE 49 WORKIVA: COMPANY SNAPSHOT
                       TABLE 194 WORKIVA: PRODUCTS/SOLUTIONS/SERVICES OFFERED
                       TABLE 195 WORKIVA: PRODUCT ENHANCEMENTS
                       TABLE 196 WORKIVA: DEALS
             12.1.5 LSEG
                       TABLE 197 LSEG: BUSINESS OVERVIEW
                       FIGURE 50 LSEG: COMPANY SNAPSHOT
                       TABLE 198 LSEG: PRODUCTS/SOLUTIONS/SERVICES OFFERED
                       TABLE 199 LSEG: PRODUCT LAUNCHES
                       TABLE 200 LSEG: DEALS
             12.1.6 GREENSTONE
                       TABLE 201 GREENSTONE: BUSINESS OVERVIEW
                       TABLE 202 GREENSTONE: PRODUCTS/SOLUTIONS/SERVICES OFFERED
                       TABLE 203 GREENSTONE: DEALS
             12.1.7 DILIGENT
                       TABLE 204 DILIGENT: BUSINESS OVERVIEW
                       TABLE 205 DILIGENT: PRODUCTS/SOLUTIONS/SERVICES OFFERED
                       TABLE 206 DILIGENT: PRODUCT LAUNCHES
                       TABLE 207 DILIGENT: DEALS
             12.1.8 SPHERA
                       TABLE 208 SPHERA: BUSINESS OVERVIEW
                       TABLE 209 SPHERA: PRODUCTS/SOLUTIONS/SERVICES OFFERED
                       TABLE 210 SPHERA: PRODUCT LAUNCHES
                       TABLE 211 SPHERA: DEALS
             12.1.9 CORITY
                       TABLE 212 CORITY: BUSINESS OVERVIEW
                       TABLE 213 CORITY: PRODUCTS/SOLUTIONS/SERVICES OFFERED
                       TABLE 214 CORITY: DEALS
             12.1.10 INTELEX
                                   TABLE 215 INTELEX: BUSINESS OVERVIEW
                                   TABLE 216 INTELEX: PRODUCTS/SOLUTIONS/SERVICES OFFERED
                                   TABLE 217 INTELEX: PRODUCT LAUNCHES
*Details on Business Overview, Products/Solutions/Services offered, Recent Developments, MnM View might not be captured in case of unlisted companies.
     12.2 OTHER PLAYERS 
             12.2.1 NOVISTO
             12.2.2 EMEX
             12.2.3 IBM
             12.2.4 ANTHESIS
             12.2.5 DIGINEX
             12.2.6 BAIN & COMPANY
             12.2.7 KERAMIDA INC. INC.
             12.2.8 ISOMETRIX
             12.2.9 VERVANTIS
               12.2.10 ACCUVIO
     12.3 START-UPS/SMES 
             12.3.1 ESG FLO
             12.3.2 MEASURABL
             12.3.3 PLAN A
             12.3.4 SUSTAINLAB
             12.3.5 ESGGO
 
13 ADJACENT/RELATED MARKETS (Page No. - 247)
     13.1 INTRODUCTION 
             13.1.1 RELATED MARKETS
             13.1.2 LIMITATIONS
     13.2 ENVIRONMENT, HEALTH, AND SAFETY MARKET 
               TABLE 218 ENVIRONMENT, HEALTH, AND SAFETY MARKET, BY OFFERING, 2018–2023 (USD MILLION)
               TABLE 219 ENVIRONMENT, HEALTH, AND SAFETY MARKET, BY OFFERING, 2024–2029 (USD MILLION)
               TABLE 220 ENVIRONMENT, HEALTH, AND SAFETY MARKET, BY VERTICAL, 2018–2023 (USD MILLION)
               TABLE 221 ENVIRONMENT, HEALTH, AND SAFETY MARKET, BY VERTICAL, 2024–2029 (USD MILLION)
 
14 APPENDIX (Page No. - 250)
     14.1 DISCUSSION GUIDE 
     14.2 KNOWLEDGESTORE: MARKETSANDMARKETS’ SUBSCRIPTION PORTAL 
     14.3 CUSTOMIZATION OPTIONS 
     14.4 RELATED REPORTS 
     14.5 AUTHOR DETAILS 

This research study involved extensive secondary sources, directories, and databases, such as Bloomberg BusinessWeek, EconoTimes, and Factiva, to identify and collect information useful for this technical, market-oriented, and commercial ESG reporting software market study. The global ESG reporting software market size is obtained by evaluating its penetration among the major vendors and their offerings in this market. We interviewed a few startups and private companies to gain better visibility and in-depth knowledge of the market across regions. In addition, a few government associations, public sources, conferences, webinars, journals, magazines, articles, and MarketsandMarkets' internal repositories were referred to arrive at the closest/actual market size.

Secondary Research

We determined the market size of companies offering ESG reporting software based on secondary data available through paid and unpaid sources. It was also arrived at by analyzing the product portfolios of major companies and rating the companies based on their performance and quality.

In the secondary research process, various sources were referred to to identify and collect information for this study. Secondary sources included annual reports, press releases, and investor presentations of companies; white papers, journals, and certified publications; and articles from recognized authors, directories, and databases. The data was also collected from other secondary sources, such as journals, government websites, blogs, and vendors' websites. Additionally, the spending of various countries on ESG reporting software was extracted from the respective sources. We used secondary research to obtain the critical information related to the industry's value chain and supply chain to identify the key players based on solutions, services, market classification, and segmentation according to offerings of the major players, industry trends related to offerings, verticals, and regions, and the key developments from both market- and technology-oriented perspectives.

Primary Research

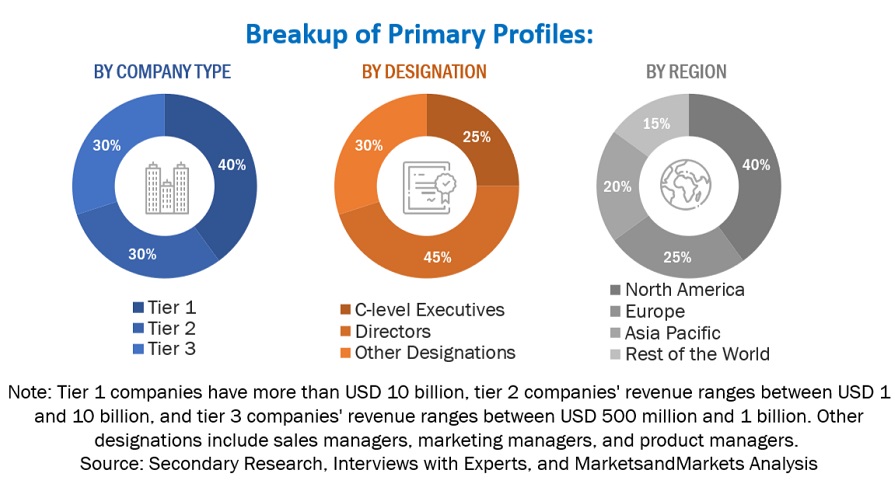
In the primary research process, various sources from the supply and demand sides were interviewed to obtain qualitative and quantitative information on the market. The primary sources from the supply side included various industry experts, including Chief Experience Officers (CXOs); Vice Presidents (VPs); directors from business development, marketing, and product development/innovation teams; related critical executives from ESG reporting software vendors, industry associations, and independent consultants; and key opinion leaders.

We conducted primary interviews to gather insights, such as market statistics, the latest trends disrupting the market, new use cases implemented, data on revenue collected from products and services, market breakups, market size estimations, market forecasts, and data triangulation. Primary research also helped us understand various trends related to technology, offerings, end users, and regions. Demand-side stakeholders, such as Chief Information Officers (CIOs), Chief Technology Officers (CTOs), Chief Security Officers (CSOs), and digital initiatives project teams, were interviewed to understand the buyer's perspective on suppliers, products, service providers, and their current use, which would affect the overall ESG reporting software market.
ESG Reporting Software Market Size, and Share

To know about the assumptions considered for the study, download the pdf brochure

Market Size Estimation

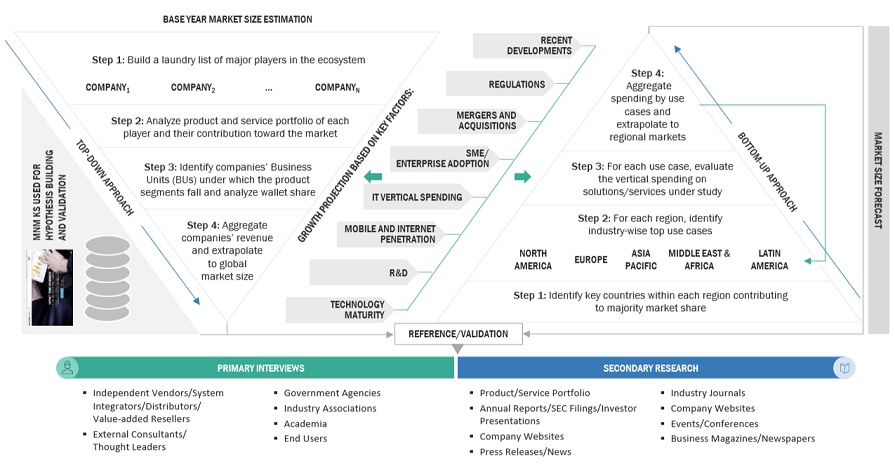
We used top-down and bottom-up approaches to estimate and forecast the ESG reporting software and other dependent submarkets. We deployed a bottom-up procedure to arrive at the overall market size using the revenues and offerings of key companies in the market. With data triangulation methods and validation through primary interviews, this study determined and confirmed the exact value of the overall parent market size. We used the overall market size in the top-down procedure to estimate the size of other individual markets via percentage splits of the market segments.

We used top-down and bottom-up approaches to estimate and validate the ESG reporting software market and other dependent subsegments.

The research methodology used to estimate the market size included the following details:

  • We identified key players in the market through secondary research, and their revenue contributions in respective regions were determined through primary and secondary research.
  • This procedure included studying top market players' annual and financial reports and extensive interviews for key insights from industry leaders, such as CEOs, VPs, directors, and marketing executives.
  • All percentage splits and breakups were determined using secondary sources and verified through primary sources.

All the possible parameters that affect the market covered in this research study have been accounted for, viewed in extensive detail, verified through primary research, and analyzed to get the final quantitative and qualitative data. This data is consolidated and added with detailed inputs and analysis from MarketsandMarkets.

ESG Reporting Software Market: Top-down and Bottom-up approaches
ESG Reporting Software Market Top Down and Bottom Up Approach

To know about the assumptions considered for the study, Request for Free Sample Report

Data Triangulation

After arriving at the overall market size, the market was split into several segments and subsegments—using the market size estimation processes as explained above. Where applicable, data triangulation and market breakup procedures were employed to complete the overall market engineering process and determine each market segment's and subsegment's exact statistics. The data was triangulated by studying several factors and trends from the demand and supply sides in the digital map market.

Market Definition

Considering the views of various sources and associations, the ESG (Environmental, Social, and Governance) reporting software market refers to the sector focused on providing software solutions to facilitate the measurement, monitoring, and reporting of an organization's performance in terms of environmental impact, social responsibility, and corporate governance.

The market for ESG reporting software has been proliferating in response to increasing regulatory requirements, investor demands for ESG disclosure, and broader societal expectations for corporate accountability and sustainability. As a result, numerous software providers have entered the market, offering various solutions tailored to the diverse needs of organizations across different industries and regions.

Key Stakeholders

  • ESG solution and service providers
  • Reselling companies
  • Third-party providers
  • Consultants/Consultancies/Advisory firms
  • Support and maintenance service providers
  • Information Technology (IT) infrastructure providers
  • System Integrators (SIs)
  • Governments and standardization bodies
  • Cloud providers
  • Regional associations
  • Independent software vendors
  • Value-added resellers and distributors

Report Objectives

  • To define, describe, and forecast the ESG reporting software market based on offering (solutions, services), rack unit, applications, form factor, type, organization size, vertical, and region
  • To provide detailed information about the major factors (drivers, opportunities, restraints, and challenges) influencing the growth of the market
  • To analyze the opportunities in the market for stakeholders by identifying the high-growth segments of the market
  • To forecast the market size concerning five regions-North America, Europe, Asia Pacific, the Middle East & Africa, and Latin America
  • To analyze the subsegments of the market concerning individual growth trends, prospects, and contributions to the overall market
  • To profile the key players of the market and comprehensively analyze their market size and core competencies
  • To track and analyze the competitive developments, such as product enhancements, product launches, acquisitions, partnerships, and collaborations, in the ESG reporting software market globally

Available customizations

With the given market data, MarketsandMarkets offers customizations per the company's specific needs. The following customization options are available for the report:

Product analysis

  • The product matrix provides a detailed comparison of each company's product portfolio.

Geographic analysis

  • Further breakup of the Asia Pacific market into countries contributing 75% to the regional market size
  • Further breakup of the North American market into countries contributing 75% to the regional market size
  • Further breakup of the Latin American market into countries contributing 75% to the regional market size
  • Further breakup of the Middle Eastern & African market into countries contributing 75% to the regional market size
  • Further breakup of the European market into countries contributing 75% to the regional market size

Company information

  • Detailed analysis and profiling of additional market players (up to 5)
Custom Market Research Services

We will customize the research for you, in case the report listed above does not meet with your exact requirements. Our custom research will comprehensively cover the business information you require to help you arrive at strategic and profitable business decisions.

Request Customization

Instant Answers with GPT - Ask Now!

Ask real questions. Get complete answers !
Report Code
TC 8523
Published ON
May, 2024
Choose License Type
BUY NOW
  • SHARE
X
Request Customization
Speak to Analyst
Speak to Analyst
OR FACE-TO-FACE MEETING
PERSONALIZE THIS RESEARCH
  • Triangulate with your Own Data
  • Get Data as per your Format and Definition
  • Gain a Deeper Dive on a Specific Application, Geography, Customer or Competitor
  • Any level of Personalization
REQUEST A FREE CUSTOMIZATION
LET US HELP YOU!
  • What are the Known and Unknown Adjacencies Impacting the ESG Reporting Software Market
  • What will your New Revenue Sources be?
  • Who will be your Top Customer; what will make them switch?
  • Defend your Market Share or Win Competitors
  • Get a Scorecard for Target Partners
CUSTOMIZED WORKSHOP REQUEST
+1-888-600-6441
  • Call Us
  • +1-888-600-6441 (Corporate office hours)
  • +1-888-600-6441 (US/Can toll free)
  • +44-800-368-9399 (UK office hours)
CONNECT WITH US
ABOUT TRUST ONLINE
©2024 MarketsandMarkets Research Private Ltd. All rights reserved
DMCA.com Protection Status Website Feedback