Preclinical Imaging Market Size, Share & Trends by Product Type (Optical Imaging, PET, SPECT, Optical Imaging Reagents, Contrast Agents, Nuclear Imaging Reagents), Application (Oncology, Neurology), End User (Pharmaceutical, Imaging Centers) - Global Forecast to 2029
Preclinical Imaging Market Size, Share & Trends
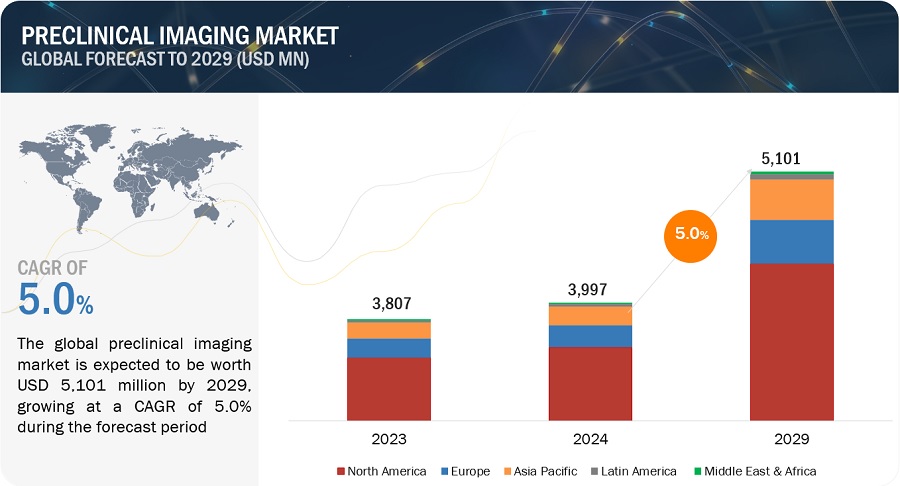
The size of global preclinical imaging market in terms of revenue was estimated to be worth $946 million in 2024 and is poised to reach $1,259 million by 2029, growing at a CAGR of 5.9% from 2024 to 2029. The comprehensive research encompasses an exhaustive examination of industry trends, meticulous pricing analysis, patent scrutiny, insights derived from conferences and webinars, identification of key stakeholders, and a nuanced understanding of market purchasing dynamics.
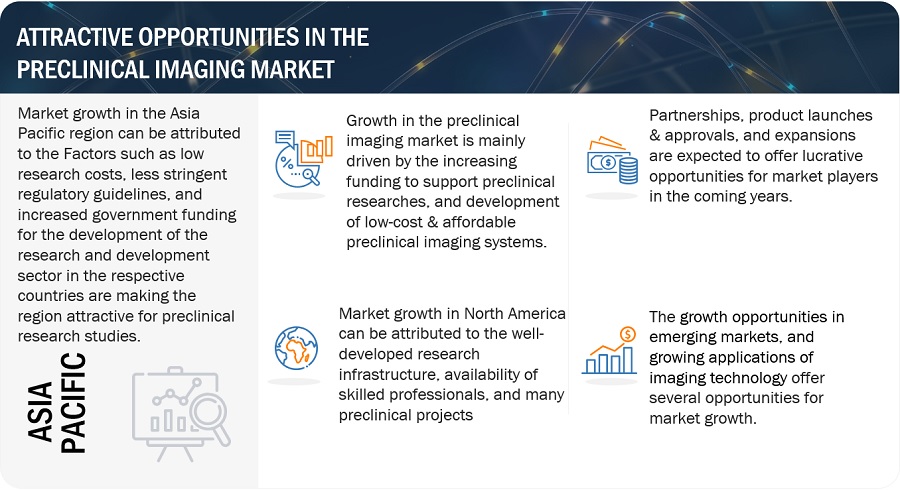
The growth in the preclinical imaging market is driven by development of low-cost & affordable preclinical imaging systems, the increasing funding to support preclinical researches, and increasing market demand for new drug development.
Preclinical Imaging Market Trends
To know about the assumptions considered for the study, Request for Free Sample Report
Preclinical Imaging Market Dynamics
DRIVER: Increasing market demand for non-invasive small animal imaging techniques
The increasing demand for non-invasive small animal imaging techniques is a significant driver for the growth and development of preclinical imaging. Preclinical imaging involves the use of imaging technologies to study disease processes and test potential treatments in animal models, primarily mice and rats, before they are used in humans.
Non-invasive imaging techniques reduce the need for euthanizing animals to study disease progression and treatment effects. This aligns with the principles of the 3Rs (Replacement, Reduction, and Refinement) in animal research, which aim to minimize animal use and suffering. It also allows for longitudinal studies, where the same animals can be imaged multiple times over the course of a study. This enables researchers to monitor disease progression and treatment responses in real-time, providing more comprehensive data compared to endpoint analyses.
The push towards non-invasive small animal imaging is driven by the need for ethical, efficient, and detailed preclinical research methods that provide valuable insights while reducing the reliance on invasive procedures. This trend is expected to continue driving advancements in preclinical imaging technologies and methodologies.
RESTRAINT: Strict regulations governing preclinical research
Strict regulations governing preclinical research can act as a restraint for preclinical imaging. Adhering to stringent regulatory requirements can be time-consuming and complex. Researchers must ensure that their imaging protocols and animal handling procedures meet all legal and ethical standards, which often involves extensive documentation, obtaining multiple approvals, and undergoing periodic inspections.
Regulatory compliance can significantly increase the costs of preclinical research. This includes costs associated with obtaining necessary certifications, conducting regular audits, training staff to adhere to regulations, and implementing and maintaining compliance systems. These additional financial burdens can limit the resources available for actual research activities and technology investments.
While strict regulations are essential to ensure the ethical treatment of animals and the integrity of research data, they also pose significant challenges and constraints for preclinical imaging. Balancing the need for rigorous oversight with the flexibility to innovate is crucial for advancing preclinical research and imaging technologies.
OPPORTUNITY: Increasing Adoption of Imaging Systems for Preclinical Purposes
The pharmaceutical and biotechnology industries are constantly seeking new drug candidates to address unmet medical needs. Preclinical imaging enhances the understanding of these potential drug candidates by visualizing their effects on living organisms. This capability helps identify promising candidates and discard those with unfavorable characteristics earlier in the drug development process, thereby saving time and resources. Additionally, the shift towards personalized medicine necessitates a deeper understanding of individual patients' conditions. Preclinical imaging can assess disease heterogeneity and customize treatment approaches, leading to more effective therapies.
Preclinical imaging techniques are typically non-invasive or minimally invasive, which benefits both research animals and the accuracy of the data collected. This non-invasive nature enables longitudinal studies, reducing the need to sacrifice animals at multiple time points.
Therefore, the increasing adoption of imaging systems for preclinical purposes is likely to drive market growth in the forecast period.
CHALLENGE: Technological and procedural limitations associated with standalone preclinical imaging systems
Standalone imaging systems are typically designed for a single imaging modality, such as MRI, PET, or CT. Each modality has its own strengths and limitations, and relying on just one can result in incomplete or less accurate data. For instance, MRI provides excellent soft tissue contrast but lacks functional information that PET can provide.
Combining data from different standalone imaging systems can be technically challenging and time-consuming. Researchers often need to manually align and correlate images from different modalities, which can introduce errors and reduce the overall accuracy of the results. Operating different standalone imaging systems requires specialized training and expertise. Ensuring that staff are proficient in using multiple modalities can be challenging and resource-intensive. Lack of expertise can lead to suboptimal use of the systems and affect the quality of the data collected.
Addressing these challenges requires investment in integrated imaging solutions, advanced data management systems, and comprehensive training programs to optimize the use of preclinical imaging technologies.
Preclinical Imaging Industry Ecosystem
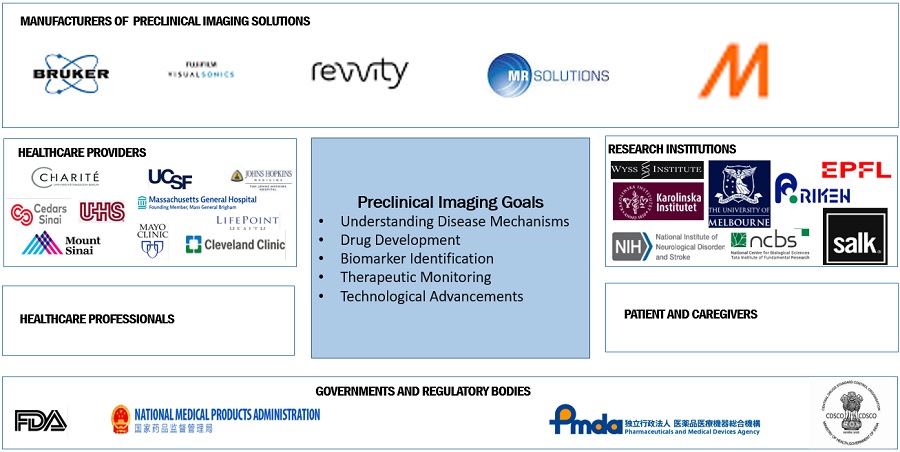
The preclinical imaging market ecosystem is a complex and multifaceted network involving various stakeholders, technologies, and processes.
The ecosystem comprises of Imaging Modalities and Technologies, Equipment Manufacturers, Software and Data Analysis Tools, Contract Research Organizations (CROs), Regulatory Bodies, Ethical and Animal Welfare Committees, Funding Agencies and Institutions, and Training and Education Providers.
Bioluminescent Imaging Reagents accounted for the largest share in the preclinical imaging industry in 2023, by preclinical optical imaging reagents.
Based on the technology used in optical imaging, the preclinical optical imaging reagents market has been categorized into two segments—bioluminescent and fluorescent imaging reagents. The bioluminescent imaging reagents segment is estimated to account for the largest share of the global preclinical optical imaging reagents market. Its large share is attributed to the wide use of bioluminescence imaging in small-animal preclinical research.
The oncology segment accounted for the largest share of the preclinical imaging industry, by application
Based on application, the preclinical imaging market is segmented into cardiology, neurology, oncology, immunology and inflammation, infectious diseases, and other applications. The oncology segment accounted for the largest share of the market in 2023, The development of new cancer therapies, including chemotherapy, radiotherapy, immunotherapy, and targeted therapies, benefits immensely from preclinical imaging. Imaging allows researchers to monitor tumor response to treatments, assess drug distribution and pharmacokinetics, and evaluate therapeutic efficacy in animal models.
The pharmaceutical & biotechnology companies are the largest end user in the brain preclinical imaging industry during the forecast period.
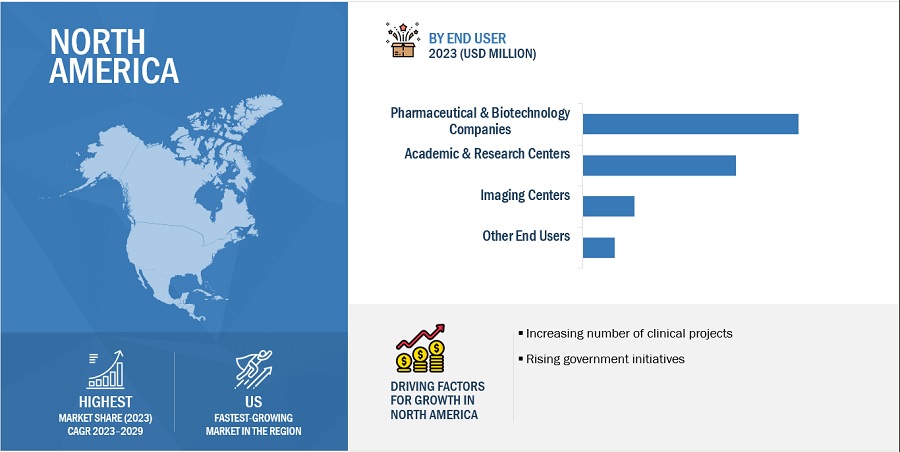
Based on end user, the preclinical imaging market is segmented into imaging centers, academic and research centers, pharmaceutical & biotechnology companies, and other end users. The pharmaceutical & biotechnology companies segment accounted for the largest share in the market in 2023. This rising demand in the pharmaceutical and biotech sectors can be attributed to the spread of emerging and re-emerging infectious diseases. Preclinical imaging is crucial for gaining a better understanding of pathogens and for aiding the development of new therapeutics and vaccines. Additionally, the ongoing experimentation on small animals and laboratory research activities have led to an increased demand for PET and SPECT imaging technologies, further fueling market growth.
North America accounted for the largest share of the preclinical imaging industry in 2023.
To know about the assumptions considered for the study, download the pdf brochure
Based on the region, the preclinical imaging market is segmented into North America, Europe, Asia Pacific, Latin America, and Middle East and Africa. North America accounted for the largest share of the preclinical imaging market in 2023. The major drivers of the market in North America include a well-developed research infrastructure, the availability of skilled professionals, a high volume of preclinical projects, and the higher adoption rates of advanced technological devices. Additionally, government initiatives are fostering new clinical research and development projects in the region. For instance, the Canadian R&D tax credit program is a government initiative that significantly boosts R&D efforts in the country.
Prominent players in preclinical imaging market include Medikor (US), Trifoil Imaging (US), IVIM Technology Corp. (South Korea), Cubresa, Inc. (Canada), Berthold Technolgies GMBH & CO.KG (Germany), Miltenyi Biotech GmbH (Germany), AI4R (France), Bruker Corporation (US), Aspect Imaging Limited (US), Li-Cor Biosciences (US), ICONEUS (Paris), Advanced Molecular Vision (UK), MR Solutions (UK), Mediso Ltd. (UK), Sofie (US), Fujifilm Visual Sonics (Canada), MILABS B.V. (Netherlands), Viewworks (Korea), Kub Technologies (US), and Revvity, Inc. (US).
Scope of the Preclinical Imaging Industry
|
Report Metric |
Details |
|
Market Revenue in 2024 |
$946 million |
|
Projected Revenue by 2029 |
$1,259 million |
|
Revenue Rate |
Poised to Grow at a CAGR of 5.9% |
|
Market Driver |
Increasing market demand for non-invasive small animal imaging techniques |
|
Market Opportunity |
Increasing Adoption of Imaging Systems for Preclinical Purposes |
The study categorizes the preclinical imaging market to forecast revenue and analyze trends in each of the following submarkets:
By Product Type
-
Imaging systems
-
Optical imaging systems
- Bioluminescence imaging systems
- Fluorescence imaging systems
- Other optical imaging systems
-
Nuclear imaging systems
-
micro-pet imaging systems
- Standalone pet imaging systems
- Pet/CT imaging systems
- Pet/MRI imaging systems
-
Micro-spect imaging systems
- standalone spet imaging systems
- spet/ct imaging systems
- spet/ MRI imaging systems
- Trimodality (spect/pet/ct) imaging systems
-
micro-pet imaging systems
- Micro-MRI systems
- Micro-ultrasound systems
- Micro-ct systems
- Photoacoustic imaging systems
- Magnetic particle imaging (mpi) systems
-
Optical imaging systems
-
Reagents
-
Preclinical optical imaging reagents
-
Preclinical bioluminescent imaging reagents
- Luciferins
- Coelenterazne
- Furimazine
-
Preclinical fluorescent imaging reagents
- Green fluorescent proteins
- Red fluorescent proteins
- Infrared dyes
-
Preclinical bioluminescent imaging reagents
-
Preclinical nuclear imaging reagents
-
Preclinical pet tracers
- Fluorine-18-based preclinical pet tracers
- Carbon-11-based preclinical pet tracers
- Copper-64-based preclinical pet tracers
- Other pet tracers
-
Preclinical spect probes
- Technetium-99m-based preclinical spect probes
- Iodine-131-based preclinical spect probes
- Gallium-67-based preclinical spect probes
- Thallium-201-based preclinical spect probes
- Other spect probes
-
Preclinical MRI contrast agents
- Gadolinium-based preclinical contrast agents
- Iron-based preclinical contrast agents
- Manganese-based preclinical contrast agents
- Preclinical ultrasound contrast agents
-
Preclinical CT contrast agents
- Iodine-based preclinical ct contrast agents
- Barium-based preclinical ct contrast agents
- Gold nanoparticles
- Gastrografin-based preclinical ct contrast agents
-
Preclinical pet tracers
-
Preclinical optical imaging reagents
- Software
By Application
- Oncology
- Cardiology
- Neurology
- Infectious diseases
- Immunology & inflammation
- Other Applications
By End User
- Pharmaceutical & biotechnology companies
- Academic & research centers
- Imaging centers
- Other end users
By Region
-
North America
- US
- Canada
-
Europe
- Germany
- UK
- France
- Italy
- Spain
- Rest of Europe
-
Asia Pacific
- Japan
- China
- India
- Rest of Asia Pacific
-
Latin America
- Brazil
- Mexico
- Rest of Latin America
-
Middle East & Africa
- GCC Countries
- Rest of the Middle East & Africa
Frequently Asked Questions (FAQ):
What is the projected market revenue value of the global preclinical imaging market?
The global preclinical imaging market boasts a total revenue value of $1,259 million by 2029.
What is the estimated growth rate (CAGR) of the global preclinical imaging market?
The global preclinical imaging market has an estimated compound annual growth rate (CAGR) of 5.9% and a revenue size in the region of $946 million in 2024. .
To speak to our analyst for a discussion on the above findings, click Speak to Analyst
This market research study involved the extensive use of secondary sources, directories, and databases to identify and collect information useful for this technical, market-oriented, and financial study of the preclinical imaging market. In-depth interviews were conducted with various primary respondents, including key industry participants, subject-matter experts (SMEs), C-level executives of key market players, and industry consultants, among other experts, to obtain and verify critical qualitative and quantitative information and to assess market prospects. The size of the preclinical imaging market was estimated through various secondary research approaches and triangulated with inputs from primary research to arrive at the final market size.
Secondary Research
The secondary research process involved the widespread use of secondary sources, directories, databases (such as Bloomberg Businessweek, Factiva, and D&B Hoovers), white papers, annual reports, company house documents, investor presentations, and SEC filings of companies. Secondary research was used to identify and collect information useful for the extensive, technical, market-oriented, and commercial study of the preclinical imaging market. It was also used to obtain important information about the key players and market classification and segmentation according to industry trends to the bottom-most level and key developments related to market and technology perspectives. A database of the key industry leaders was also prepared using secondary research.
Primary Research
Extensive primary research was conducted after acquiring basic knowledge about the global preclinical imaging market scenario through secondary research. Several primary interviews were conducted with market experts from both the demand side (Hospital personnel, department heads, hospital directors, corporate personnel) and supply side (such as C-level and D-level executives, technology experts, software developers, marketing and sales managers, among others) across five major regions—North America, Europe, the Asia Pacific, Latin America, Middle East, and Africa. This primary data was collected through questionnaires, e-mails, online surveys, personal interviews, and telephonic interviews.
Breakdown of Primary Interviews
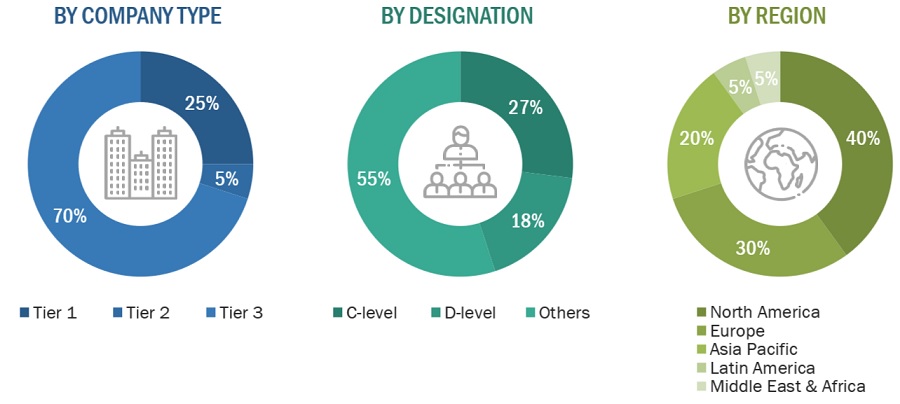
Note 1: Tiers are defined based on the total revenues of companies. As of 2023, Tier 1 = >USD 1 billion, Tier 2 = USD 500 million to USD 1 billion, and Tier 3 = <USD 500 million.
To know about the assumptions considered for the study, download the pdf brochure
Market Size Estimation
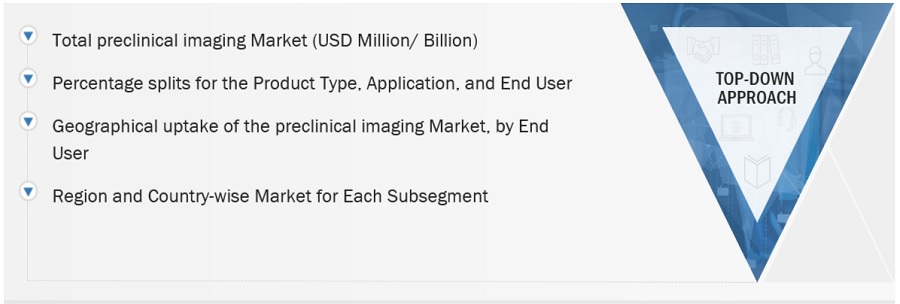
Both top-down and bottom-up approaches were used to estimate and validate the total size of the global preclinical imaging market. These methods were also used extensively to estimate the size of various subsegments in the market. The research methodology used to estimate the market size includes the following:
- Key players in the global preclinical imaging market were identified through secondary research, and their global market shares were determined through primary and secondary research
- The research methodology included the study of the annual and quarterly financial reports and regulatory filings, data books of major market players, and interviews with industry experts for detailed market insights.
- All percentage shares, splits, and breakdowns for the global preclinical imaging market were determined by using secondary sources and verified through primary sources.
- All key macro indicators affecting the revenue growth of market segments and subsegments have been accounted for, viewed in extensive detail, verified through primary research, and analyzed to get validated and verified quantitative and qualitative data.
- The gathered market data was consolidated and added with detailed inputs and analysis and presented in this report.
Global Preclinical Imaging Market: Bottom-Up Approach

To know about the assumptions considered for the study, Request for Free Sample Report
Global Preclinical Imaging Market: Top-Down Approach
Data Triangulation
After arriving at the overall market size, from the market size estimation process explained above, the brain computer interface market was split into segments and subsegments. To complete the overall market engineering process and to arrive at the exact statistics for all segments and subsegments, data triangulation and market breakdown procedures were employed, wherever applicable. The data was triangulated by studying various factors and trends from both the demand and supply sides in the preclinical imaging market.
Market Definition:
Preclinical imaging involves the application of molecular imaging for the assessment of anatomical, physiological, and functional parameters in live animal models during preclinical studies. Preclinical imaging systems and reagents are utilized to visualize living animals in order to assess the safety and efficacy of novel drug procedures or other medical treatments for human applications. During preclinical studies, a variety of different imaging modalities are utilized, such as optical imaging systems, nuclear imaging systems (micro-PET and micro-SPECT), micro-MRI, micro-ultrasound systems, and micro-CT imaging systems.
Key Stakeholders:
- Preclinical Imaging Instrument Manufacturers, Suppliers, and Imaging Software Providers
- Pharmaceutical and Biotechnology Companies
- Preclinical Imaging Reagent Manufacturers and Suppliers
- Contract Research Organizations (CROs)
- Research and Development (R&D) Companies
- Government Research Laboratories
- Independent Research Laboratories
- Government and Independent Regulatory Authorities
- Medical Research Laboratories
- Academic Medical Institutes and Universities
- Market Research and Consulting Service Providers
Report Objectives
- To define, describe, and forecast the preclinical imaging market by product type, application, end user, and region
- To provide detailed information regarding the major factors influencing the market growth (such as drivers, restraints, opportunities, and challenges)
- To strategically analyze micromarkets1 with respect to individual growth trends, prospects, and contributions to the overall market
- To analyze the opportunities in the market for stakeholders and provide details of the competitive landscape for preclinical imaging market leaders
- To profile the key players in the market and comprehensively analyze their market shares and core competencies
- To forecast the size of the market segments with respect to five main regions: North America, the Asia Pacific, Europe, Latin America, and the Middle East & Africa
- To track and analyze competitive developments, such as partnerships, acquisition, product launches & approvals, and expansions
- To benchmark players within the preclinical imaging market using the Competitive Evaluation Matrix, which analyzes market players on various parameters within the broad categories of business strategy, market share, and product offering
Available Customizations:
With the given market data, MarketsandMarkets offers customizations as per the company’s specific needs. The following customization options are available for the report:
Additional Company Profiling
- Detailed analysis and profiling of additional market players (up to 5)
Geographic Analysis
- Further breakdown of the Rest of Europe Preclinical Imaging market into Switzerland, Russia, and others
- Further breakdown of the Rest of Asia Pacific Preclinical Imaging market into South Korea, Singapore, and others


 Generating Response ...


Growth opportunities and latent adjacency in Preclinical Imaging Market