Wire-to-Board Connector Market by Pitch Size (0.8, 1.0, 1.25, 1.27, 2.0, 2.5, 2.54, 3.0, 3.3, 3.96, 5, 7.92, and 10.16), Style (Accessory, Header, Housing, Plug, Receptacle, and Socket), Application, and Geography - Global Forecast to 2022


The wire-to-board connector market was valued at USD 3.55 Billion in 2015 and is expected to reach USD 4.73 Billion by 2022, at a CAGR of 4.18% between 2016 and 2022. The most significant factor driving the rising demand for high-speed connectivity and transmission bandwidth as well as low and stable raw material cost required for the manufacturing which, in turn, is leading to the rise in demand for wire-to-board connectors. Growing demand for computers and other communication devices, and mainstream adoption of IoT are the other factors driving the growth of the market. For the study, the base year considered is 2015, and the market forecast provided is between 2016 and 2022.
The prime objectives of this report can be summarized in the following points.
- To study global wire-to-board connector market -statistics with detailed classification and splits by market size and growth rate
- To analyze the market structure by identifying various subsegments that include market by type/style, pitch size, application, and geographic region
- To determine and forecast the market size of wire-to-board connectors, in terms of value, with respect to four geographic region, the Americas, Europe, APAC, and RoW
- To weigh the impact analysis of the dynamics such as drivers, restraints, opportunities, and challenges for the growth of the market, along with their impact in the short-, medium-, and long-term landscapes
- To estimate the wire-to-board connector market with respect to various styles used from technical and market-oriented perspectives
- To study the competitive intelligence from the company profiles, developments, upcoming trends and technologies, revenue growth strategies, and industry activities
- To analyze the key players in the wire-to-board connector market, which include an analysis of key developments and product portfolio
The wire-to-board connector market was valued at USD 3.55 Billion in 2015 and is expected to reach USD 4.73 Billion by 2022, at a CAGR of 4.18% between 2016 and 2022. The growth of the market is driven by the factors such as the demand for high-speed connectivity and transmission bandwidth and low and stable raw material cost required for the manufacturing. The wire-to-board connector design ranges from miniature to large and heavy-duty industrial connectors and also satisfies the economical requirements. This simplifies the issues related to manufacturing, maintenance, and repair where it can rapidly replace specific, affected subsystems, thereby reducing machine downtimes.
The wire-to-board connector market has different style and pitch size for various applications. The connector by styles includes accessory, header, housing, plug, receptacle, and socket. Among all these, the housing market is the third-largest market and is expected grow at the highest CAGR during the forecast period.
The wire-to-board connector pitch size market can be segmented into 12 different sizes, varying from 0.8mm to 10.16mm. These connectors are having various applications defined by their pitch size; for instance, 0.8 mm connectors are mostly used in communication (router), IP phone instrumentation industries (office equipment and test and measurement), and so on. 2.54mm pitch size connectors held the largest market size in 2015.
Furthermore, the fastest-growing applications and the major consumers of the wire-to-board connectors are data/telecom and automotive sectors. The increasing number of data centers, in turn, is driving the market. The connectors used in data/telecom sectors would experience a huge growth in the near future as potential that IoT sector holds with a variety of applications.
The APAC region accounted for the largest share of the total wire-to-board connector market in 2016 and is also expected to grow at the highest rate between 2016 and 2022. The market in this region is rapidly growing with IoT as a major segment which mainly focuses on the control and process control levels and requires embedded processors at the field level.
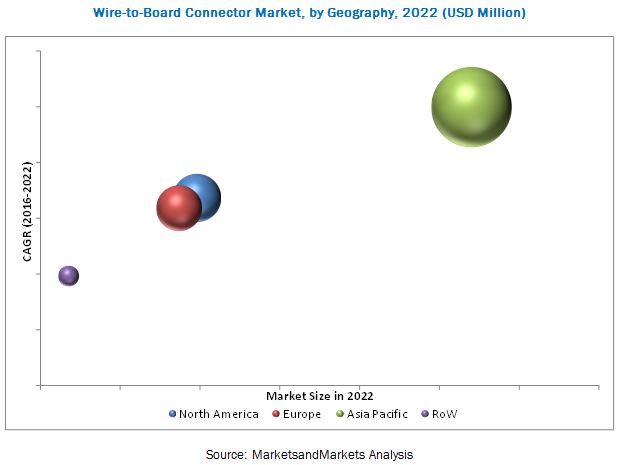
The speedy growth of computer, communication, and consumer electronics brands is the factor inhibiting the growth of this market. Furthermore, the APAC region has emerged as a major manufacturing hub for the consumer electronic industry and deployed a large number of networks; this has led to account for the largest market share in terms of the value.
However, growth in wireless networking systems is the main challenging factor for this wire-to-board connector market in the near future. The key players in the market are TE Connectivity (Switzerland), Molex Incorporated (US), Amphenol Corporation (U.S.), Samtec, Inc. (U.S.), Japan aviation Electronic Industry, Ltd. (Japan), and Kyocera Corp. (Japan), among others.
To speak to our analyst for a discussion on the above findings, click Speak to Analyst
 Exclusive indicates content/data unique to MarketsandMarkets and not available with any competitors.
Table of Contents
1 Introduction (Page No. - 14)
1.1 Objectives of the Study
1.2 Market Definition
1.3 Study Scope
1.3.1 Markets Covered
1.3.2 Geographic Scope
1.4 Currency & Years Considered for Study
1.5 Market Stakeholders
2 Research Methodology (Page No. - 18)
2.1 Market Size Estimation
2.2 Actual Research Methodology
2.3 Research Data
2.3.1 Secondary Data
2.3.1.1 Key Data From Secondary Sources
2.3.2 Primary Data
2.3.2.1 Key Data From Primary Sources
2.3.2.2 Key Industry Insights
2.3.2.3 Breakdown of Primaries
2.4 Market Share Estimation
2.4.1 Bottom-Up Approach
2.4.2 Top-Down Approach
2.4.3 Market Share Estimation
2.5 Market Breakdown and Data Triangulation
2.6 Research Assumptions
3 Market Overview (Page No. - 36)
3.1 Introduction
3.2 Market Dynamics
3.2.1 Drivers
3.2.1.1 Increasing Internet Penetration and Data Traffic
3.2.1.2 Growing Demand for Smartphones and Other Connecting Device
3.2.1.3 Mainstream Adoption of Cloud Computing
3.2.2 Restraints
3.2.2.1 Increasing Network Complexity
3.2.3 Opportunities
3.2.3.1 Introduction of Smaller, Cheaper, and Energy Efficient Transceivers
3.2.3.2 Commercialization of IoT
3.2.3.3 Deployment of VOIP, LTE, and 5G Network
3.2.3.4 Extension of Network in Developing Countries
3.2.4 Challenges
3.2.4.1 Continuous Optimization of Component Size
4 Industry Trends (Page No. - 51)
4.1 Introduction
4.2 Value Chain Analysis
4.3 Porter’s Five Forces Analysis
4.3.1 Threat of New Entrants
4.3.2 Threat of Substitutes
4.3.3 Bargaining Power of Suppliers
4.3.4 Bargaining Power of Buyers
4.3.5 Competitive Rivalry
5 Market, By Style (Page No. - 60)
5.1 Introduction
5.2 Accessory
5.3 Header
5.4 Housing
5.5 Plug
5.6 Receptacle
5.7 Socket
6 Market, By Pitch Size (Page No. - 69)
6.1 Introduction
6.2 0.8mm
6.3 1.0mm
6.4 1.25mm
6.5 1.27mm
6.6 2.0mm
6.7 2.5mm
6.8 2.54mm
6.9 3.0mm
6.10 3.3mm
6.11 3.96mm
6.12 5.0mm
6.13 7.92mm
6.14 10.16mm
7 Market, By Applications (Page No. - 93)
7.1 Introduction
7.2 Computer & Peripherals
7.3 Medical
7.4 Industrial & Instrumentation
7.5 Data & Telecom
7.6 Automotive
7.7 Aerospace & Defense
7.8 Others
8 Market, By Geography (Page No. - 102)
8.1 Introduction
8.2 Americas
8.3 Europe
8.4 Asia-Pacific
8.5 RoW
9 Competitive Landscape (Page No. - 117)
9.1 Overview
9.2 Market Share Analysis
9.3 Competitive Scenario
10 Company Profiles (Page No. - 124)
10.1 Molex Incorporated
10.1.1 Business Overview
10.1.2 Products Offered
10.1.3 Recent Developments
10.1.4 SWOT Analysis
10.1.5 MnM View
10.2 Te Connectivity Ltd.
10.2.1 Business Overview
10.2.2 Products Offered
10.2.3 Recent Developments
10.2.4 SWOT Analysis
10.2.5 MnM View
10.3 Amphenol Corporation
10.3.1 Business Overview
10.3.2 Products Offered
10.3.3 Recent Developments
10.3.4 SWOT Analysis
10.3.5 MnM View
10.4 Samtec, Inc.
10.4.1 Business Overview
10.4.2 Products Offered
10.4.3 Recent Developments
10.4.4 MnM View
10.5 Japan Aviation Electronics Industry, Ltd.
10.5.1 Business Overview
10.5.2 Products Offered
10.5.3 Recent Developments
10.5.4 SWOT Analysis
10.5.5 MnM View
10.6 C&K Components, Inc.
10.6.1 Business Overview
10.6.2 Products Offered
10.6.3 Recent Developments
10.6.4 MnM View
10.7 Kyocera Corp.
10.7.1 Business Overview
10.7.2 Products Offered
10.7.3 Recent Developments
10.7.4 SWOT Analysis
10.7.5 MnM View
10.8 J.S.T. MFG. Co. Ltd.
10.8.1 Business Overview
10.8.2 Products Offered
10.8.3 Recent Developments
10.8.4 SWOT Analysis
10.8.5 MnM View
10.9 Harting Technology Group.
10.9.1 Business Overview
10.9.2 Products Offered
10.9.3 Recent Developments
10.9.4 MnM View
10.10 Earni Group
10.10.1 Business Overview
10.10.2 Products Offered
10.10.3 Recent Developments
10.11 Phoenix Contact GmbH & Co. Kg
10.11.1 Business Overview
10.11.2 Products Offered
10.11.3 Recent Developments
10.11.4 MnM View
10.12 Wago Holding GmbH
10.12.1 Business Overview
10.12.2 Products Offered
10.12.3 Recent Developments
10.12.4 MnM View
11 Appendix (Page No. - 152)
11.1 Insights of Industry Experts
11.2 Discussion Guide
11.3 Introducing RT: Real-Time Market Intelligence
11.4 Available Customizations
11.5 Related Reports
List of Tables (64 Tables)
Table 3.1 Connector Market vs Wire-To-Board Connector Market, 2015–2022 (USD Million)
Table 3.2 Impact Analysis of Market Drivers
Table 3.3 Impact Analysis of Market Restraints
Table 3.4 Impact Analysis of Market Opportunities
Table 3.5 Impact Analysis of Market Challenges
Table 5.1 Connector Market Size By Type (USD Million)
Table 5.2 Market for Accessories, By Pitch Size (USD Million)
Table 5.3 Market for Headers, By Pitch Size (USD Million)
Table 5.4 Market for Housings, By Pitch Size (USD Million)
Table 5.5 Market for Plugs, By Pitch Size (USD Million)
Table 5.6 Market for Receptacles, By Pitch Size (USD Million)
Table 5.7 Market for Sockets, By Pitch Size (USD Million)
Table 6.1 Market, By Pitch Size (USD Million)
Table 7.1 Wire-To-Board Market, By Application, 2015–2022 (USD Million)
Table 7.2 Market for Computers & Peripherals Applications, By Type, 2015–2022 (USD Million)
Table 7.3 Market for Computers & Peripherals Applications, By Pitch Size, 2015–2022 (USD Million)
Table 7.4 Market for Medical Applications, By Type, 2015–2022 (USD Million)
Table 7.5 Market for Medical Applications, By Pitch Size, 2015–2022 (USD Million)
Table 7.6 Market for Industrial & Instrumentation Applications, By Type, 2015–2022 (USD Million)
Table 7.7 Market for Industrial & Instrumentation Applications, By Pitch Size, 2015–2022 (USD Million)
Table 7.8 Market for Data/Telecom Applications, By Type, 2015–2022 (USD Million)
Table 7.9 Market for Data/Telecom Applications, By Pitch Size, 2015–2022 (USD Million)
Table 7.10 Market for Automotive Applications, By Type, 2015–2022 (USD Million)
Table 7.11 Market for Automotive Applications, By Pitch Size, 2015–2022 (USD Million)
Table 7.12 Market for Aerospace and Defense Applications, By Type, 2015–2022 (USD Million)
Table 7.13 Market for Aerospace and Defense Applications, By Pitch Size, 2015–2022 (USD Million)
Table 7.14 Market for Other Applications, By Type, 2015–2022 (USD Million)
Table 7.15 Market for Other Applications, By Pitch Size, 2015–2022 (USD Million)
Table 8.1 Connector Market, By Geography, 2015–2022 (USD Million)
Table 8.2 Market in the Americas, By Application, 2015–2022 (USD Million)
Table 8.3 Market for Computers & Peripherals Applications in the Americas, By Type, By 2015–2022 (USD Million)
Table 8.4 Market for Medical Applications in the Americas, By Type, 2015–2022 (USD Million)
Table 8.5 Market for Industrial & Instrumentation Applications in the Americas, By Type, 2015–2022 (USD Million)
Table 8.6 Market for Data/Telecom Applications in the Americas, By Type, 2015–2022 (USD Million)
Table 8.7 Market for Automotive Applications in the Americas, By Type, 2015–2022 (USD Million)
Table 8.8 Market for Aerospace & Defense Applications in the Americas, By Type, 2015–2022 (USD Million)
Table 8.9 Market for Other Applications in the Americas, By Type, 2015–2022 (USD Million)
Table 8.10 Market in Europe, By Application, 2015–2022 (USD Million)
Table 8.11 Market for Computers & Peripherals Applications in Europe, By Type, 2015–2022 (USD Million)
Table 8.12 Market for Medical Applications in Europe, By Type, 2015–2022 (USD Million)
Table 8.13 Market for Industrial & Instrumentation Applications in Europe, By Type, 2015–2022 (USD Million)
Table 8.14 Market for Data/Telecom Applications in Europe, By Type, 2015–2022 (USD Million)
Table 8.15 Market for Automotive Applications in Europe, By Type, 2015–2022 (USD Million)
Table 8.16 Market for Aerospace & Defense Applications in Europe, By Type, 2015–2022 (USD Million)
Table 8.17 Market for Other Applications in Europe, By Type, 2015–2022 (USD Million)
Table 8.18 Market in APAC, By Application, 2015–2022 (USD Million)
Table 8.19 Market for Computers & Peripherals Applications in APAC, By Type, 2015–2022 (USD Million)
Table 8.20 Market for Medical Applications in APAC, By Type, 2015–2022 (USD Million)
Table 8.21 Market for Industrial & Instrumentation Applications in APAC, By Type, 2015–2022 (USD Million)
Table 8.22 Market for Data/Telecom Applications in APAC, By Type, 2015–2022 (USD Million)
Table 8.23 Market for Automotive Applications in APAC, By Type, 2015–2022 (USD Million)
Table 8.24 Market for Aerospace & Defense Applications in APAC, By Type, 2015–2022 (USD Million)
Table 8.25 Market for Other Applications in APAC, By Type, 2015–2022 (USD Million)
Table 8.26 Market in RoW, By Application, 2015–2022 (USD Million)
Table 8.27 Market for Computers & Peripherals Applications in RoW, By Type, 2015–2022 (USD Million)
Table 8.28 Market for Medicals Applications in RoW, By Type, 2015–2022 (USD Million)
Table 8.29 Market for Industrial & Instrumentation Applications in RoW, By Type, 2015–2022 (USD Million)
Table 8.30 Market for Data/Telecom Applications in RoW, By Type, 2015–2022 (USD Million)
Table 8.31 Market for Automotive Applications in RoW, By Type, 2015–2022 (USD Million)
Table 8.32 Market for Aerospace & Defense Applications in RoW, By Type, 2015–2022 (USD Million)
Table 8.33 Market for Other Applications in RoW, By Type, 2015–2022 (USD Million)
Table 9.1 Competitive Landscape Table- 2015
Table 9.2 Competitive Landscape Table- 2014
Table 9.3 Competitive Landscape Table- 2013
List of Figures (27 Figures)
Figure 2.1 Research Methodology
Figure 3.1 Market Dynamics of the Wire-To-Board Connector Market
Figure 4.1 Value Chain Analysis of the Connector Market
Figure 4.2 Bargaining Power of Suppliers
Figure 4.3 Bargaining Power of Buyers
Figure 4.4 Threat of New Entrant
Figure 4.5 Threat of Substitutes
Figure 4.6 Degree of Competition
Figure 4.7 Impact Analysis of Porters 5 Forces
Figure 5.1 Market, By Type (USD Million)
Figure 6.1 Market, By Pitch Size (USD Million)
Figure 6.2 Market for 0.8mm Pitch Size (USD Million)
Figure 6.3 Market for 1.0mm Pitch Size (USD Million)
Figure 6.4 Wire to Board Connector Market, for 1.25mm Pitch Size (USD Million)
Figure 6.5 Wire to Board Connector Market, for 1.27mm Pitch Size (USD Million)
Figure 6.6 Wire to Board Connector Market, for 2.0mm Pitch Size (USD Million)
Figure 6.7 Wire to Board Connector Market, for 2.5mm Pitch Size (USD Million)
Figure 6.8 Wire to Board Connector Market, for 2.54mm Pitch Size (USD Million)
Figure 6.9 Wire to Board Connector Market, for 3.3mm Pitch Size (USD Million)
Figure 6.10 Wire to Board Connector Market, for 3.96mm Pitch Size (USD Million)
Figure 6.11 Wire to Board Connector Market, for 5.0mm Pitch Size (USD Million)
Figure 6.12 Wire to Board Connector Market, for 7.92mm Pitch Size (USD Million)
Figure 6.13 Wire to Board Connector Market, for 10.16mm Pitch Size (USD Million)
Figure 7.1 Market for Applications, By Type 2015–2022 (USD Million)
Figure 7.2 Market for Applications, By Pitch Size 2015–2022 (USD Million))
Figure 8.1 Market, By Geography, 2015–2022 (USD Million)
Figure 9.1 Market Share Analysis
The sizing of the wire-to-board connector market has been done by top-down and bottom-up methods. The bottom-up approach has been employed to arrive at the overall size of the wire-to-board connector market from revenues of the key players (companies) and their share in the market. In the top-down approach, calculations are based on considering the overall connector market as the parent market and then giving percentage split to arrive at the overall connector market size. For the calculation of specific market segments, the most appropriate parent market size has been used to implement the top-down approach as well as different paid as well as non-paid primary and secondary sources have been used.
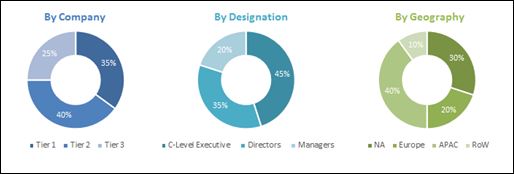
In the process of determining and verifying the market size for several segments and subsegments, data has been gathered through secondary research such as company websites, articles, and associations (Electronic Components Industry Association, Fibre Channel Industry Association), and extensive primary interviews conducted with key opinion leaders. The break-up of the profiles of primary participants is given in the chart below:
To know about the assumptions considered for the study, download the pdf brochure
The key players in the wire-to-board connector market are TE connectivity (Switzerland), Molex Incorporated (U.S.), Amphenol Corporation (U.S.), Samtec, Inc. (U.S.), Japan Aviation Electronic Industry, Ltd. (Japan), and Kyocera Corp. (Japan), among others.
Target Audience:
- Raw material suppliers
- Connector manufacturers
- Wire harness and cable assemblers
- Communication network providers
- Connector distributors and traders
- End users from all industries
- System/network integrators
- Government and other regulatory bodies
- Research institutes and organizations
- Market research and consulting firms
“Study answers several questions for the stakeholders, primarily which market segments to focus in the next two to five years (depends on the range of forecast period) for prioritizing the efforts and investments.”
Scope of the Report:
The market covered in this report has been segmented as follows:
Wire-to-Board Connector Market, by Style:
- Accessory
- Header
- Housing
- Plug
- Receptacle
- Socket
Wire-to-Board Connector Market, by Pitch Size:
- 0.8mm
- 1.0mm
- 1.25mm
- 1.27mm
- 2.0mm
- 2.5mm
- 2.54mm
- 3.3mm
- 3.96mm
- 5.0mm
- 7.92mm
- 10.16mm
Wire-to-Board Connector Market, by Application:
- Computer and Peripherals
- Medical
- Industrial and Instrumentation
- Data/Telecom
- Automotive
- Aerospace and Defense
- Others
Wire-to-Board Connector Market, by Geography:
- North America
- Europe
- Asia-Pacific
- Rest of the World
Available Customizations:
- Further breakdown of the style segment, by pitch size, application, and geography
- Further breakdown of the pitch size segment, by style, application, and geography
- Further breakdown of the geography segment, by pitch size, and style
- Detailed analysis and profiling of additional market players on the basis of various blocks of the value chain


Growth opportunities and latent adjacency in Wire-to-Board Connector Market