Vital Signs Monitoring Market - Landscape Analysis of Blood Pressure Monitoring Devices, Pulse Oximeters and Temperature Monitoring Devices - Forecasts up to 2018


The global vital signs monitoring market includes emergency support and care services and devices, which can be used not only at clinics, but also at a patient’s home. The most significant healthcare trend witnessed recently is the shift of treatment from hospitals to home in order to gain a cost advantage and reduce hospital expenditure. The move from treatment to proactive monitoring is also opening up new opportunities for home monitoring devices. Patients prefer home monitoring equipment over hospitals mainly for the convenience and cost-effectiveness it offers.
This market is witnessing tremendous growth due to a rise in the aging population, not only in the developed regions of the world, but also in developing countries. Awareness of the convenience and cost effectiveness offered by these equipment and services is also increasing the demand for this market. Asia displays a high CAGR owing to the rapidly increasing aging population in countries such as India, China, and Japan. The Americas also maintains a stable growth mainly due to reimbursements offered for specific equipment and the health policies of Medicaid and Medicare.
The global vital signs monitoring market was valued at $3,148 million in the year 2012 and is market is poised to grow at a CAGR of 6.61% from the year 2013, reaching approximately $4,375 million by 2018.
Scope of the Report
This research report categorizes the global vital signs monitoring market into geography, and by product. The market is further broken down by geography, with exhaustive revenue analysis, as well as the forecast up to 2018.
Global Vital Signs Monitors Market - By Product
-
BP monitoring devices
- Aneroid BP monitors
- Automated BP monitors
-
Pulse-oximeters
- Tabletop/bedside pulse-oximeters
- Fingertip
- Handheld
- Wrist worn
- Pediatric pulse-oximeters
-
Temperature monitoring devices
- Mercury-filled thermometers
- Digital thermometers
- Infrared thermometers
- Temperature strips
Global Vital Signs Monitors Market - By Geography
-
North America
- U.S
- Canada
-
Europe
- Germany
- U.K.
- France
- Italy
- Spain
- Rest of Europe
-
Asia
- China
- India
- Japan
- South Korea
- Singapore
- Rest of Asia
-
Rest of the World (RoW)
- Australia
- Latin America
- Africa
- Middle-East region
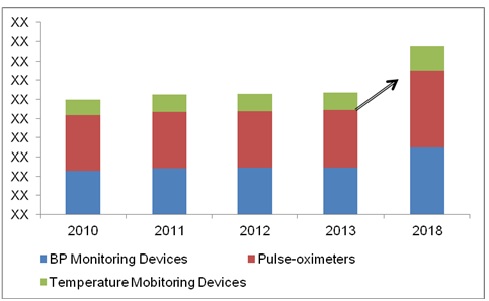
The global vital signs monitoring market is estimated to reach $4.3 billion by 2018 growing at a CAGR of 6.61%. The market for vital signs monitoring devices is divided on the basis of products and geography. Based on products, this market is segmented into blood pressure monitors, pulse-oximeters and temperature monitoring devices. Pulse-oximeters command the highest market owing to their rising demand in emergency medical care. Each segment is further classified into various sub-segments, providing exhaustive market analysis and trends for the global vital signs monitors market.
The BP monitoring devices market is segmented into aneroid and automated BP monitors, while the pulse-oximeter market is categorized into tabletop or bedside pulse-oximeters, fingertip, handheld, wrist worn, and pediatric pulse-oximeters. The temperature monitoring devices market is further classified into sub-segments such as mercury-filled thermometers, digital temperature monitors, infrared thermometers, and temperature strips.
The geography wise market segmentation includes North America, Europe, Asia, and Rest of the World. North America is a significant contributor to the market, followed by Europe, due to the presence of high-end technology providers and better R&D facilities. However, the Asian market witnesses the highest growth rate owing to the rising demand for these devices for home health monitoring. The new markets that are expected to grow at a brisk pace are emerging economics such as China, India, Japan and other regions of Asia-Pacific, and untapped markets in European regions.
Global Vital Signs Monitoring Market, By Product, 2010 – 2018 ($Million)
Source: Expert Interviews, Annual Reports, Secondary Research Data, MarketsandMarkets Analysis.
 Exclusive indicates content/data unique to MarketsandMarkets and not available with any competitors.
Table Of Contents
1 Introduction (Page No. - 22)
1.1 Logical Assumptions In This Study Based On Reliable Sources
1.2 Key Take-Aways
1.3 Report Scope & Segmentation
1.4 Research Methodology
1.5 Key Data Points From Secondary & Primary Resources
2 Executive Summary (Page No. - 30)
3 Global Vital Signs Monitoring Devices Market Analysis (Page No. - 33)
3.1 Global Vital Signs Monitoring Devices – Market Landscape Analysis
3.2 Market Dynamics
3.3 Market Landscape Analysis- By Products
3.4 Market Landscape Analysis- By Geography
3.5 Global Vital Signs Monitoring Devices Market Share Analysis- By Key Players
4 Blood Pressure (BP) Monitorng Devices Market (Page No. - 43)
4.1 Blood Pressure Monitoring Devices Market - Overview
4.2 Top Market Leaders- Competitive Structure
4.3 Market Forecast (2013 - 2018) – Overview
4.3.1 Global BP Monitoring Devices Market- By Products
4.3.2 Global BP Monitoring Devices Market- By Products, By Revenue
4.3.3 Global BP Monitoring Devices Market- By Products, By Installation Units
4.4 North America BP Monitoring Devices Market
4.5 Europe - BP Monitoring Devices Market
4.5.1 Germany
4.5.2 United Kingdom
4.5.3 France
4.5.4 Italy
4.5.5 Spain
4.5.6 Rest Of Europe
4.6 Asia - BP Monitoring Devices Market
4.6.1 China
4.6.2 India
4.6.3 Japan
4.6.4 South Korea
4.6.5 Singapore
4.6.6 Rest Of Asia
4.7 Row- Bp Monitoring Devices Market
4.7.1 Australia
4.7.2 Latin America
4.7.3 Africa
4.7.4 Middle-East Countries
5 Pulse-Oximeters Market (Page No. - 64)
5.1 Market - Overview
5.2 Top Market Leaders- Competitive Structure
5.3 Market Forecast (2013 - 2018) – Overview
5.3.1 Global Pulse-Oximeters Market- By Products, By Revenue
5.3.2 Global Market- By Product Installations
5.4 North America Pulse-Oximetry Market
5.5 Europe Pulse-Oximetry Market
5.5.1 Germany
5.5.2 United Kingdom
5.5.3 France
5.5.4 Italy
5.5.5 Spain
5.5.6 Rest Of Europe
5.6 Asia Pulse Oximetry Market
5.6.1 China
5.6.2 India
5.6.3 Japan
5.6.4 South Korea
5.6.5 Singapore
5.6.6 Rest Of Asia
5.7 Row- Pulse Oximetry Market
5.7.1 Australia
5.7.2 Latin America
5.7.3 Africa
5.7.4 Middle-East Countries
6 Temperature Monitoring Market (Page No. - 91)
6.1 Temperature Monitoring Devices - Overview
6.2 Top Market Leaders-Market Structure & Forecast
6.3 Global Temperature Monitoring Devices Market Landscape Analysis
6.3.1 Global Temperature Monitoring Devices Market Revenue – By Products
6.3.2 Global Temperature Monitoring Devices Market – By Product Installations
6.4 North America - Temperature Monitoring Market
6.5 Europe- Temperature Monitoring Market
6.5.1 Germany
6.5.2 United Kingdom
6.5.3 France
6.5.4 Italy
6.5.5 Spain
6.5.6 Rest Of Europe
6.6 Asia - Temperature Monitoring Market
6.6.1 China
6.6.2 India
6.6.3 Japan
6.6.4 South Korea
6.6.5 Singapore
6.6.6 Rest Of Asia
6.7 Row Temperature Monitoring Market
6.7.1 Australia
6.7.2 Latin America
6.7.3 Africa
6.7.4 Middle-East Countries
7 Key Company Profiles (Page No. - 111)
7.1 A&D Medical
7.2 Contec Medical Systems
7.3 Covidien PLC
7.4 GE Healthcare
7.5 Hicks Thermometers (India) Limited
7.6 Masimo Corporation
7.7 Mindray
7.8 Nihon Kohden
7.9 Nonin Medical
7.10 Omron Healthcare, INC
7.11 Philips Healthcare
7.12 Spacelabs Healthcare, INC
7.13 Suntech Medical, INC
7.14 Welch Allyn INC
List Of Tables (74 Tables)
Table 1 Global Vital Signs Monitoring Market, By Product, 2010 – 2018 ($Million)
Table 2 Global Vital Signs Monitoring Market Volume, 2010 – 2018 (Million Units)
Table 3 Vital Signs Monitoring Market (2010-2018), By Geography ($Million)
Table 4 Global Vital Signs Monitoring Market Volume, 2010 – 2018 ($Million)
Table 5 Global BP Monitoring Market, By Product, 2010 – 2018 ($Million)
Table 6 Bp Monitoring Market, By Geography, 2010 – 2018 ($Million)
Table 7 Global BP Monitoring Market Volume, By Product, 2010 – 2018 (Million Units)
Table 8 BP Monitoring Market Volume, By Geography, 2010 – 2018 (Million Units)
Table 9 North America: BP Monitoring Devices Market, By Country, 2010 – 2018 ($Million)
Table 10 U.S.: BP Monitoring Devices Market, By Product, 2010 – 2018 ($Million)
Table 11 Canada: BP Monitoring Devices Market, By Product, 2010 – 2018 ($Million)
Table 12 Germany: BP Monitoring Devices Market, By Product, 2010 – 2018 ($Million)
Table 13 U.K. BP Monitoring Devices Market, By Product, 2010 – 2018 ($Million)
Table 14 France: BP Monitoring Devices Market, By Product, 2010 – 2018 ($Million)
Table 15 Italy: BP Monitoring Devices Market, By Product, 2010 – 2018 ($Million)
Table 16 Spain: BP Monitoring Devices Market, By Product, 2010 – 2018 ($Million)
Table 17 Roe: BP Monitoring Devices Market, By Product, 2010 – 2018 ($Million)
Table 18 China: BP Monitoring Devices Market, By Product, 2010 – 2018 ($Million)
Table 19 India: BP Monitoring Devices Market, By Product, 2010 – 2018 ($Million)
Table 20 Japan: BP Monitoring Devices Market, By Product, 2010 – 2018 ($Million)
Table 21 South Korea: BP Monitoring Devices Market, By Product, 2010 – 2018 ($Million)
Table 22 South Korea: BP Monitoring Devices Market, By Product, 2010 – 2018 ($Million)
Table 23 Roa: BP Monitoring Devices Market, By Product, 2010 – 2018 ($Million)
Table 24 Australia: BP Monitoring Devices Market, By Product, 2010 – 2018 ($Million)
Table 25 Latin America: BP Monitoring Devices Market, By Product, 2010 – 2018 ($Million)
Table 26 Africa: BP Monitoring Devices Market, By Product, 2010 – 2018 ($Million)
Table 27 Middle-East: BP Monitoring Devices Market, By Product, 2010 – 2018 ($Million)
Table 28 Global Pulse-Oximetry Market, By Product, 2010 – 2018 ($Million)
Table 29 Global Pulse-Oximeter Equipment Market, By Product, 2010 – 2018 ($Million)
Table 30 Pulse-Oximeter Equipment Market, By Geography, 2010 – 2018 ($Million)
Table 31 Global Pulse-Oximetry Market Volume, 2010 – 2018 (Million Units)
Table 32 Global Pulse-Oximetry Market Volume, By Geography, 2010 – 2018 (Million Units)
Table 33 North America: Pulse-Oximeters Market, By Country, 2010 – 2018 ($Million)
Table 34 U.S.: Pulse-Oximeters Market, By Product, 2010 – 2018 ($Million)
Table 35 Canada: Pulse-Oximeters Market, By Product, 2010 – 2018 ($Million)
Table 36 Germany: Pulse-Oximeters Market, By Product, 2010 – 2018 ($Million)
Table 37 U.K.: Pulse-Oximeters Market, By Product, 2010 – 2018 ($Million)
Table 38 France: Pulse-Oximeters Market, By Product, 2010 – 2018 ($Million)
Table 39 Italy: Pulse-Oximeters Market, By Product, 2010 – 2018 ($Million)
Table 40 Spain: Pulse-Oximeters Market, By Product, 2010 – 2018 ($Million)
Table 41 Roe: Pulse-Oximeters Market, By Product, 2010 – 2018 ($Million)
Table 42 China: Pulse-Oximeters Market, By Product, 2010 – 2018 ($Million)
Table 43 India: Pulse-Oximeters Market, By Product, 2010 – 2018 ($Million)
Table 44 Japan: Pulse-Oximeters Market, By Product, 2010 – 2018 ($Million)
Table 45 South Korea: Pulse-Oximeters Market, By Product, 2010 – 2018 ($Million)
Table 46 Singapore: Pulse-Oximeters Market, By Product, 2010 – 2018 ($Million)
Table 47 Roa: Pulse-Oximeters Market, By Product, 2010 – 2018 ($Million)
Table 48 Australia: Pulse-Oximeters Market, By Product, 2010 – 2018 ($Million)
Table 49 Latin America: Pulse-Oximeters Market, By Product, 2010 – 2018 ($Million)
Table 50 Africa: Pulse-Oximeters Market, By Product, 2010 – 2018 ($Million)
Table 51 Middle-East: Pulse-Oximeters Market, By Product, 2010 – 2018 ($Million)
Table 52 Global Temperature Monitoring Market, By Product, 2010 – 2018 ($Million)
Table 53 Temperature Monitoring Market, By Geography, 2010 – 2018 ($Million)
Table 54 Global Temperature Monitoring Market Volume, By Product, 2010 – 2018 ($Million Units)
Table 55 Temperature Monitoring Market, By Geography, 2010 – 2018 ($Million Units)
Table 56 North America: Temperature Monitoring Market, By Country, 2010 – 2018 ($Million)
Table 57 U.S.: Temperature Monitoring Market, By Product, 2010 – 2018 ($Million)
Table 58 Canada: Temperature Monitoring Market, By Product, 2010 – 2018 ($Million)
Table 59 Germany:Temperature Monitoring Market, By Product, 2010 – 2018 ($Million)
Table 60 U.K.:Temperature Monitoring Market, By Product, 2010 – 2018 ($Million)
Table 61 France: Temperature Monitoring Market, By Product, 2010 – 2018 ($Million)
Table 62 Italy: Temperature Monitoring Market, By Product, 2010 – 2018 ($Million)
Table 63 Spain: Temperature Monitoring Market, By Product, 2010 – 2018 ($Million)
Table 64 Roe: Temperature Monitoring Market, By Product, 2010 – 2018 ($Million)
Table 65 China: Temperature Monitoring Market, By Product, 2010 – 2018 ($Million)
Table 66 India: Temperature Monitoring Market, By Product, 2010 – 2018 ($Million)
Table 67 Japan: Temperature Monitoring Market, By Product, 2010 – 2018 ($Million)
Table 68 South Korea: Temperature Monitoring Market, By Product, 2010 – 2018 ($Million)
Table 69 Singapore:Temperature Monitoring Market, By Product, 2010 – 2018 ($Million)
Table 70 Roa: Temperature Monitoring Market, By Product, 2010 – 2018 ($Million)
Table 71 Australia: Temperature Monitoring Market, By Product, 2010 – 2018 ($Million)
Table 72 Latin America: Temperature Monitoring Market, By Product, 2010 – 2018 ($Million)
Table 73 Africa: Temperature Monitoring Market, By Product, 2010 – 2018 ($Million)
Table 74 Middle-East: Temperature Monitoring Market, By Product, 2010 – 2018 ($Million)
List Of Figures (52 Figures)
Figure 1 Global Vital Signs Monitoring Devices Market, By Country ($Million)
Figure 2 Vital Signs Monitoring Market Share, By Geography, 2013
Figure 3 Global Vital Signs Monitoring Devices, By Geography, 2013 ($Million)
Figure 4 Global Vital Signs Monitoring Market Share, By Product, 2013
Figure 5 Global Vital Signs Monitoring Devices Market, By Product, 2010 - 2018 ($Million)
Figure 6 Global Vital Signs Monitoring Devices Market Volume, By Product, 2010 - 2018 ($Million Units)
Figure 7 Vital Signs Monitoring Devices Market, By Geography, 2010 - 2018 ($Million)
Figure 8 Vital Signs Monitoring Devices Market Volume, By Geography, 2010 - 2018 ($Million Units)
Figure 9 Global Vital Signs Monitoring Devices Market Share, By Key Player, 2013
Figure 10 Global BP Monitors Market Share, By Key Players, 2013
Figure 11 Global BP Monitoring Devices Market, By Product, 2010 - 2018 ($Million)
Figure 12 BP Monitoring Devices Market, By Geography, 2010 - 2018 ($Million)
Figure 13 Aneroid BP Monitors Market, By Geography, 2010 - 2018 ($Million)
Figure 14 Automated BP Monitors Market, By Geography, 2010 - 2018 ($Million)
Figure 15 Aneroid BP Monitors Market Volume, 2010 - 2018 (Million Units)
Figure 16 Automated BP Monitors Market Volume, 2010 – 2018 (Million Units)
Figure 17 North America: BP Monitoring Devices Market, By Country, 2010 – 2018 ($Million)
Figure 18 Europe: BP Monitoring Devices Market, By Country, 2010 – 2018 ($Million)
Figure 19 Europe: BP Monitoring Devices Market Share, By Country, 2013
Figure 20 Asia: BP Monitoring Devices Market, By Country, 2010 – 2018 ($Million)
Figure 21 Asia: BP Monitoring Devices Market Share, By Country, 2013
Figure 22 Row: BP Monitoring Devices Market, By Country, 2010 – 2018 ($Million)
Figure 23 Row: BP Monitoring Devices Market Share, By Country, 2013
Figure 24 Latin America: BP Monitoring Devices Market Share, By Country, 2013
Figure 25 Africa: BP Monitoring Devices Market Share, By Country, 2013
Figure 26 Middle-East: BP Monitoring Devices Market Share, By Country, 2013
Figure 27 Global Pulse-Oximetry Market Share, By Key Player, 2013
Figure 28 Pulse-Oximetry Market, By Geography, 2010 - 2018 ($Million)
Figure 29 Global Pulse-Oximetry Market, By Product, 2010 - 2018 ($Million)
Figure 30 North America: Pulse-Oximeters Market Share, By Country, 2013
Figure 31 Europe: Pulse-Oximeters Market, By Country, 2010 - 2018 ($Million)
Figure 32 Europe: Pulse-Oximeters Market Share, By Country, 2013
Figure 33 Asia: Pulse-Oximeters Market, By Country, 2010 - 2018 ($Million)
Figure 34 Asia: Pulse-Oximeters Market Share, By Country, 2013
Figure 35 Row: Pulse-Oximeters Market, By Country, 2010 - 2018 ($Million)
Figure 36 Row: Pulse-Oximeters Market Share, By Country, 2013
Figure 37 Latin America: Pulse-Oximeters Market Share, By Country, 2013
Figure 38 Africa: Flse-Oximeters Market Share, By Country, 2013
Figure 39 Middle-East: Pulse-Oximeters Market Share, By Product, 2013
Figure 40 Global Temperature Monitoring Monitors Market, By Key Player, 2013
Figure 41 Global Temperature Monitoring Market, By Product, 2010 - 2013 ($Million)
Figure 42 Temperature Monitoring Market, By Geography, 2010 - 2013 ($Million)
Figure 43 North America: Temperature Monitoring Market, By Country, 2010 - 2013 ($Million)
Figure 44 Europe:Temperature Monitoring Market, By Country, 2010 - 2013 ($Million)
Figure 45 Europe: Temperature Monitoring Market Share, By Country, 2013
Figure 46 Asia:Temperature Monitoring Market, By Country, 2010 - 2013 ($Million)
Figure 47 Asia: Temperature Monitoring Share, By Country, 2013
Figure 48 Row: Temperature Monitoring Market, By Country, 2010 - 2013 ($Million)
Figure 49 Row: Temperature Monitoring Market Share, By Country, 2013
Figure 50 Latin America: Temperature Monitoring Market Share, By Country, 2013
Figure 51 Africa: Temperature Monitoring Market Share, By Country, 2013
Figure 52 Middle-East: Temperature Monitoring Market Share, By Country, 2013

 Generating Response ...


Growth opportunities and latent adjacency in Vital Signs Monitoring Market