Network Camera and Video Analytics Market - Global Forecast, Trend & Analysis � Segmentation by Technology, Function, Resolution, Product & Service Type, System Architecture, Verticals, Application and Geography (2012 - 2017)


The major part of the network camera market segmentation revolves around five parameters; technology, product types, resolution, verticals, and geography. The technology market is segmented according to the method of operation, connectivity, type of image sensor, and image compression kit being used. The product market is segmented according to the physical characteristics such as fixed, PTZ, dome, and others.
Segmentation by resolution, as the term suggests, throws light on the network camera market based on different types of resolution the product offers. This segment covers four commonly used resolutions, i.e. analog, megapixel, wide dynamic range, and others. The vertical market is segmented into four major verticals; namely institutional, government, commercial, and others. The global market is also mapped against geography. The market by geography is further segmented into North America, Europe, APAC, and ROW.
The major part of the video analytics market segmentation revolves around five parameters; applications, functions, system architecture, verticals, and geography. The distinctiveness of video analytics, such as a proactive tool video that raises alarm in real time and presents alerts about whatever the application is programmed to identify; has resulted in its inclusion in various applications. This segmentation has been broadly classified as security, entertainment, and visual communication. The function market for video analytics market is calculated by segmenting it according to various types of functions. The market is segmented according to the functionality of video analytics like real time video, forensic or video indexing, and business intelligence.
The global network camera market is estimated to worth $4.5 billion in 2017 growing at a CAGR of around 19% from 2012 to 2017. In terms of unit shipments, it is estimated to ship more than 28 million units in 2017, growing at a compound grow rate of 27.2% from 2012 to 2017.
There are two broad categories of systems for implementing video analytics - centralized or server-based analytics and distributed or edge-based analytics. The report segments the market in the similar manner. The segmentation according to verticals is based on the similarity in implementation of video analytics in different verticals. The segmentation includes institutional, government commercial, and other verticals. The global video analytics market has been segmented into four major regions; namely Americas, Europe, Asia-Pacific (APAC), and Rest of the world (ROW). The market is divided into the above-mentioned regions to depict the economic characteristics and trends pertaining to them.
The global video analytics market is estimated to worth more than $1,200 million in 2017 growing at a CAGR of around 38% from 2012 to 2017.
Apart from the global network camera market and video analytics market segmentation, the report includes critical market data showing the Porter’s five force analysis, industry life cycle analysis, revenue model analysis, and value chain analysis with detailed process flow diagram, and market dynamics such as; drivers, restraints, and opportunities.
Scope of the report
The report segments the global network camera market and video analytics market on the basis of hardware and software attributes of the networked or digital video surveillance system. Owing to different parameters and distinguished market dynamics, the market around the parameters such as functionality, products, applications, verticals, resolution, architecture, technology, and geography.
The global network camera market is segmented into:
- Technology: Operational, Connectivity, Type of Image Sensor, and Image Compression technology
- Products: Fixed, PTZ, Dome, and Others
- Resolution: Analog, Megapixel, Wide Dynamic Range, and Others
- Verticals: Institutional, Government, Commercial and Others
- Geographies: North America, Europe, Asia-Pacific (APAC), and Rest of the World (ROW).
The global video analytics market is segmented into:
- Applications: Security, Entertainment and Visual Communication.
- Functions: Real Time Video, Forensic or Video Indexing and Business Intelligence.
- System Architecture: Centralized or Server Based Analytics and Distributed or Edge Based Analytics
- Verticals: Institutional, Government, Commercial, and Others
- Geographies: North America, Europe, Asia-Pacific (APAC), and Rest of the World (ROW).
Each section will provide market data, market drivers, trends and opportunities, key players, and competitive outlook. This report also makes ways for market tables to cover the sub-segments and micro-markets. In addition, it profiles 30 companies covering all the sub-segments such as “overview”, “products & services”, “financials”, “strategy”, and “developments”.
Global Network Camera Market
Network cameras are undergoing a paradigm shift in terms of increasing processing power and offering more functionality to Video Management Service (VMS) vendors and users. In addition to higher picture quality, higher resolution, and higher frame rates, network cameras are now embedding new functionality like on cam storage & video analytics that stores the relevant information or processes information or metadata and sends it across the network.
As of 2012, network cameras have overcome almost all the drawbacks of analog camera technology like interlacing, low reliability, low resolution, absence of embedded intelligence (video analytics), and less cost-effectiveness. Marked by its peak in growth stage, the market is expected to grow at an impressive rate of around 20% year-on-year and by the end of 2014, it is expected to replace the analog cameras in video surveillance systems. The network camera value chain, at present, is dominated by ample number of players. Established core security business firms, mainly large and medium players from video surveillance value chain, are trying to enter this market, thereby focusing on IT and networking.
The characteristics of network cameras such as network identity, ability to transfer data at higher bit rate, higher resolution, on cam analysis, and storage have resulted in their inclusion in various verticals. For certain verticals such as government and institutional; network cameras are dominating the video surveillance market. Besides, network cameras have also developed new market segments like commercial segment that includes sectors like retail, healthcare, and manufacturing plants for pervasive surveillance. This global market is evenly distributed across various geographies.
Axis Communications AB (Sweden), Panasonic System Networks (Japan), Pelco (U.S), Mobotix AG (Germany), Bosch Security (Germany),Sony Corp. (Japan), Samsung Techwin (South Korea), Basler AG (Germany), Hikvision (China), Canon U.S.A. Inc. (U.S.) are some of the prominent market players in network camera industry.
Global Network Camera Market, 2011 - 2017
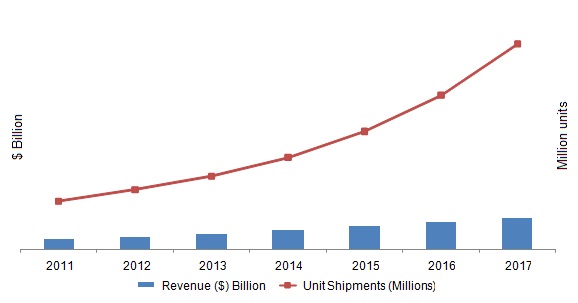
Source: MarketsandMarkets Analysis
The global network camera market is estimated to worth $4.5 billion in 2017 growing at a CAGR of around 19% from 2012 to 2017. In terms of unit shipments, it is estimated to ship more than 28 million units in 2017, growing at a compound grow rate of 27% from 2012 to 2017.
Global Video Analytics Market
Video analytics software is becoming a key element in today’s growing video surveillance system applications, given that human video monitoring is getting difficult with the increasing number of video channels and incremental cost additions. This has led to the innovation of digital products and systems centered on intelligent video analytics and sensors, which has, in turn, resulted in the best possible coordination of system functionality with operator requirements. Video analytics can be defined as turning raw video data into useful information and organizing that information in a way that makes it accessible and valuable to business.
More powerful digital signal processors (DSPs) are enabling cameras to execute considerably more demanding software algorithms and identify specific objects or actions. Server-based video analytics software products using highly specialized algorithms to analyze IP streaming signals are allowing image processing on the fly. Artificial intelligence is even enabling video analytics software to learn on the job. In response to these developments, false alarm rates are dramatically dropping and the ability to make fine distinctions in what is being seen is rapidly improving.
As of 2011, the security & surveillance application of video analytics was prominent while visual communication and entertainment applications were catching up with the market needs. Although there are various video analytics functions, they can be categorized into real time monitoring, video indexing or forensics, and business intelligence. The present focus of these functions is largely on detecting alarm events and abnormal behaviors with regards to public safety and security. Video indexing or forensic function is the process of defining set criteria and allotting them indices, which can be viewed and analyzed later.
As powerful processors at affordable price points become available, the ability to effectively meet market demands for video analytics is within reach. The ability to meet such requirements across industries will become a greater focus for VMS vendors as well as network camera suppliers.
Apart from some of the leading network camera original equipment manufacturers (OEMs) who provide video analytics as part of their product offering, some of the players in the video analytics market include Agent Vi (Israel), ObjectVideo (U.S.), Vreint Systems (U.S.), Indigovision (U.K.), VideoIQ (U.S.), Viasys Intelligent Video Analytics (Germany), Ioimage (Israel), and Honeywell Security Group (U.S.).
Global Video Analytics Market, 2011 - 2017
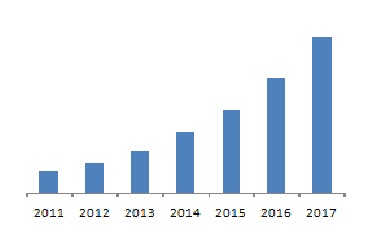
Source: MarketsandMarkets Analysis
The global video analytics market is estimated to worth more than $1,200 million in 2017 growing at a CAGR of around 38% from 2012 to 2017.
 Exclusive indicates content/data unique to MarketsandMarkets and not available with any competitors.
TABLE OF CONTENTS
1 INTRODUCTION
1.1 KEY TAKE-AWAYS
1.2 REPORT DESCRIPTION
1.3 MARKETS COVERED
1.4 STAKEHOLDERS
1.5 RESEARCH METHODOLOGY
1.5.1 MARKET SIZE
1.5.2 MARKET CRACKDOWN
1.5.3 KEY DATA POINTS FROM SECONDARY SOURCES
1.5.4 KEY DATA POINTS FROM PRIMARY SOURCES
1.5.5 ASSUMPTIONS MADE
1.5.6 LIST OF COMPANIES
2 EXECUTIVE SUMMARY
2.1 GLOBAL NETWORK CAMERA MARKET
2.2 GLOBAL VIDEO ANALYTICS MARKET
3 GLOBAL NETWORK CAMERA MARKET
3.1 INTRODUCTION
3.2 EVOLUTION
3.3 DEFINITION & SEGMENTATION
3.4 VALUE CHAIN ANALYSIS
3.5 PORTER'S FIVE FORCE ANALYSIS
3.5.1 BARGAINING POWER OF SUPPLIERS
3.5.2 BARGAINING POWER OF BUYER
3.5.3 THREAT FROM SUBSTITUTES
3.5.4 THREAT FROM NEW ENTRANTS
3.5.5 RIVALRY
3.6 INDUSTRY LIFECYCLE
3.7 NETWORK CAMERA MARKET OVERVIEW
3.8 MARKET DYNAMICS
3.8.1 DRIVERS
3.8.1.1 Need for high resolution
3.8.1.2 Reduction of total cost of ownership (TCO)
3.8.1.3 Backed by government investments
3.8.1.4 Increasing demand from non security applications
3.8.2 RESTRAINTS
3.8.2.1 Lack of data privacy
3.8.2.2 High bandwidth requirements
3.8.3 OPPORTUNITIES
3.8.3.1 Edge-based video analytics - a competitive advantage to network camera manufacturers
3.8.4 BURNING ISSUE
3.8.4.1 Prone to attacks in public places
3.8.5 WINNING IMPERATIVE
3.8.5.1 To provide complete network video surveillance solution
3.9 GLOBAL NETWORK CAMERA MARKET BY TECHNOLOGY
3.9.1 INTRODUCTION
3.9.2 USAGE MODES
3.9.2.1 Day and night (SD/HD)
3.9.2.2 Thermal camera
3.9.2.3 Market overview & forecast
3.9.3 TYPES OF CONNECTIVITY
3.9.3.1 PoE
3.9.3.2 Wi-Fi
3.9.3.3 Market overview & forecast
3.9.4 IMAGE SENSORS
3.9.4.1 CCD (Charge-coupled Device)
3.9.4.2 CMOS (Complementary Metal-oxide Semiconductor)
3.9.4.3 Market overview & forecast
3.9.5 IMAGE PROCESSING & VIDEO COMPRESSION
3.9.5.1 MOTION JPEG (M-JPEG)
3.9.5.2 MPEG-4
3.9.5.3 H.264
3.9.5.4 Market overview & forecast
3.10 GLOBAL NETWORK CAMERA MARKET, BY PRODUCT TYPES
3.10.1 INTRODUCTION
3.10.2 MARKET OVERVIEW & FORECAST
3.10.3 FIXED
3.10.3.1 Introduction
3.10.3.2 Market overview & forecast
3.10.4 PAN/TILT/ZOOM (PTZ)
3.10.4.1 Introduction
3.10.4.2 Market overview & forecast
3.10.5 DOME CAMERA
3.10.5.1 Introduction
3.10.5.2 Market overview & forecast
3.11 GLOBAL NETWORK CAMERA MARKET, BY RESOLUTION
3.11.1 INTRODUCTION
3.11.2 MARKET OVERVIEW & FORECAST
3.11.3 STANDARD RESOLUTION (SD)
3.11.3.1 Introduction
3.11.3.2 Market overview & forecast
3.11.4 MEGAPIXEL NETWORK CAMERA
3.11.4.1 Introduction
3.11.4.2 Market overview & forecast
3.11.5 HIGH DEFINITION (HD)
3.11.5.1 Introduction
3.11.5.2 Market overview & forecast
3.12 GLOBAL NETWORK CAMERA MARKET BY VERTICALS
3.12.1 INTRODUCTION
3.12.2 MARKET OVERVIEW & FORECAST
3.12.2.1 Government
3.12.2.1.1 Transportation Vertical
3.12.2.1.2 Government Buildings & Public Area
3.12.2.2 Institutional
3.12.2.2.1 Banking & Financial Institutions
3.12.2.2.2 Educational Premises
3.12.2.3 Commercial vertical
3.13 GLOBAL NETWORK CAMERA MARKET BY GEOGRAPHY
3.13.1 INTRODUCTION
3.13.2 MARKET OVERVIEW & FORECAST
3.13.3 AMERICAS
3.13.3.1 Introduction
3.13.3.2 Market overview & forecast
3.13.4 EUROPE & MIDDLE EAST (E&ME)
3.13.4.1 Introduction
3.13.4.2 Market overview & forecast
3.13.5 APAC
3.13.5.1 Introduction
3.13.5.2 Market overview & forecast
3.13.6 ROW
3.13.6.1 Introduction
3.13.6.2 Market overview & forecast
4 GLOBAL VIDEO ANALYTICS MARKET
4.1 INTRODUCTION
4.2 EVOLUTION OF VIDEO ANALYTICS
4.3 MARKET DEFINITION & SEGMENTATION
4.4 GLOBAL VIDEO ANALYTICS INDUSTRY REVENUE MODEL
4.5 INDUSTRY LIFECYCLE
4.6 VIDEO ANALYTICS MARKET OVERVIEW
4.7 MARKET DYNAMICS
4.7.1 DRIVERS
4.7.1.1 Transition of video surveillance system from analog to network (digital)
4.7.1.2 Emergence of open standards
4.7.1.3 Increase in the efficiency of video surveillance system
4.7.2 RESTRAINTS
4.7.2.1 The higher cost of maintenance
4.7.2.2 Occurrence of false alarm
4.7.3 OPPORTUNITIES
4.7.3.1 Lucrative entertainment & visual communication applications
4.7.4 BURNING ISSUES
4.7.4.1 Edge vs. sever installation
4.7.4.2 Enterprise security handling
4.7.5 WINNING IMPERATIVE
4.7.5.1 Beating the hype
4.8 GLOBAL VIDEO ANALYTICS BY FUNCTIONS
4.8.1 INTRODUCTION
4.8.2 MARKET OVERVIEW & FORECASTS
4.9 GLOBAL VIDEO ANALYTICS MARKET BY SYSTEM’S ARCHITECTURE
4.9.1 INTRODUCTION
4.9.2 MARKET OVERVIEW & FORECASTS
4.10 GLOBAL VIDEO ANALYTICS MARKET BY APPLICATION
4.10.1 INTRODUCTION
4.10.2 MARKET OVERVIEW & FORECAST
4.10.3 SECURITY & SURVEILLANCE APPLICATION
4.10.3.1 Introduction
4.10.3.2 Market overview & forecast
4.10.3.2.1 Perimeter detection
4.10.3.2.2 Directional or Flow Detection
4.10.4 ENTERTAINMENT APPLICATION
4.10.4.1 Introduction
4.10.4.2 Market overview & forecast
4.10.5 VISUAL COMMUNICATION APPLICATION
4.10.5.1 Introduction
4.10.5.2 Market overview & forecast
4.11 GLOBAL VIDEO ANALYTICS MARKET BY VERTICALS
4.11.1 INTRODUCTION
4.11.2 MARKET OVERVIEW & FORECAST
4.11.3 GOVERNMENT VERTICAL
4.11.3.1 Introduction
4.11.3.2 Market overview & forecast by sub verticals
4.11.3.3 Transportation
4.11.3.3.1 Introduction
4.11.3.3.2 Market overview & forecast by vertical specific application
4.11.3.4 Government Buildings & Public Area
4.11.3.4.1 Introduction
4.11.3.4.2 Market overview & forecast by vertical specific applications
4.11.4 INSTITUTIONAL VERTICAL
4.11.4.1 Introduction
4.11.4.2 Market overview & forecast by sub verticals
4.11.5 COMMERCIAL VERTICAL
4.11.5.1 Introduction
4.11.5.2 Market overview & forecast by sub verticals
4.12 VIDEO ANALYTICS MARKET BY GEOGRAPHY
4.12.1 INTRODUCTION
4.12.2 MARKET OVERVIEW & FORECAST
4.12.3 AMERICAS
4.12.3.1 Introduction
4.12.3.2 Market Overview & Forecast
4.12.4 EUROPE & MIDDLE EAST (E&ME)
4.12.4.1 Introduction
4.12.4.2 Market Overview & Forecast
4.12.5 APAC
4.12.5.1 Introduction
4.12.5.2 Market Overview & Forecast
4.12.6 ROW
4.12.6.1 Introduction
4.12.6.2 Market Overview & Forecast
5 COMPETITIVE LANDSCAPE
5.1 MARKET SHARE ANALYSIS
5.2 MERGERS & ACQUISITIONS
5.3 COLLABORATIONS/PARTNERSHIPS/AGREEMENTS/ JOINT VENTURES/ALLIANCES
5.4 NEW PRODUCT DEVELOPMENT
6 COMPANY PROFILES
6.1 ADT SECURITY SERVICES INC.
6.1.1 OVERVIEW
6.1.2 PRODUCTS & SERVICES
6.1.3 FINANCIALS
6.1.4 STRATEGY
6.1.5 DEVELOPMENTS
6.2 AGENT VIDEO INTELLIGENCE
6.2.1 OVERVIEW
6.2.2 PRODUCTS & SERVICES
6.2.3 FINANCIALS
6.2.4 STRATEGY
6.2.5 DEVELOPMENTS
6.3 ARECONT VISIONLLC
6.3.1 OVERVIEW
6.3.2 PRODUCTS & SERVICES
6.3.3 FINANCIALS
6.3.4 STRATEGY
6.3.5 DEVELOPMENTS
6.4 AXIS COMMUNICATIONS AB
6.4.1 OVERVIEW
6.4.2 PRODUCTS & SERVICES
6.4.3 FINANCIALS
6.4.4 STRATEGY
6.4.5 DEVELOPMENTS
6.5 BASLER AG
6.5.1 OVERVIEW
6.5.2 PRODUCTS & SERVICES
6.5.3 FINANCIALS
6.5.4 STRATEGY
6.5.5 DEVELOPMENTS
6.6 BIKAL UK
6.6.1 OVERVIEW
6.6.2 PRODUCTS & SERVICES
6.6.3 FINANCIALS
6.6.4 STRATEGY
6.6.5 DEVELOPMENTS
6.7 BOSCH SECURITY
6.7.1 OVERVIEW
6.7.2 PRODUCTS & SERVICES
6.7.3 FINANCIALS
6.7.4 STRATEGY
6.7.5 DEVELOPMENTS
6.8 CANON, INC.
6.8.1 OVERVIEW
6.8.2 PRODUCTS & SERVICES
6.8.3 FINANCIALS
6.8.4 STRATEGY
6.8.5 DEVELOPMENTS
6.9 CERNIUM CORPORATION
6.9.1 OVERVIEW
6.9.2 PRODUCTS & SERVICES
6.9.3 FINANCIALS
6.9.4 STRATEGY
6.9.5 DEVELOPMENTS
6.10 CISCO SYSTEMS INC.
6.10.1 OVERVIEW
6.10.2 PRODUCTS & SERVICES
6.10.3 FINANCIALS
6.10.4 STRATEGY
6.10.5 DEVELOPMENTS
6.11 DIGIOP, INC.
6.11.1 OVERVIEW
6.11.2 PRODUCTS & SERVICES
6.11.3 FINANCIALS
6.11.4 STRATEGY
6.11.5 DEVELOPMENTS
6.12 DVTEL INC.
6.12.1 OVERVIEW
6.12.2 PRODUCTS & SERVICES
6.12.3 FINANCIALS
6.12.4 STRATEGY
6.12.5 DEVELOPMENTS
6.13 GENETEC INC.
6.13.1 OVERVIEW
6.13.2 PRODUCTS & SERVICES
6.13.3 FINANCIALS
6.13.4 STRATEGY
6.13.5 DEVELOPMENTS
6.14 HANGZHOU HIKVISION DIGITAL TECHNOLOGY CO., LTD.
6.14.1 OVERVIEW
6.14.2 PRODUCT & SERVICES
6.14.3 FINANCIAL
6.14.4 STRATEGY
6.14.5 DEVLOPMENTS
6.15 HONEYWELL SECURITY GROUP
6.15.1 OVERVIEW
6.15.2 PRODUCTS & SERVICES
6.15.3 FINANCIALS
6.15.4 STRATEGY
6.15.5 DEVELOPMENTS
6.16 I³INTERNATIONAL
6.16.1 OVERVIEW
6.16.2 PRODUCTS & SERVICES
6.16.3 FINANCIALS
6.16.4 STRATEGY
6.16.5 DEVELOPMENTS
6.17 INTRANSA, INC.
6.17.1 OVERVIEW
6.17.2 PRODUCTS & SERVICES
6.17.3 FINANCIALS
6.17.4 STRATEGY
6.17.5 DEVELOPMENTS
6.18 MARCH NETWORKS CORP
6.18.1 OVERVIEW
6.18.2 PRODUCTS & SERVICES
6.18.3 FINANCIALS
6.18.4 STRATEGY
6.18.5 DEVELOPMENTS
6.19 MILESTONE SYSTEMS A/S
6.19.1 OVERVIEW
6.19.2 PPRODUCTS & SERVICES
6.19.3 FINANCIALS
6.19.4 STRATEGY
6.19.5 DEVELOPMENTS
6.20 MOBOTIX AG
6.20.1 OVERVIEW
6.20.2 PRODUCTS & SERVICES
6.20.3 FINANCIALS
6.20.4 STRATEGY
6.20.5 DEVELOPMENTS
6.21 OBJECTVIDEO, INC.
6.21.1 OVERVIEW
6.21.2 PRODUCTS & SERVICES
6.21.3 FINANCIALS
6.21.4 STRATEGY
6.21.5 DEVELOPMENTS
6.22 PANASONIC CORPORATION
6.22.1 OVERVIEW
6.22.2 PRODUCTS & SERVICES
6.22.3 FINANCIALS
6.22.4 STRATEGY
6.22.5 DEVELOPMENTS
6.23 PELCO INC.
6.23.1 OVERVIEW
6.23.2 PRODUCTS & SERVICES
6.23.3 FINANCIALS
6.23.4 STRATEGY
6.23.5 DEVELOPMENTS
6.24 SAMSUNG TECHWIN CO. LTD.
6.24.1 OVERVIEW
6.24.2 PRODUCTS & SERVICES
6.24.3 FINANCIALS
6.24.4 STRATEGY
6.24.5 DEVELOPMENTS
6.25 SIGHTLOGIX
6.25.1 OVERVIEW
6.25.2 PRODUCTS & SERVICES
6.25.3 FINANCIALS
6.25.4 STRATEGY
6.25.5 DEVELOPMENTS
6.26 SYNESIS LLC
6.26.1 OVERVIEW
6.26.2 PRODUCTS & SERVICES
6.26.3 FINANCIALS
6.26.4 STRATEGY
6.27 VERINT SYSTEMS, INC.
6.27.1 OVERVIEW
6.27.2 PRODUCTS & SERVICES
6.27.3 FINANCIALS
6.27.4 STRATEGY
6.27.5 DEVELOPMENTS
6.28 VIASYS INTELLIGENT VIDEO ANALYTICS
6.28.1 OVERVIEW
6.28.2 PRODUCTS & SERVICES
6.28.3 FINANCIALS
6.28.4 STRATEGY
6.28.5 DEVELOPMENTS
6.29 VIDEOIQ, INC.
6.29.1 OVERVIEW
6.29.2 PRODUCTS & SERVICES
6.29.3 FINANCIALS
6.29.4 STRATEGY
6.29.5 DEVELOPMENTS
6.30 VIVOTEK, INC.
6.30.1 OVERVIEW
6.30.2 PRODUCT & SERVICES
6.30.3 FINANCIAL
6.30.4 STRATEGY
6.30.5 DEVLOPMENTS
LIST OF TABLES
TABLE 1 GLOBAL MARKET REVENUE & SHIPMENTS, 2011 – 2017
TABLE 2 GLOBAL VIDEO ANALYTICS MARKET OVERVIEW, 2011 – 2017
TABLE 3 GLOBAL MARKET REVENUE, BY TYPES OF OPERATION, 2011 – 2017 ($BILLION)
TABLE 4 GLOBAL MARKET SHIPMENTS, BY TYPES OF OPERATION, 2011 – 2017 (MILLION UNITS)
TABLE 5 GLOBAL MARKET REVENUE, BY TYPES OF CONNECTIVITY, 2011 – 2017 ($BILLION)
TABLE 6 GLOBAL MARKET SHIPMENTS, BY TYPES OF CONNECTIVITY, 2011 – 2017 (MILLION UNITS)
TABLE 7 GLOBAL MARKET REVENUE, BY TYPES OF SENSOR, 2011 – 2017 ($BILLION)
TABLE 8 GLOBAL MARKET SHIPMENTS, BY TYPE OF SENSORS, 2011 – 2017 (MILLION UNITS)
TABLE 9 GLOBAL MARKET REVENUE, BY TYPES OF VIDEO COMPRESSION CODEC, 2011 – 2017 ($BILLION)
TABLE 10 GLOBAL MARKET REVENUE, BY PRODUCT TYPE, 2011 – 2017 ($BILLION)
TABLE 11 GLOBAL MARKET SHIPMENTS, BY PRODUCT TYPE, 2011 – 2017 (MILLION UNITS)
TABLE 12 FIXED MARKET REVENUE, BY GEOGRAPHY, 2011 – 2017 ($BILLION)
TABLE 13 FIXED MARKET SHIPMENTS, BY GEOGRAPHY, 2011 – 2017 (MILLION UNITS)
TABLE 14 PTZ MARKET REVENUE, BY GEOGRAPHY, 2011 – 2017 ($BILLION)
TABLE 15 PTZ MARKET SHIPMENTS, BY GEOGRAPHY, 2011 – 2017 (MILLION UNITS)
TABLE 16 DOME MARKET REVENUE, BY GEOGRAPHY, 2011 – 2017 ($BILLION)
TABLE 17 DOME MARKET SHIPMENTS, BY GEOGRAPHY, 2011 – 2017 (MILLION UNITS)
TABLE 18 GLOBAL MARKET REVENUE, BY TYPES OF RESOLUTION, 2011 – 2017 ($BILLION)
TABLE 19 GLOBAL MARKET SHIPMENTS, BY TYPE OF RESOLUTION, 2011 – 2017 (MILLION UNITS)
TABLE 20 SD NETWORK CAMERA MARKET REVENUE, BY VERTICALS, 2011 – 2017 ($BILLION)
TABLE 21 SD NETWORK CAMERA MARKET SHIPMENTS, BY VERTICALS, 2011 – 2017 (MILLION UNITS)
TABLE 22 MEGAPIXEL NETWORK CAMERA MARKET REVENUE, BY VERTICALS, 2011 – 2017 ($BILLION)
TABLE 23 MEGAPIXEL NETWORK CAMERA MARKET SHIPMENTS, BY VERTICALS, 2011 – 2017 (MILLION UNITS)
TABLE 24 HD NETWORK CAMERA MARKET REVENUE, BY VERTICALS, 2011 – 2017 ($BILLION)
TABLE 25 HD NETWORK CAMERA MARKET SHIPMENTS, BY VERTICALS, 2011 – 2017 (MILLION UNITS)
TABLE 26 GLOBAL MARKET REVENUE, BY VERTICALS, 2011 – 2017 ($BILLION)
TABLE 27 GLOBAL MARKET SHIPMENTS, BY VERTICALS, 2011 – 2017 (MILLION UNITS)
TABLE 28 GLOBAL MARKET REVENUE, BY GOVERNMENT VERTICAL, 2011 – 2017 ($BILLION)
TABLE 29 GLOBAL MARKET UNIT SHIPMENTS, BY GOVERNMENT VERTICAL, 2011 – 2017 (MILLION UNITS)
TABLE 30 GLOBAL MARKET REVENUE FOR TRANSPORTATION VERTICAL, 2011 – 2017 ($BILLION)
TABLE 31 GLOBAL MARKET SHIPMENTS FOR TRANSPORTATION VERTICAL, 2011 – 2017 (MILLION UNITS)
TABLE 32 GLOBAL MARKET REVENUE FOR GOVERNMENT BUILDING & PUBLIC AREA VERTICAL, 2011 – 2017 ($BILLION)
TABLE 33 GLOBAL MARKET UNIT SHIPMENTS FOR GOVERNMENT BUILDING & PUBLIC AREA VERTICAL, 2011 – 2017 (MILLION UNITS)
TABLE 34 GLOBAL MARKET REVENUE FOR INSTITUTIONAL VERTICAL, 2011 – 2017 ($BILLION)
TABLE 35 GLOBAL MARKET SHIPMENTS FOR INSTITUTIONAL VERTICAL, 2011 – 2017 (MILLION UNITS)
TABLE 36 GLOBAL MARKET REVENUE FOR EDUCATIONAL PREMISES VERTICAL, 2011 – 2017 ($BILLION)
TABLE 37 GLOBAL MARKET SHIPMENTS FOR EDUCATIONAL PREMISES VERTICAL, 2011 – 2017 (MILLION UNITS)
TABLE 38 GLOBAL MARKET REVENUE FOR COMMERCIAL VERTICAL, 2011 – 2017 ($BILLION)
TABLE 39 GLOBAL MARKET SHIPMENTS FOR COMMERCIAL VERTICAL, 2011 – 2017 (MILLION UNITS)
TABLE 40 MARKET REVENUE BY GEOGRAPHY, 2011 – 2017 ($BILLION)
TABLE 41 MARKET UNIT SHIPMENTS BY GEOGRAPHY, 2011 – 2017 (MILLION UNITS)
TABLE 42 AMERICAS: MARKET, 2011 – 2017 ($BILLION)
TABLE 43 AMERICAS: MARKET SHIPMENTS, 2011 – 2017 (MILLION UNITS)
TABLE 44 E&ME: MARKET, 2011 – 2017 ($BILLION)
TABLE 45 E&ME: MARKET SHIPMENTS, 2011 – 2017 (MILLION UNITS)
TABLE 46 APAC: MARKET, 2011 – 2017 ($BILLION)
TABLE 47 APAC: MARKET SHIPMENTS, 2011 – 2017 (MILLION UNITS)
TABLE 48 ROW: MARKET, 2011 – 2017 ($BILLION)
TABLE 49 ROW: MARKET SHIPMENTS, 2011 – 2017 (MILLION UNITS)
TABLE 50 VIDEO ANALYTICS MARKET REVENUE MODEL MATRIX 2012: RELATIONSHIP BETWEEN REVENUE INDICATORS & REVENUE CHANNELS (%)
TABLE 51 GLOBAL VIDEO ANALYTICS MARKET REVENUE BY FUNCTIONALY, 2011 – 2017 ($MILLION)
TABLE 52 COMPARATIVE ANALYSIS OF VIDEO ANALYTICS
TABLE 53 GLOBAL VIDEO ANALYTICS MARKET REVENUE BY SYSTEM ARCHITECTURE, 2011 – 2017 ($MILLION)
TABLE 54 GLOBAL VIDEO ANALYTICS MARKET REVENUE BY APPLICATION, 2011 – 2017 ($MILLION)
TABLE 55 GLOBAL VIDEO ANALYTICS MARKET REVENUE FOR SECURITY & SURVEILLANCE APPLICATION, 2011 – 2017 ($MILLION)
TABLE 56 GLOBAL VIDEO ANALYTICS MARKET REVENUE FOR OBJECT DETECTION & IDENTIFICATION APPLICATION, 2011 – 2017 ($MILLION)
TABLE 57 GLOBAL VIDEO ANALYTICS MARKET REVENUE FOR ENTERTAINMENT APPLICATION, 2011 – 2017 ($MILLION)
TABLE 58 GLOBAL VIDEO ANALYTICS MARKET REVENUE FOR VISUAL COMMUNICATION APPLICATIONS, 2011 – 2017 ($MILLION)
TABLE 59 GLOBAL VIDEO ANALYTICS MARKET REVENUE BY VERTICALS, 2011 – 2017 ($MILLION)
TABLE 60 GLOBAL VIDEO ANALYTICS MARKET FOR GOVERNMENT VERTICAL, 2011 – 2017 ($MILLION)
TABLE 61 GLOBAL VIDEO ANALYTICS MARKET REVENUE FOR GOVERNMENT VERTICAL BY FUNCTIONALY, 2011 – 2017 ($MILLION)
TABLE 62 GLOBAL VIDEO ANALYTICS MARKET REVENUE FOR TRANSPORTATION VERTICAL BY APPLICATION, 2011 – 2017 ($MILLION)
TABLE 63 GLOBAL VIDEO ANALYTICS MARKET REVENUE FOR GOVERNMENT BUILDINGS & PUBLIC AREA VERTICAL BY APPLICATION, 2011 – 2017 ($MILLION) TABLE 64 GLOBAL VIDEO ANALYTICS MARKET REVENUE, BY INSTITUTIONAL VERTICAL, 2011 – 2017 ($MILLION)
TABLE 65 GLOBAL VIDEO ANALYTICS MARKET REVENUE FOR INSTITUTIONAL VERTICAL BY FUNCTIONALIY, 2011 – 2017 ($MILLION)
TABLE 66 GLOBAL VIDEO ANALYTICS MARKET REVENUE FOR COMMERCIAL VERTICAL, 2011 – 2017 ($MILLION)
TABLE 67 GLOBAL VIDEO ANALYTICS MARKET REVENUE FOR COMMERCIAL VERTICAL BY FUNCTIONALITIES, 2011 – 2017 ($MILLION)
TABLE 68 GLOBAL VIDEO ANALYTICS MARKET REVENUE, BY GEOGRAPHY, 2011 – 2017 ($MILLION)
TABLE 69 AMERICAS: VIDEO ANALYTICS MARKET REVENUE, 2011 – 2017 ($MILLION)
TABLE 70 E&ME: VIDEO ANALYTICS MARKET REVENUE, 2011 – 2017 ($MILLION)
TABLE 71 APAC: VIDEO ANALYTICS MARKET, 2011 – 2017 ($MILLION)
TABLE 72 ROW: VIDEO ANALYTICS MARKET, 2011 – 2017 ($MILLION)
TABLE 73 MARKET SHARE ANALYSIS OF NETWORK CAMERA MANUFACTURERS, 2011
TABLE 74 MARKET SHARE ANALYSIS OF VIDEO ANALYTICS SERVICE PROVIDERS, 2011
TABLE 75 MERGERS & ACQUISITION
TABLE 76 COLLABORATIONS/PARTNERSHIPS/AGREEMENTS/JOINT VENTURES/ ALLIANCES
TABLE 77 NEW PRODUCT LAUNCH, 2008 – 2012
TABLE 78 AXIS COMMUNICATIONS AB: MARKET REVENUE, 2010 – 2011 ($MILLION)
TABLE 79 BASLER AG: REVENUE, BY BUSINESS SEGMENTS, 2010 – 2011 ($MILLION)
TABLE 80 BASLER AG: REVENUE BY GEOGRAPHICAL SEGMENTS, 2009 – 2011 ($MILLION)
TABLE 81 CANON INC.: MARKET REVENUE, 2010 – 2011($MILLION)
TABLE 82 CISCO SYSTEM INC: OVERALL REVENUE, 2010 – 2011 ($MILLION)
TABLE 83 HIKVISION FINANCIALS, 2010 – 2011 ($MILLION)
TABLE 84 HONEYWELL INC: OVERALL REVENUE, 2010 – 2011 ($MILLION)
TABLE 85 MOBOTIX: MARKET REVENUE, 2010 – 2011 ($MILLION)
TABLE 86 PANASONIC: TOTAL REVENUE, 2010 – 2011 ($MILLION)
TABLE 87 SAMSUNG TECHWIN: OVERALL REVENUE & SEGMENTAL REVENUE, 2010 – 2011 ($BILLION)
TABLE 88 VERINT SYSTEMS REVENUE ($MILLION), 2010 – 2011
TABLE 89 VIVOTEK INC. FINANCIALS, 2010 – 2011 ($MILLION)
LIST OF FIGURES
FIGURE 1 GLOBAL NETWORK CAMERA AND VIDEO ANALYTICS MARKET RESEARCH METHODOLOGY
FIGURE 2 MARKET SIZE ESTIMATION
FIGURE 3 MARKET CRACKDOWN
FIGURE 4 GLOBAL VIDEO SURVEILLANCE MARKET REVENUE SPLIT, BY COMPONENT 2011 & 2017
FIGURE 5 EVOLUTION OF NETWORK CAMERA
FIGURE 6 GLOBAL MARKET SEGEMENTATION
FIGURE 7 SEGMENTATION BY TECHNOLOGY
FIGURE 8 SEGMENTATION BY VERTICALS
FIGURE 9 SEGMENTATION BY GEOGRAPHY
FIGURE 10 VALUE CHAIN ANALYSIS OF MARKET
FIGURE 11 PORTERS FIVE FORCES MODEL
FIGURE 12 INDUSTRY LIFECYCLE FOR MARKET
FIGURE 13 GLOBAL MARKET OVERVIEW, 2011 – 2017
FIGURE 14 PENETRATION RATE FOR NETWORK CAMERAS IN VIDEO SURVEILLANCE SYSTEM, 2011 – 2017 ($MILLION)
FIGURE 15 IMPACT ANALYSIS OF MAJOR DRIVERS & RESTRAINTS ON NETWORK CAMERA MARKET
FIGURE 16 TCO WITH RESPECT TO INCREASING NUMBER OF CAMERAS
FIGURE 17 RESPONSE OF IMAGE SENSOR TO VISIBLE LIGHT & IR LIGHT
FIGURE 18 COMPARISON OF H.264, MPEG-4, AND JPEG (PICTURE QUALITY VS. BIT RATE)
FIGURE 19 GLOBAL VIDEO ANALYTICS MARKET SEGMENTATION
FIGURE 20 REVENUE MODEL OF VIDEO ANALYTICS INDUSTRY
FIGURE 21 INDUSTRY LIFECYCLE FOR VIDEO ANALYTICS MARKET AS OF 2012
FIGURE 22 GLOBAL VIDEO ANALYTICS MARKET OVERVIEW, 2011 – 2017
FIGURE 23 IMPACT ANALYSIS OF DRIVERS AND RESTRAINTS OF GLOBAL VIDEO ANALYTICS MARKET
FIGURE 24 PERCENT SHARE OF FUNCTIONALITIES, 2011 – 2017 (%)
FIGURE 25 VIDEO ANALYTICS MARKET SHARE BY SYSTEM ARCHITECTURE, 2011 – 2017 (%)
FIGURE 26 PERCENT SHARE OF APPLICATIONS, 2011 – 2017 (%)
FIGURE 27 PERCENT SHARE OF SECURITY & SURVEILLANCE APPLICATIONS, 2011 – 2017 (%)
FIGURE 28 NETWORK CAMERA MARKET SHARE AS OF 2011


Growth opportunities and latent adjacency in Network Camera and Video Analytics Market
I only want to download the report listed in the sample needed, but not getting proper option. Is these a single report purchase price?
Increasing importance of surveillance for various applications such as traffic monitoring, operations monitoring, surveillance activities in public places to detect unlawful activities, creating opportunity areas for video surveillance. Do you have network camera market for video surveillance applications?
We are looking to get a sense of how many cameras are owned in the world and how many cameras are purchased yearly. Do you have some validate data regarding that?
Hello, I am doing research in embedded computer vision field. I would highly appreciate if you could provide me the video analytics part of the report.