Variable Data Printing Market in Labels by Label Type (Release Liner, Linerless), Composition (Facestock, Topcoat), Printing Technology (Thermal Transfer, Direct Thermal, Electrophotography, Inkjet), End-use Sector, Region - Forecast to 2021


[222 Pages Report] The variable data printing market size in labels is estimated to grow from USD 9.39 Billion in 2015 to reach USD 22.27 Billion by 2021, at a CAGR of 15.61%. The variable data printing market in labels is gaining tractions from end-use sectors such as food & beverage, pharmaceutical, and consumer durables. The base year considered for the study is 2015 and the market size is projected from 2016 to 2021. The primary objective of the study is to define, segment, and project the variable data printing market size in labels on the basis of label type, composition, printing technology, end-use sector, and region. It also provides detailed information about the main factors influencing the growth of the market (drivers, restraints, opportunities, and industry-specific challenges), strategically analyze the micromarkets, analyze opportunities for stakeholders, provide details of competitive landscape, and strategically profile the key players with respect to their market share and core competencies.
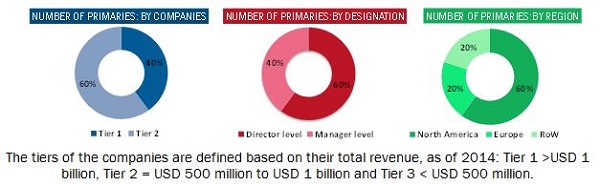
The research methodology used to estimate and forecast the variable data printing market in labels begins with capturing data on key vendor revenues through secondary research. The vendor offerings are also taken into consideration to determine the market segmentation. The bottom-up procedure has been employed to arrive at the overall market size of the global variable data printing market in labels from the revenue of the key players in the market. After arriving at the overall market size, the total market was split into several segments and subsegments, which were then verified through primary research by conducting extensive interviews with key people such as CEOs, VPs, directors, and executives. These data triangulation and market breakdown procedures were used to complete the overall market engineering process and arrive at the exact statistics for all segments and subsegments. The breakdown of profiles of primary is depicted in the figure below:
The value chain of variable data printing market in labels includes printing machinery manufactures such as HP Inc. (U.S.), Canon Inc. (Japan), Xerox Corporation (U.S.), R.R. Donnelley & Sons Company (U.S.), Quad/Graphics Inc. (U.S.), and Cenveo, Inc. (U.S.) among others. It also includes label manufacturers such as 3M Company (U.S.), Mondi Plc. (South Africa), Avery Dennison Company (U.S.), and WS Packaging Group, Inc. among others. Furthermore, the products are used by the food & beverage, consumer durables, pharmaceutical, home & personal care, and retail companies such as Nestle S.A. (Switzerland), Kellogg Company (U.S.), Unilever Plc (U.K.), Anheuser Busch Inbev SA (Belgium), Pepsico Inc. (U.S.), Procter & Gamble Co (U.S.), Microsoft Corporation (U.S), Sony Corp (Japan), GlaxoSmithKline Plc (U.K.), and Bayer AG (Germany) among others.
Target Audience
- Variable data printing companies
- Raw materials producers and suppliers
- Printing equipment manufacturers
- Market research and consulting firms
- Commercial R&D institutions
- Associations and industry bodies
- Regulatory bodies
- End users (food & beverages, pharmaceuticals, consumer durables)
Scope of the Report
This research report segments the variable data printing market in labels into the following submarkets:
By Label Type:
- Release liner labels
- Linerless labels
By Composition:
- Facestock
- Topcoat
By Printing Technology
- Thermal transfer
- Electrophotography
- Direct thermal
- Inkjet
By End-Use Sector:
- Food & beverage
- Consumer durable
- Pharmaceutical
- Home & personal
- Retail sector
- Others (industrial lubricants and paints)
By Region:
- North America
- Europe
- Asia-Pacific
- RoW
Available Customizations
With the given market data, MarketsandMarkets offers customizations as per the client-specific needs. The following customization options are available for the report:
Product Analysis
- Product matrix, which gives a detailed comparison of market for different product types and forms
Geographic Analysis
- Further breakdown of the industrial variable data printing in labels market for additional countries
Company Information
- Detailed analysis and profiling of additional market players (up to five).
MarketsandMarkets projects that the variable data printing market size will grow from USD 10.79 Billion in 2016 to reach USD 22.27 Billion by 2021, at an estimated CAGR of 15.61%. The global variable data printing market is driven by basic factors, which include strong growth in demand, especially in pharmaceutical, food & beverage and other sectors. These drivers are supported by the high rise in demand from the Asia-Pacific region. Product innovations and technological developments in the market are expected to create strong investment opportunities.
This market, on the basis of label type, has been segmented into release liner and linerless labels. The release liner segment accounted for the largest share in the variable data printing market in labels in 2015 and is expected to grow at a higher rate as it can be cut into any shape and size, whereas linerless labels are restricted to squares and rectangles.
Variable data printing market in labels, on the basis of composition, consists of facestock and topcoat. The facestock segment had the largest demand in 2015 and is expected to hold the leading position through the forecast period as it can withstand adverse conditions such as high temperature, moisture, and abrasion and is less expensive compared to other composites.
On the basis of printing technology, the market has been categorized into thermal transfer, direct thermal, electrophotography, and inkjet. The inkjet printing technology is projected to grow at the highest CAGR from 2016 to 2021 due to the huge demand for this type of printing in the industrial applications as it prints finer, smoother details through higher printhead resolution.
The end-use sectors for the market are food & beverage, consumer durable, pharmaceutical, home & personal care, and retail sector. The demand from the food & beverage sector is projected to grow at the highest CAGR during the forecast period. The growing demand of consumer awareness about product ingredients, packed food trends, and rise in the consumption of healthy food has led to the increase in demand for food & beverage sector in variable data printing market.
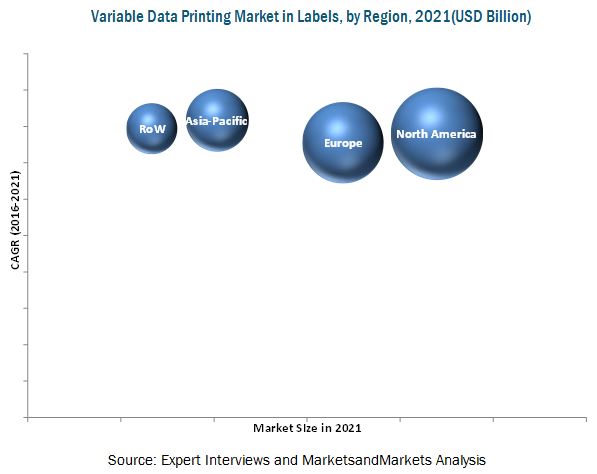
North America dominated the variable data printing market in labels in 2015 and is projected to remain the market leader through 2021. However, Asia-Pacific is projected to register the highest growth rate from 2016 to 2021. Rising disposable incomes and changing preferences of consumers towards informed buying and growing concerns among the manufacturers about the printing of varied data in a cost- and time-efficient manner have driven the growth of this market in this region.
High cost of raw materials and new technologies that enable direct printing on the package due to the changing preferences of end-use sectors are the major restraints in the studied market.
HP Inc. (HP), formerly known as Hewlett-Packard Company (U.S.), as a key player in the technology products market, has a strong market share in the U.S. It also intends to enhance its product portfolio by providing innovative solutions to businesses. The company has been adopting technological advancements as its key strategy to gain competitive advantage. Owing to its wide portfolio of products and services and technological advancements, the company has positioned itself to offer integrated and comprehensive solutions.
 Exclusive indicates content/data unique to MarketsandMarkets and not available with any competitors.
Table of Contents
1 Introduction (Page No. - 25)
1.1 Objectives of the Study
1.2 Market Definition
1.3 Study Scope
1.3.1 Regional Scope
1.3.2 Periodization Considered
1.4 Currency Considered
1.5 Units Considered
1.6 Stakeholders
2 Research Methodology (Page No. - 29)
2.1 Research Data
2.1.1 Secondary Data
2.1.1.1 Key Data From Secondary Sources
2.1.2 Primary Data
2.1.2.1 Key Data From Primary Sources
2.2 Market Size Estimation
2.3 Market Breakdown & Data Triangulation
2.4 Research Assumptions & Limitations
2.4.1 Assumptions of the Research Study
2.4.2 Limitations of the Research Study
3 Executive Summary (Page No. - 36)
3.1 Overview
3.2 Variable Data Printing Market in Labels
3.3 Variable Data Printing Market in Labels, By End-Use Sector, 2016 vs 2021 (USD Million)
3.4 Release Liner to Be the Most Widely Used Variable Data Printing Label Type Through 2021
4 Premium Insights (Page No. - 39)
4.1 Emerging Economies to Witness Higher Demand for Variable Data Printing in Labels
4.2 Food & Beverage Sector is Projected to Grow at the Highest CAGR From 2016 to 2021
4.3 Variable Data Printing Market in Labels, By Composition (2016 vs 2021)
4.4 Thermal Transfer Printing Technology Captured the Largest Share in the Asia-Pacific Region, in 2015
4.5 North America Recorded the Highest Demand for Variable Data Printing in Labels in 2015
5 Market Overview (Page No. - 42)
5.1 Introduction
5.2 Variable Data Printing Market in Labels: Segmentation
5.3 Market Dynamics
5.3.1 Drivers
5.3.1.1 Increasing Demand for Variable Data Printed Labels From Food & Beverage Sector
5.3.1.2 Growth in Pharmaceutical Sector
5.3.1.3 Increased Focus on Aesthetic Appeal of Products and Innovative Printing
5.3.1.4 Improved Manufacturing Activities, Globally
5.3.1.5 Growing E-Commerce Industry
5.3.1.6 Growth of the Parent Industry
5.3.2 Restraints
5.3.2.1 New Technologies That Enable Printing on Packages Might Diminish the Demand for Labels Printing
5.3.2.2 High Cost of Raw Materials Affects the Growth of Variable Data Printing Market in Labels
5.3.3 Opportunities
5.3.3.1 Increasing Demand in Developing Economies
5.3.3.2 Emergence of New Products and Technologies
5.3.3.3 Expanding Digital Expertise
5.3.4 Challenges
5.3.4.1 Varying Packaging and Printing Regulations Across Regions
6 Variable Data Printing Market in Labels, By Label Type (Page No. - 50)
6.1 Introduction
6.1.1 Release Liner Labels Projected to Grow at the Highest Rate in the Variable Data Printing Market in Labels During the Forecast Period
6.2 Release Liner Labels
6.2.1 Variable Data Printing Market for Release Liner Labels, By Region
6.3 Linerless Labels
6.3.1 Variable Data Printing Market for Linerless Labels, By Region
7 Variable Data Printing Market in Labels, By Composition (Page No. - 55)
7.1 Introduction
7.1.1 Facestock Segment is Projected to Grow at the Highest Rate During the Forecast Period
7.2 Facestock
7.2.1 Variable Data Printing Market for Facestock, By Region
7.3 Topcoat
7.3.1 Variable Data Printing Market for Topcoat, By Region
8 Variable Data Printing Market in Labels, By Printing Technology (Page No. - 60)
8.1 Introduction
8.2 Thermal Transfer
8.2.1 Thermal Transfer Variable Data Printing Market in Labels, By Region
8.3 Direct Thermal
8.3.1 Direct Thermal Variable Data Printing Market in Labels, By Region
8.4 Electrophotography
8.4.1 Electrophotography Variable Data Printing Market in Labels, By Region
8.5 Inkjet
8.5.1 Inkjet Variable Data Printing Market in Labels, By Region
9 Variable Data Printing Market in Labels, By End-Use Sector (Page No. - 68)
9.1 Introduction
9.1.1 Food & Beverage Sector is Projected to Grow at the Highest Rate in the Variable Data Printing Market in Labels During the Forecast Period
9.2 Food & Beverages
9.2.1 Variable Data Printing Market in Labels in Food & Beverage, By Region
9.3 Consumer Durables
9.3.1 Variable Data Printing Market in Labels in Consumer Durables, By Region
9.4 Pharmaceuticals
9.4.1 Variable Data Printing Market in Labels in Pharmaceuticals, By Region
9.5 Home & Personal Care
9.5.1 Variable Data Printing Market in Labels in Home & Personal Care, By Region
9.6 Retail
9.6.1 Variable Data Printing Market in Labels Market in Retail, By Region
9.7 Others
9.7.1 Variable Data Printing Market in Labels Market in Other End-Use Sectors, By Region
10 Variable Data Printing Market in Labels, By Region (Page No. - 80)
10.1 Introduction
10.2 North America
10.2.1 North America: Variable Data Printing Market in Labels, By Country
10.2.1.1 U.S. Dominated the Variable Data Printing Market in Labels in the North American Region in 2015
10.2.2 North America: Variable Data Printing Market in Labels, By Label Type
10.2.2.1 Release Liner Labels Segment Dominated the Variable Data Printing Market in Labels in the North American Region in 2015
10.2.3 North America: Variable Data Printing Market in Labels, By Composition
10.2.3.1 Facestock Segment is Projected to Be the Fastest-Growing in the North American Market During the Forecast Period
10.2.4 North America: Variable Data Printing Market in Labels, By Printing Technology
10.2.4.1 Thermal Transfer Printing Technology Dominated the North American Market
10.2.5 North America: Variable Data Printing Market in Labels, By End-Use Sector
10.2.5.1 Food & Beverage Sector Was the Largest Consumer of Variable Data Printed Labels in 2015
10.2.6 U.S.
10.2.6.1 U.S.: Variable Data Printing Market in Labels, By Label Type
10.2.6.1.1 Release Liner Labels Accounted for the Majority Share in the Variable Data Printing Market in Labels in 2015
10.2.6.2 U.S.: Variable Data Printing Market in Labels, By Composition
10.2.6.2.1 Facestock Segment Dominated the U.S. Variable Data Printing Market in Labels in 2015
10.2.6.3 U.S.: Variable Data Printing Market in Labels, By Technology
10.2.6.3.1 Inkjet Printing Technology Segment is Projected to Grow at the Highest CAGR in the U.S. During the Forecast Period
10.2.6.4 U.S.: Variable Data Printing Market in Labels, By End-Use Sector
10.2.6.4.1 Variable Data Printed Labels are Widely Used in the Food & Beverage Sector
10.2.7 Canada
10.2.7.1 Canada: Variable Data Printing Market in Labels, By Label Type
10.2.7.1.1 Linerless Labels Segment is Gaining Popularity for Variable Data Printing Due to Its Environment-Friendly Features
10.2.7.2 Canada: Variable Data Printing Market in Labels, By Composition
10.2.7.2.1 Facestock Segment in Canada to Grow at A Considerable Rate From 2016 to 2021
10.2.7.3 Canada: Variable Data Printing Market in Labels, By Technology
10.2.7.3.1 Direct Thermal Printing Accounted for the Second-Largest Share in the Canadian Market in 2015
10.2.7.4 Canada: Variable Data Printing Market in Labels, By End-Use Sector
10.2.7.4.1 Pharmaceuticals is Projected to Be the Second-Fastest End-Use Sector in the Canadian Market
10.2.8 Mexico
10.2.8.1 Mexico: Variable Data Printing Market in Labels, By Label Type
10.2.8.1.1 Linerless Labels Accounted for the Second-Largest Share in the Mexican Market in 2015
10.2.8.2 Mexico: Variable Data Printing Market in Labels, By Composition
10.2.8.2.1 Topcoat Segment to Grow at the Second-Highest CAGR in Mexico
10.2.8.3 Mexico: Variable Data Printing Market in Labels, By Technology
10.2.8.3.1 Ability to Produce Quality Printing at Low Cost is Expected to Drive the Demand for Inkjet Printing Technology
10.2.8.4 Mexico: Variable Data Printing Market in Labels, By End-Use Sector
10.2.8.4.1 Consumer Durables Sector Accounted for the Second-Largest Share in Mexico
10.3 Europe
10.3.1 Europe: Variable Data Printing Market in Labels, By Country
10.3.1.1 Germany Dominated the European Variable Data Printing Market in Labels in 2015
10.3.2 Europe: Variable Data Printing Market in Labels, By Label Type
10.3.2.1 Release Liner Labels to Register the Highest Rate in the European Market During the Forecast Period
10.3.3 Europe: Variable Data Printing Market in Labels, By Composition
10.3.3.1 Facestock Was Largely Used as the Surface Material to Print Variable Data in Europe
10.3.4 Europe: Variable Data Printing Market in Labels, By Printing Technology
10.3.4.1 Thermal Transfer Technology Dominated the European Variable Data Printing Market in Labels in 2015
10.3.5 Europe: Variable Data Printing Market in Labels, By End-Use Sector
10.3.5.1 Food & Beverage to Be the Fastest-Growing End-Use Sector in Europe
10.3.6 Germany
10.3.6.1 Germany: Variable Data Printing Market in Labels, By Label Type
10.3.6.1.1 Release Liner Labels Accounted for the Largest Share in Germany in 2015
10.3.6.2 Germany: Variable Data Printing Market in Labels, By Composition
10.3.6.2.1 Facestock Dominated the German Variable Data Printing Market in Labels in 2015
10.3.6.3 Germany: Variable Data Printing Market in Labels, By Printing Technology
10.3.6.3.1 Thermal Transfer Technology is Largely Used in the German Variable Data Printing Market in Labels
10.3.6.4 Germany: Variable Data Printing Market in Labels, By End-Ese Sector
10.3.6.4.1 Pharmaceutical is the Second-Fastest Growing Sector for Variable Data Printing in Labels
10.3.7 U.K.
10.3.7.1 U.K.: Variable Data Printing Market in Labels, By Label Type
10.3.7.1.1 Convenience to Cut Labels at Any Size Or Shape is Expected to Stimulate the Demand for Release Liner Labels
10.3.7.2 U.K.: Variable Data Printing Market in Labels, By Composition
10.3.7.2.1 Facestock is Projected to Grow at A Considerable Rate From 2016 to 2021 in the U.K.
10.3.7.3 U.K.: Variable Data Printing Market in Labels, By Printing Technology
10.3.7.3.1 Thermal Transfer Technology is Mostly Used for Variable Data Printing on Labels
10.3.7.4 U.K.: Variable Data Printing Market in Labels, By End-Use Sector
10.3.7.4.1 After Food & Beverage, Consumer Durables Dominated the Market in the U.K. in 2015
10.3.8 France
10.3.8.1 France: Variable Data Printing Market in Labels, By Label Type
10.3.8.1.1 Release Liner Labels Was the Largest Segment in the French Variable Data Printing Market in Labels in 2015
10.3.8.2 France: Variable Data Printing Market in Labels, By Composition
10.3.8.2.1 Facestock to Lead the Market in France Through 2021
10.3.8.3 France: Variable Data Printing Market in Labels, By Printing Technology
10.3.8.3.1 Inkjet to Register the Highest Growth Rate During the Forecast Period
10.3.8.4 France: Variable Data Printing Market in Labels, By End-Use Sector
10.3.8.4.1 Variable Data Printed Labels Widely Used in the Food & Beverage Sector
10.3.9 Rest of Europe
10.3.9.1 Rest of Europe: Variable Data Printing Market in Labels, By Label Type
10.3.9.1.1 Linerless Labels are Gaining Popularity in the Rest of Europe
10.3.9.2 Rest of Europe: Variable Data Printing Market in Labels, By Composition
10.3.9.2.1 Facestock is Gaining Popularity in the Rest of Europe
10.3.9.3 Rest of Europe: Variable Data Printing Market in Labels, By Printing Technology
10.3.9.3.1 Thermal Transfer to Be the Second-Fastest Growing Printing Technology in the Rest of Europe From 2016 to 2021
10.3.9.4 Rest of Europe: Variable Data Printing Market in Labels, By End-Use Sector
10.3.9.4.1 Food & Beverage Accounted for the Largest Share in 2015
10.4 Asia-Pacific
10.4.1 Asia-Pacific: Variable Data Printing Market in Labels, By Country
10.4.1.1 China is Projected to Be the Fastest-Growing Market During the Forecast Period
10.4.2 Asia-Pacific: Variable Data Printing Market in Labels, By Label Type
10.4.2.1 The Release Liner Labels Segment Dominated the Asia-Pacific Variable Data Printing Market in Labels in 2015
10.4.3 Asia-Pacific: Variable Data Printing Market in Labels, By Composition
10.4.3.1 The Facestock Segment Accounted for A Larger Market Share in Asia-Pacific in 2015
10.4.4 Asia-Pacific: Variable Data Printing Market in Labels, By Printing Technology
10.4.4.1 Inkjet Technology Segment is Projected to Grow at the Highest CAGR During the Forecast Period
10.4.5 Asia-Pacific: Variable Data Printing Market in Labels, By End-Use Sector
10.4.5.1 Food & Beverage Sector Dominated the Asia-Pacific Variable Data Printing Market in Labels in 2015
10.4.6 China
10.4.6.1 China: Variable Data Printing Market in Labels, By Label Type
10.4.6.1.1 Release Liner Labels Dominated the Chinese Variable Data Printing Market in Labels in 2015
10.4.6.2 China: Variable Data Printing Market in Labels, By Composition
10.4.6.2.1 The Facestock Segment Accounted for A Larger Market Share in China in 2015
10.4.6.3 China: Variable Data Printing Market in Labels, By Printing Technology
10.4.6.3.1 Thermal Transfer Segment is Projected to Grow at the Second-Highest CAGR During the Forecast Period
10.4.6.4 China: Variable Data Printing Market in Labels, By End-Use Sector
10.4.6.4.1 The Pharmaceutical Sector to Be the Fastest-Growing Segment in the Chinese Market From 2016 to 2021
10.4.7 Japan
10.4.7.1 Japan: Variable Data Printing Market in Labels, By Label Type
10.4.7.1.1 The Release Liner Labels Segment Dominated the Japanese Variable Data Printing Market in Labels in 2015
10.4.7.2 Japan: Variable Data Printing Market in Labels, By Composition
10.4.7.2.1 The Facestock Composition Segment Accounted for A Larger Market Share in Japan in 2015
10.4.7.3 Japan: Variable Data Printing Market in Labels, By Printing Technology
10.4.7.3.1 Inkjet Technology Segment is Projected to Grow at the Highest CAGR During the Forecast Period
10.4.7.4 Japan: Variable Data Printing Market in Labels, By End-Use Sector
10.4.7.4.1 Consumer Durables Held the Second-Largest Market Share in Japan in 2015
10.4.8 India
10.4.8.1 India: Variable Data Printing Market in Labels, By Label Type
10.4.8.1.1 The Release Liner Labels Segment Dominated the Market in India in 2015
10.4.8.2 India: Variable Data Printing Market in Labels, By Composition
10.4.8.2.1 Facestock Segment is Projected to Grow at A Higher CAGR During the Forecast Period
10.4.8.3 India: Variable Data Printing Market in Labels, By Printing Technology
10.4.8.3.1 Thermal Transfer Segment is Projected to Grow at the Second-Highest CAGR During the Forecast Period
10.4.8.4 India: Variable Data Printing Market in Labels, By End-Use Sector
10.4.8.4.1 The Food & Beverage Sector Dominated the Variable Data Printing Market in Labels in India in 2015
10.4.9 Australia
10.4.9.1 Australia: Variable Data Printing Market in Labels, By Label Type
10.4.9.1.1 The Release Liner Labels Segment Dominated the Australian Variable Data Printing Market in Labels in 2015
10.4.9.2 Australia: Variable Data Printing Market in Labels, By Composition
10.4.9.2.1 The Facestock Segment Accounted for A Larger Market Share in Australia in 2015
10.4.9.3 Australia: Variable Data Printing Market in Labels, By Printing Technology
10.4.9.3.1 Direct Thermal Accounted for the Second-Largest Market Share in Australia in 2015
10.4.9.4 Australia: Variable Data Printing Market in Labels, By End-Use Sector
10.4.9.4.1 The Food & Beverages Sector is Projected to Be the Fastest-Growing in Australia From 2016 to 2021
10.4.10 Rest of Asia-Pacific
10.4.10.1 Rest of Asia-Pacific: Variable Data Printing Market in Labels, By Label Type
10.4.10.1.1 The Release Liner Labels Dominated the Rest of Asia-Pacific Market in 2015
10.4.10.2 Rest of Asia-Pacific: Variable Data Printing Market in Labels, By Composition
10.4.10.2.1 The Facestock Segment Accounted for A Larger Market Share in the Rest of Asia-Pacific in 2015
10.4.10.3 Rest of Asia-Pacific: Variable Data Printing Market in Labels, By Printing Technology
10.4.10.3.1 Inkjet Technology Segment is Projected to Grow at the Highest CAGR During the Forecast Period
10.4.10.4 Rest of Asia-Pacific: Variable Data Printing Market in Labels, By End-Use Sector
10.4.10.4.1 Food & Beverage Sector Dominated the Rest of Asia-Pacific Market in 2015
10.5 Rest of the World
10.5.1 RoW: Variable Data Printing Market in Labels, By Country
10.5.1.1 Brazil Dominated the Market in the RoW Region in 2015
10.5.2 RoW: Variable Data Printing Market in Labels, By Label Type
10.5.2.1 The Release Liner Labels Segment Dominated the RoW Market
10.5.3 RoW: Variable Data Printing Market in Labels, By Composition
10.5.3.1 The Facestock Segment Accounted for the Largest Market Share in RoW in 2015
10.5.4 RoW: Variable Data Printing Market in Labels, By Printing Technology
10.5.4.1 The Thermal Transfer Segment is Projected to Grow at the Second-Highest CAGR
10.5.5 RoW: Variable Data Printing Market in Labels, By End-Use Sector
10.5.5.1 The Food & Beverage Segment to Grow at the Highest CAGR From 2016 to 2021
10.5.6 Brazil
10.5.6.1 Brazil: Variable Data Printing Market in Labels, By Label Type
10.5.6.1.1 The Release Liner Labels Segment Dominated the Brazilian Market
10.5.6.2 Brazil: Variable Data Printing Market in Labels, By Composition
10.5.6.2.1 The Facestock Segment Accounted for the Largest Market Share in Brazil in 2015
10.5.6.3 Brazil: Variable Data Printing Market in Labels, By Printing Technology
10.5.6.3.1 The Direct Thermal Segment Accounted for the Second-Largest Market Share in Brazil in 2015
10.5.6.4 Brazil: Variable Data Printing Market in Labels, By End-Use Sector
10.5.6.4.1 The Pharmaceutical Sector to Be the Fastest-Growing End-Use Segment in the Brazilian Market From 2016 to 2021
10.5.7 Argentina
10.5.7.1 Argentina: Variable Data Printing Market in Labels, By Label Type
10.5.7.1.1 The Release Liner Labels Segment Accounted for the Largest Market Share in Argentina in 2015
10.5.7.2 Argentina: Variable Data Printing Market in Labels, By Composition
10.5.7.2.1 The Facestock Composition Segment Dominated the Market in 2015
10.5.7.3 Argentina: Variable Data Printing Market in Labels, By Printing Technology
10.5.7.3.1 The Thermal Transfer Segment is Projected to Grow at the Second-Highest CAGR
10.5.7.4 Argentina: Variable Data Printing Market in Labels, By End-Use Sector
10.5.7.4.1 Consumer Durables Accounted for the Second-Largest Share in Argentina in 2015
10.5.8 South Africa
10.5.8.1 South Africa: Variable Data Printing Market in Labels, By Label Type
10.5.8.1.1 Release Liner Labels Dominated the South African Variable Data Printing Market in Labels
10.5.8.2 South Africa: Variable Data Printing Market in Labels, By Composition
10.5.8.2.1 The Facestock Segment Accounted for the Largest Market Share in South Africa in 2015
10.5.8.3 South Africa: Variable Data Printing Market in Labels, By Printing Technology
10.5.8.3.1 The Inkjet Technology Segment is Projected to Grow at the Highest CAGR During the Forecast Period
10.5.8.4 South Africa: Variable Data Printing Market in Labels, By End-Use Sector
10.5.8.4.1 The Food & Beverage Sector Dominated the South African Market
10.5.9 Others in RoW
10.5.9.1 Others in RoW: Variable Data Printing Market in Labels, By Label Type
10.5.9.1.1 The Release Liner Labels Segment Dominated the Market in This Region in 2015
10.5.9.2 Others in RoW: Variable Data Printing Market in Labels, By Composition
10.5.9.2.1 The Facestock Segment Projected to Be the Fastest-Growing Segment From 2016 to 2021
10.5.9.3 Others in RoW: Variable Data Printing Market in Labels, By Printing Technology
10.5.9.3.1 The Direct Thermal Segment Accounted for the Second-Largest Market Share in 2015
10.5.9.4 Others in RoW: Variable Data Printing Market Size in Labels, By End-Use Sector
10.5.9.4.1 Consumer Durables Accounted for the Second-Largest Market Share in In 2015
11 Competitive Landscape (Page No. - 178)
11.1 Overview
11.1.1 Growth Scenario of Top Five Companies in the Variable Data Printing Market in Labels (2011�2015)
11.2 Competitive Situation & Trends
11.2.1 New Product Launches and Technological Advancement Was the Most Dominant Strategy, While Xerox Corporation Was Observed to Be the Most Active Player
11.2.2 New Product Launches and Technological Advancements Were the Key Strategies Undertaken By Market Leaders in the Variable Data Printing Market in Labels
11.2.3 New Product Launches & Technological Advancements
11.3 Mergers & Acquisitions
11.4 Expansions & Divestitures
11.5 Agreements & Partnerships
12 Company Profiles (Page No. - 185)
12.1 Introduction
(Business Overview, Products & Services, Key Insights, Recent Developments, SWOT Analysis, Ratio Analysis, MnM View)*
12.2 HP Inc.
12.3 Canon, Inc.
12.4 3M Company
12.5 Xerox Corporation
12.6 RR Donnelley & Sons Company
12.7 Mondi PLC
12.8 Avery Dennison Corporation
12.9 Quad/Graphics, Inc.
12.10 Cenveo, Inc.
12.11 Ws Packaging Group, Inc.
*Details on Business Overview, Products & Services, Key Insights, Recent Developments, SWOT Analysis, Mnm View Might Not Be Captured in Case of Unlisted Companies.
13 Appendix (Page No. - 214)
13.1 Discussion Guide
13.2 Knowledge Store: Marketsandmarkets� Subscription Portal
13.3 Introducing RT: Real Time Market Intelligence
13.4 Available Customizations
13.5 Related Reports
List of Tables (223 Tables)
Table 1 Variable Data Printing Market Size in Labels, By Label Type, 2014�2021 (USD Million)
Table 2 By Market Size in Labels, By Label Type, 2014�2021 (Billion A4 Sheets)
Table 3 By Market Size for Release Liner Labels, By Region, 2014�2021 (USD Million)
Table 4 By Market Size for Release Liner Labels, By Region, 2014�2021 (Billion A4 Sheets)
Table 5 By Market Size for Linerless Labels, By Region, 2014�2021 (USD Million)
Table 6 By Market Size for Linerless Labels, By Region, 2014�2021 (Billion A4 Sheets)
Table 7 By Market Size in Labels, By Composition, 2014�2021 (USD Million)
Table 8 By Market Size in Labels, By Composition, 2014�2021 (Billion A4 Sheets)
Table 9 Variable Data Printing Market Size for Facestock, By Region, 2014�2021 (USD Million)
Table 10 By Market Size for Facestock, By Region, 2014�2021 (Billion A4 Sheets)
Table 11 By Market Size for Topcoat, By Region, 2014�2021 (USD Million)
Table 12 By Market Size for Topcoat, By Region, 2014�2021 (Billion A4 Sheets)
Table 13 By Market Size in Labels, By Printing Technology, 2014�2021 (USD Million)
Table 14 By Market Size in Labels, By Printing Technology, 2014�2021 (Billion A4 Sheets)
Table 15 Thermal Transfer Variable Data Printing Market Size in Labels, By Region, 2014�2021 (USD Million)
Table 16 Thermal Transfer Variable Data Printing Market Size in Labels, By Region, 2014�2021 (Billion A4 Sheets)
Table 17 Direct Thermal Variable Data Printing Market Size in Labels, By Region, 2014�2021 (USD Million)
Table 18 Direct Thermal Variable Data Printing Market Size in Labels, By Region, 2014�2021 (Billion A4 Sheets)
Table 19 Electrophotography Variable Data Printing Market Size in Labels, By Region, 2014�2021 (USD Million)
Table 20 Electrophotography Variable Data Printing Market Size in Labels, By Region, 2014�2021 (Billion A4 Sheets)
Table 21 Inkjet Variable Data Printing Market Size in Labels, By Region, 2014�2021 (USD Million)
Table 22 Inkjet Variable Data Printing Market Size in Labels, By Region, 2014�2021 (Billion A4 Sheets)
Table 23 Variable Data Printing Market Size in Labels, By End-Use Sector, 2014�2021 (USD Million)
Table 24 By Market Size in Labels, By End-Use Sector, 2014�2021 (Billion A4 Sheets)
Table 25 By Market Size in Labels in Food & Beverage, By Region, 2014�2021 (USD Million)
Table 26 By Market Size in Labels in Food & Beverage, By Region, 2014�2021 (Billion A4 Sheets)
Table 27 By Market Size in Labels in Consumer Durables, By Region, 2014�2021 (USD Million)
Table 28 By Market Size in Labels in Consumer Durables, By Region, 2014�2021 (Billion A4 Sheets)
Table 29 Variable Data Printing Market Size in Labels in Pharmaceuticals, By Region, 2014�2021 (USD Million)
Table 30 By Market Size in Labels in Pharmaceuticals, By Region, 2014�2021 (Billion A4 Sheets)
Table 31 By Market Size in Labels in Home & Personal Care, By Region, 2014�2021 (USD Million)
Table 32 By Market Size in Labels in Home & Personal Care, By Region, 2014�2021 (Billion A4 Sheets)
Table 33 By Market Size in Labels in Retail, By Region, 2014�2021 (USD Million)
Table 34 By Market Size in Labels in Retail, By Region, 2014�2021 (Billion A4 Sheets)
Table 35 Variable Data Printing Market Size in Labels Market in Other End-Use Sectors, By Region, 2014�2021 (USD Million)
Table 36 By Market Size in Labels Market in Other End-Use Sectors, By Region, 2014�2021 (Billion A4 Sheets)
Table 37 By Market Size in Labels, By Region, 2014�2021 (USD Million)
Table 38 By Market Size in Labels, By Region, 2014�2021 (Billion A4 Sheets)
Table 39 North America: By Market Size in Labels, By Country, 2014�2021 (USD Million)
Table 40 North America: By Market Size in Labels, By Country, 2014�2021 (Billion A4 Sheets)
Table 41 North America: By Market Size in Labels, By Label Type, 2014�2021 (USD Million)
Table 42 North America: Variable Data Printing Market Size in Labels, By Label Type 2014�2021 (Billion A4 Sheets)
Table 43 North America: By Market Size in Labels, By Composition, 2014�2021 (USD Million)
Table 44 North America: By Market Size in Labels, By Composition, 2014�2021 (Billion A4 Sheets)
Table 45 North America: By Market Size in Labels, By Printing Technology, 2014�2021 (USD Million)
Table 46 North America: By Market Size in Labels, By Printing Technology, 2014�2021 (Billion A4 Sheets)
Table 47 North America: By Market Size in Labels, By End-Use Sector, 2014�2021 (USD Million)
Table 48 North America: By Market Size in Labels, By End-Use Sector, 2014�2021 (Billion A4 Sheets)
Table 49 U.S.: Economic Indicators
Table 50 U.S.: Variable Data Printing Market Size in Labels, By Label Type, 2014�2021 (USD Million)
Table 51 U.S.: By Market Size in Labels, By Label Type, 2014�2021 (Billion A4 Sheets)
Table 52 U.S.: By Market Size in Labels, By Composition, 2014�2021 (USD Million)
Table 53 U.S.: By Market Size in Labels, By Composition, 2014�2021 (Billion A4 Sheets)
Table 54 U.S.: By Market Size in Labels, By Printing Technology, 2014�2021 (USD Million)
Table 55 U.S.: By Market Size in Labels, By Printing Technology, 2014�2021 (Billion A4 Sheets)
Table 56 U.S.: By Market Size in Labels, By End-Use Sector, 2014�2021 (USD Million)
Table 57 U.S.: By Market Size in Labels, By End-Use Sector, 2014�2021 (Billion A4 Sheets)
Table 58 Canada: Economic Indicators
Table 59 Canada: By Market Size in Labels, By Label Type, 2014�2021 (USD Million)
Table 60 Canada: Variable Data Printing Market Size in Labels, By Label Type, 2014�2021 (Billion A4 Sheets)
Table 61 Canada: By Market Size in Labels, By Composition, 2014�2021 (USD Million)
Table 62 Canada: By Market Size in Labels, By Composition, 2014�2021 (Billion A4 Sheets)
Table 63 Canada: By Market Size in Labels, By Printing Technology, 2014�2021 (USD Million)
Table 64 Canada: By Market Size in Labels, By End-Use Sector, 2014�2021 (USD Million)
Table 66 Canada: By Market Size in Labels, By End-Use Sector, 2014�2021 (Billion A4 Sheets)
Table 67 Mexico: Economic Indicators
Table 68 Mexico: Variable Data Printing Market Size in Labels, By Label Type, 2014�2021 (USD Million)
Table 69 Mexico: By Market Size in Labels, By Label Type, 2014�2021 (Billion A4 Sheets)
Table 70 Mexico: By Market Size in Labels, By Composition, 2014�2021 (USD Million)
Table 71 Mexico: By Market Size in Labels, By Composition, 2014�2021 (Billion A4 Sheets)
Table 72 Mexico: Variable Data Printing Market Size in Labels, By Printing Technology, 2014�2021 (USD Million)
Table 73 Mexico: By Market Size in Labels, By Printing Technology, 2014�2021 (Billion A4 Sheets)
Table 74 Mexico: By Market Size in Labels, By End-Use Sector, 2014�2021 (USD Million)
Table 75 Mexico: By Market Size in Labels, By End-Use Sector, 2014�2021 (Billion A4 Sheets)
Table 76 Europe: By Market Size in Labels, By Country, 2014�2021 (USD Million)
Table 77 Europe: By Market Size in Labels, By Country, 2014�2021 (Billion A4 Sheets)
Table 78 Europe: By Market Size in Labels, By Label Type, 2014�2021 (USD Million)
Table 79 Europe: Variable Data Printing Market Size in Labels, By Label Type, 2014�2021 (Billion A4 Sheets)
Table 80 Europe: By Market Size in Labels, By Composition, 2014�2021 (USD Million)
Table 81 Europe: By Market Size in Labels, By Composition, 2014�2021 (Billion A4 Sheets)
Table 82 Europe: By Market Size in Labels, By Printing Technology, 2014�2021 (USD Million)
Table 83 Europe: By Market Size in Labels, By Printing Technology, 2014�2021 (Billion A4 Sheets)
Table 84 Europe: Variable Data Printing Market Size in Labels, By End-Use Sector, 2014�2021 (USD Million)
Table 85 Europe: By Market Size in Labels, By End-Use Sector, 2014�2021 (Billion A4 Sheets)
Table 86 Germany: Economic Indicators
Table 87 Germany: Variable Data Printing Market Size in Labels, By Label Type, 2014�2021 (USD Million)
Table 88 Germany: By Market Size in Labels, By Label Type, 2014�2021 (Billion A4 Sheets)
Table 89 Germany: By Market Size in Labels, By Composition, 2014�2021 (USD Million)
Table 90 Germany: By Market Size in Labels, By Composition, 2014�2021 (Billion A4 Sheets)
Table 91 Germany: By Market Size in Labels, By Printing Technology, 2014�2021 (USD Million)
Table 92 Germany: By Market Size in Labels, By Printing Technology, 2014�2021 (Billion A4 Sheets)
Table 93 Germany: By Market Size in Labels, By End-Use Sector, 2014�2021 (USD Million)
Table 94 Germany: By Market Size in Labels, By End-Use Sector, 2014�2021 (Billion A4 Sheets)
Table 95 U.K.: Economic Indicators
Table 96 U.K.: By Market Size in Labels, By Label Type, 2014�2021 (USD Million)
Table 97 U.K.: By Market Size in Labels, By Label Type, 2014�2021 (Billion A4 Sheets)
Table 98 U.K.: Market Size in Labels, By Composition, 2014�2021 (USD Million)
Table 99 U.K.: Variable Data Printing Market Size in Labels, By Composition, 2014�2021 (Billion A4 Sheets)
Table 100 U.K.: By Market Size in Labels, By Printing Technology, 2014�2021 (USD Million)
Table 101 U.K.: By Market Size in Labels, By Printing Technology, 2014�2021 (Billion A4 Sheets)
Table 102 U.K.: By Market Size in Labels, By End-Use Sector, 2014�2021 (USD Million)
Table 103 U.K.: By Market Size in Labels, By End-Use Sector, 2014�2021 (Billion A4 Sheets)
Table 104 France: Economic Indicators
Table 105 France: Variable Data Printing Market Size in Labels, By Label Type, 2014�2021 (USD Million)
Table 106 France: By Market Size in Labels, By Label Type, 2014�2021 (Billion A4 Sheets)
Table 107 France: By Market Size in Labels, By Composition, 2014�2021 (USD Million)
Table 108 France: By Market Size in Labels, By Composition, 2014�2021 (Billion A4 Sheets)
Table 109 France: By Market Size in Labels, By Printing Technology, 2014�2021 (USD Million)
Table 110 France: Variable Data Printing Market Size in Labels, By Printing Technology, 2014�2021 (Billion A4 Sheets)
Table 111 France: By Market Size in Labels, By End-Use Sector, 2014�2021 (USD Million)
Table 112 France: By Market Size in Labels, By End-Use Sector, 2014�2021 (Billion A4 Sheets)
Table 113 Rest of Europe: By Market Size in Labels, By Label Type, 2014�2021 (USD Million)
Table 114 Rest of Europe: By Market Size in Labels, By Label Type, 2014�2021 (Billion A4 Sheets)
Table 115 Rest of Europe: Variable Data Printing Market Size in Labels, By Composition, 2014�2021 (USD Million)
Table 116 Rest of Europe: By Market Size in Labels, By Composition, 2014�2021 (Billion A4 Sheets)
Table 117 Rest of Europe: By Market Size in Labels, By Printing Technology, 2014�2021 (USD Million)
Table 118 Rest of Europe: By Market Size in Labels, By Printing Technology, 2014�2021 (Billion A4 Sheets)
Table 119 Rest of Europe: By Market Size in Labels, By End-Use Sector, 2014�2021 (USD Million)
Table 120 Rest of Europe: By Market Size in Labels, By End-Use Sector, 2014�2021 (Billion A4 Sheets)
Table 121 Asia-Pacific: By Market Size in Labels, By Country, 2014�2021 (USD Million)
Table 122 Asia-Pacific: Variable Data Printing Market Size in Labels, By Country, 2014�2021 (Billion A4 Sheets)
Table 123 Asia-Pacific: By Market Size in Labels, By Label Type, 2014�2021 (USD Million)
Table 124 Asia-Pacific: By Market Size in Labels, By Label Type 2014�2021 (Billion A4 Sheets)
Table 125 Asia-Pacific: By Market Size in Labels, By Composition, 2014�2021 (USD Million)
Table 126 Asia-Pacific: By Market Size in Labels, By Composition, 2014�2021 (Billion A4 Sheets)
Table 127 Asia-Pacific: By Market Size in Labels, By Printing Technology, 2014�2021 (USD Million)
Table 128 Asia-Pacific: By Market Size in Labels, By Printing Technology, 2014�2021 (Billion A4 Sheets)
Table 129 Asia-Pacific: By Market Size in Labels, By End-Use Sector, 2014�2021 (USD Million)
Table 130 Asia-Pacific: By Market Size in Labels, By End-Use Sector, 2014�2021 (Billion A4 Sheets)
Table 131 China: Economic Indicators
Table 132 China: Variable Data Printing Market Size in Labels, By Label Type, 2014�2021 (USD Million)
Table 133 China: By Market Size in Labels, By Label Type, 2014�2021 (Billion A4 Sheets)
Table 134 China: By Market Size in Labels, By Composition, 2014�2021 (USD Million)
Table 135 China: By Market Size in Labels, By Composition, 2014�2021 (Billion A4 Sheets)
Table 136 China: By Market Size in Labels, By Printing Technology, 2014�2021 (USD Million)
Table 137 China: By Market Size in Labels, By Printing Technology, 2014�2021 (Billion A4 Sheets)
Table 138 China: Variable Data Printing Market Size in Labels, By End-Use Sector, 2014�2021 (USD Million)
Table 139 China: By Market Size in Labels, By End-Use Sector, 2014�2021 (Billion A4 Sheets)
Table 140 Japan: Economic Indicators
Table 141 Japan: By Market Size in Labels, By Label Type, 2014�2021 (USD Million)
Table 142 Japan: By Market Size in Labels, By Label Type, 2014�2021 (Billion A4 Sheets)
Table 143 Japan: Variable Data Printing Market Size in Labels, By Composition, 2014�2021 (USD Million)
Table 144 Japan: By Market Size in Labels, By Composition, 2014�2021 (Billion A4 Sheets)
Table 145 Japan: By Market Size in Labels, By Printing Technology, 2014�2021 (USD Million)
Table 146 Japan: By Market Size in Labels, By Printing Technology, 2014�2021 (Billion A4 Sheets)
Table 147 Japan: By Market Size in Labels, By End-Use Sector, 2014�2021 (USD Million)
Table 148 Japan: Variable Data Printing Market Size in Labels, By End-Use Sector, 2014�2021 (Billion A4 Sheets)
Table 149 India: Economic Indicators
Table 150 India: By Market Size in Labels, By Label Type, 2014�2021 (USD Million)
Table 151 India: Market Size in Labels, By Label Type, 2014�2021 (Billion A4 Sheets)
Table 152 India: Variable Data Printing Market Size in Labels, By Composition, 2014�2021 (USD Million)
Table 153 India: By Market Size in Labels, By Composition, 2014�2021 (Billion A4 Sheets)
Table 154 India: By Market Size in Labels, By Printing Technology, 2014�2021 (USD Million)
Table 155 India: By Market Size in Labels, By Printing Technology, 2014�2021 (Billion A4 Sheets)
Table 156 India: By Market Size in Labels, By End-Use Sector, 2014�2021 (USD Million)
Table 157 India: By Market Size in Labels, By End-Use Sector, 2014�2021 (Billion A4 Sheets)
Table 158 Australia: Economic Indicators
Table 159 Australia: By Market Size in Labels, By Label Type, 2014�2021 (USD Million)
Table 160 Australia: Variable Data Printing Market Size in Labels, By Label Type, 2014�2021 (Billion A4 Sheets)
Table 161 Australia: By Market Size in Labels, By Composition, 2014�2021 (USD Million)
Table 162 Australia: By Market Size in Labels, By Composition, 2014�2021 (Billion A4 Sheets)
Table 163 Australia: By Market Size in Labels, By Printing Technology, 2014�2021 (USD Million)
Table 164 Australia: By Market Size in Labels, By Printing Technology, 2014�2021 (Billion A4 Sheets)
Table 165 Australia: By Market Size in Labels, By End-Use Sector, 2014�2021 (USD Million)
Table 166 Australia: Variable Data Printing Market Size in Labels, By End-Use Sector, 2014�2021 (Billion A4 Sheets)
Table 167 Rest of Asia-Pacific: By Market Size in Labels, By Label Type, 2014�2021 (USD Million)
Table 168 Rest of Asia-Pacific: By Market Size in Labels, By Label Type, 2014�2021 (Billion A4 Sheets)
Table 169 Rest of Asia-Pacific: Variable Data Printing Market Size in Labels, By Composition, 2014�2021 (USD Million)
Table 170 Rest of Asia-Pacific: By Market Size in Labels, By Composition, 2014�2021 (Billion A4 Sheets)
Table 171 Rest of Asia-Pacific: By Market Size in Labels, By Printing Technology, 2014�2021 (USD Million)
Table 172 Rest of Asia-Pacific: By Market Size in Labels, By Printing Technology, 2014�2021 (Billion A4 Sheets)
Table 173 Rest of Asia-Pacific: By Market Size in Labels, By End-Use Sector, 2014�2021 (USD Million)
Table 174 Rest of Asia-Pacific: By Market Size in Labels, By End-Use Sector, 2014�2021 (Billion A4 Sheets)
Table 175 RoW: By Market Size in Labels, By Country, 2014�2021 (USD Million)
Table 176 RoW: By Market Size in Labels, By Country, 2014�2021 (Billion A4 Sheets)
Table 177 RoW: By Market Size in Labels, By Label Type, 2014�2021 (USD Million)
Table 178 RoW: By Market Size in Labels, By Label Type, 2014�2021 (Billion A4 Sheets)
Table 179 RoW: By Market Size in Labels, By Composition, 2014�2021 (USD Million)
Table 180 RoW: By Market Size in Labels, By Composition, 2014�2021 (Billion A4 Sheets)
Table 181 RoW: By Market Size in Labels, By Printing Technology, 2014�2021 (USD Million)
Table 182 RoW: By Market Size in Labels, By Printing Technology, 2014�2021 (Billion A4 Sheets)
Table 183 RoW: By Market Size in Labels, By End-Use Sector, 2014�2021 (USD Million)
Table 184 RoW: By Market Size in Labels, By End-Use Sector, 2014�2021 (Billion A4 Sheets)
Table 185 Brazil: Economic Indicators
Table 186 Brazil: By Market Size in Labels, By Label Type, 2014�2021 (USD Million)
Table 187 Brazil: By Market Size in Labels, By Label Type, 2014�2021 (Billion A4 Sheets)
Table 188 Brazil: By Market Size in Labels, By Composition, 2014�2021 (USD Million)
Table 189 Brazil: By Market Size in Labels, By Composition, 2014�2021 (Billion A4 Sheets)
Table 190 Brazil: By Market Size in Labels, By Printing Technology, 2014�2021 (USD Million)
Table 191 Brazil: By Market Size in Labels, By Printing Technology, 2014�2021 (Billion A4 Sheets)
Table 192 Brazil: By Market Size in Labels, By End-Use Sector, 2014�2021 (USD Million)
Table 193 Brazil: By Market Size in Labels, By End-Use Sector, 2014�2021 (Billion A4 Sheets)
Table 194 Argentina: Economic Indicators
Table 195 Argentina: By Market Size in Labels, By Label Type, 2014�2021 (USD Million)
Table 196 Argentina: By Market Size in Labels, By Label Type, 2014�2021 (Billion A4 Sheets)
Table 197 Argentina: By Market Size in Labels, By Composition, 2014�2021 (USD Million)
Table 198 Argentina: By Market Size in Labels, By Composition, 2014�2021 (Billion A4 Sheets)
Table 199 Argentina: By Market Size in Labels, By Printing Technology, 2014�2021 (USD Million)
Table 200 Argentina: By Market Size in Labels, By Printing Technology, 2014�2021 (Billion A4 Sheets)
Table 201 Argentina: By Market Size in Labels Size, By End-Use Sector, 2014�2021 (USD Million)
Table 202 Argentina: By Market Size in Labels, By End-Use Sector, 2014�2021 (Billion A4 Sheets)
Table 203 South Africa: Economic Indicators
Table 204 South Africa: By Market Size in Labels, By Label Type, 2014�2021 (USD Million)
Table 205 South Africa: By Market Size in Labels, By Label Type 2014�2021 (Billion A4 Sheets)
Table 206 South Africa: By Market Size in Labels, By Composition, 2014�2021 (USD Million)
Table 207 South Africa: By Market Size in Labels, By Composition, 2014�2021 (Billion A4 Sheets)
Table 208 South Africa: By Market Size in Labels, By Printing Technology, 2014�2021 (USD Million)
Table 209 South Africa: By Market Size in Labels, By Printing Technology, 2014�2021 (Billion A4 Sheets)
Table 210 South Africa: By Market Size in Labels, By End-Use Sector, 2014�2021 (USD Million)
Table 211 South Africa: By Market Size in Labels, By End-Use Sector, 2014�2021 (Billion A4 Sheets)
Table 212 Others in RoW: By Market Size in Labels, By Label Type, 2014�2021 (USD Million)
Table 213 Others in RoW: By Market Size in Labels, By Label Type 2014�2021 (Billion A4 Sheets)
Table 214 Others in RoW: By Market Size in Labels, By Composition, 2014�2021 (USD Million)
Table 215 Others in RoW: By Market Size in Labels, By Composition, 2014�2021 (Billion A4 Sheets)
Table 216 Others in RoW: By Market Size in Labels, By Printing Technology, 2014�2021 (USD Million)
Table 217 Others in RoW: By Market Size in Labels, By Printing Technology, 2014�2021 (Billion A4 Sheets)
Table 218 Others in RoW: By Size in Labels, By End-Use Sector, 2014�2021 (USD Million)
Table 219 Others in RoW: By Market Size in Labels, By End-Use Sector, 2014�2021 (Billion A4 Sheets)
Table 220 New Product Launches & Technological Advancements, 2013�2016
Table 221 Mergers & Acquisitions, 2013�2016
Table 222 Expansions& Divestitures, 2014�2016
Table 223 Agreements & Partnerships, 2012�2016
List of Figures (42 Figures)
Figure 1 Variable Data Printing Market in Labels
Figure 2 Variable Data Printing Market in Labels, Regional Scope
Figure 3 Variable Data Printing Market in Labels: Research Design
Figure 4 Market Size Estimation Methodology: Bottom-Up Approach
Figure 5 Market Size Estimation Methodology: Top-Down Approach
Figure 6 Data Triangulation Methodology
Figure 7 Variable Data Printing Market in Labels Snapshot (2016 vs 2021): Demand in the Food & Beverage Sector to Grow at the Highest CAGR
Figure 8 Release Liner Labels to Be the Fastest-Growing Segment By 2021
Figure 9 Emerging Economies Offer Attractive Opportunities in the Variable Data Printing Market in Labels
Figure 10 Food & Beverage Sector Accounted for the Largest Market Share in 2015
Figure 11 Facestock Segment is Projected to Be the Largest During the Forecast Period
Figure 12 The Largest Share Was Captured By China in the Emerging Asia-Pacific Variable Data Printing Market in Labels in 2015
Figure 13 Asia-Pacific is Projected to Be the Fastest-Growing Variable Data Printing Market in Labels, Between 2016 and 2021
Figure 14 Variable Data Printing Market in Labels Segmentation
Figure 15 Growth of End-Use Sectors Results in Increased Demand for Variable Data Printing in Labels
Figure 16 Variable Data Printing Market in Labels to Be Dominated By Release Liner Labels By 2021
Figure 17 The Variable Data Printing Market in Labels is Estimated to Be Dominated By Facestock in 2016
Figure 18 Variable Data Printing Market in Labels, By Printing Technology, 2016 vs 2021 (USD Million)
Figure 19 The Variable Data Printing Market in Labels Was Dominated By the Food & Beverage Sector in 2016
Figure 20 Geographic Snapshot (2016�2021): Market in China is Projected to Grow at the Highest Rate
Figure 21 North America: Market Snapshot
Figure 22 Europe: Market Snapshot
Figure 23 Asia-Pacific: Market Snapshot
Figure 24 Companies Adopted New Product Launches and Technological Advancement as the Key Growth Strategies During the Studied Period (2011�2016)
Figure 25 RR Donnelley & Sons Company Grew at the Highest Rate From, 2011 to 2015
Figure 26 Annual Developments in the Variable Data Printing Market in Labels, 2011�2016
Figure 27 New Product Launches and Technological Advancements: the Key Strategies, 2011�2016
Figure 28 Geographic Revenue Mix of Top Five Players
Figure 29 HP Inc.: Company Snapshot
Figure 30 SWOT Analysis: HP Inc.
Figure 31 Canon, Inc.: Company Snapshot
Figure 32 SWOT Analysis: Canon, Inc.
Figure 33 3M Company: Company Snapshot
Figure 34 3M Company: SWOT Analysis
Figure 35 Xerox Corporation: Company Snapshot
Figure 36 Xerox Corporation: SWOT Analysis
Figure 37 RR Donnelley & Sons Company: Company Snapshot
Figure 38 RR Donnelley & Sons Company: SWOT Analysis
Figure 39 Mondi PLC: Company Snapshot
Figure 40 Avery Dennison Corporation: Company Snapshot
Figure 41 Quad/Graphics, Inc.: Company Snapshot
Figure 42 Cenveo, Inc.: Company Snapshot


Growth opportunities and latent adjacency in Variable Data Printing Market