Utility Asset Management Market by Application (Transformer, Sub-Station, Transmission & Distribution Lines), Component (Hardware, Software), Utility Type (Public Utility, Private Utility), and Region - Global Forecast to 2022


[145 Pages Report] The global utility asset management market was valued at USD 2.57 Billion in 2016 and is expected to grow at a CAGR of 8.25%, from 2017 to 2022. Increasing demand for power, aging infrastructure, increased distributed energy resources, and requirement for efficient and reliable power are the factors driving the utility asset management market.
The years considered for the study are as follows:
- Base Year- 2016
- Estimated Year- 2017
- Projected Year- 2022
- Forecast Period- 2017 to 2022
The base year considered for company profiles is 2016. Whenever information was unavailable for the base year, the prior year has been considered.
Objectives of the Study
- To define, describe, segment, and forecast the global market by application, component, utility type, and region
- To provide detailed information about major factors influencing the growth of the market (drivers, restraints, opportunities, and industry-specific challenges)
- To strategically analyze the market with respect to individual growth trends, future prospects, and contribution of each segment to the market
- To analyze market opportunities for stakeholders and details of a competitive landscape for market leaders
- To track and analyze competitive developments, such as contracts & agreements, expansions, new product developments, and mergers & acquisitions in this market
- To benchmark players within the market using proprietary competitive leadership mapping, which analyzes market players on various parameters within broad categories of business and product strategy
- To strategically profile key players and comprehensively analyze their market shares and core competencies
Research Methodology
This research study involved the use of extensive secondary sources, directories, and databases, such as, Hoover�s, Bloomberg Businessweek, Factiva, and OneSource, to identify and collect information useful for a technical, market-oriented, and commercial study of the global market. Primary sources are mainly industry experts from core and related industries, service providers, technology developers, standard and certification organizations of the companies, and organizations related to all the segments of this industry�s supply chain. The points given below explain the research methodology.
- Study of the annual revenue and market developments of major players providing utility asset management
- Analysis of major utility type and demand for utility asset management from power operators
- Assessment of future trends and growth of utility asset management
- Assessment of the market with respect to the demand for each type of utility asset management system used for different applications
- Analysis of market trends in various regions or countries by studying the applications of utility asset management in various utility types
- Study of contracts and developments related to utility asset management by key players across different regions
- Finalization of overall market sizes by triangulating the supply-side data, which includes product developments and annual revenues of companies providing utility asset management across the globe
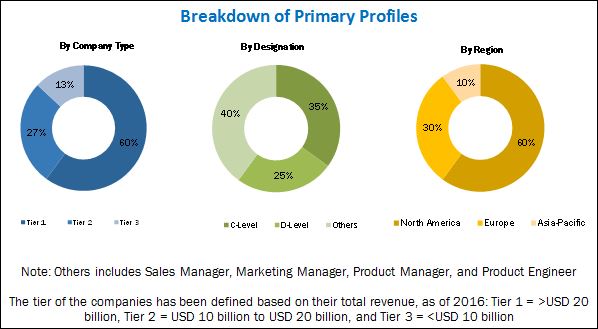
After arriving at the overall market size, the total market has been split into several segments and sub-segments. The figure given below illustrates the breakdown of primaries conducted during the research study on the basis of company type, designation, and region.
To know about the assumptions considered for the study, download the pdf brochure
Market Ecosystem:
The utility asset management ecosystem comprises energy software companies, such as, S&C Electric (US), ABB, Ltd. (Switzerland), Sentient Energy, Inc (US), Emerson Electric Co. (US), and Enetics Inc. (US). It also comprises smart grid solution companies, such as, Lindsey Manufacturing Co. (US), Siemens AG (Germany), NetControl OY (Finland), and CNIguard (UK).
Target Audience:
The target audience of this report includes:
- Equipment/Component asset management system providers
- Electric utilities
- Current/Voltagemeasurement device manufacturers and integrators
- Government agencies
- Investors and financial community professionals
- Market research and consulting firms
- Government and research organizations
Scope of the Report:
- By Application
- Transformer
- Sub-Station
- Transmission & Distribution Lines
- By Component
- Hardware
- Software
- By Utility Type
- Public Utility
- Private Utility
- By Region
- North America
- Asia Pacific
- Europe
- South America
- The Middle East & Africa
Available Customizations:
With the given market data, MarketsandMarkets offers customizations as per the client�s specific needs. The following customization options are available for this report:
Regional Analysis
Further breakdown of region or country-specific analysis
Company Information
Detailed analysis and profiling of additional market players (up to five)
The global utility asset management market is projected to grow at a CAGR of 8.25%, from 2017 to 2022, to reach a market size of USD 4.09 Billion by 2022. This growth is attributed to increasing investments in grid modernization, requirement for energy efficiency, increasing grid complexity, and necessity to reduce losses in T&D lines.
The report segments the utility asset management market, on the basis of application, into transformer, sub-station, and T&D lines. The transformer application segment is expected to account for the largest market share in the application segment as it is the most critical asset of the grid. In the North American region, investments for T&D upgradation are taking place in order to achieve energy efficiency and reduce T&D losses. While in the Asia Pacific region heavy investments in distributed energy resources being made by China, Australia, and India has resulted in the complexity of grid. This would provide an attractive market opportunity for utility asset management.
The market has been segmented, based on component, into hardware and software. The hardware segment is further classified into sensors, infrared cameras, and others which include feeder protection device and sensing transmitter. The software segment includes equipment/component management system, performance management system, and production management system. The hardware segment is expected to grow at the highest CAGR from 2017 to 2022, owing to the increasing upgradation of aging utility infrastructure.
In this report, the utility asset management market has been analyzed with respect to five regions, namely, North America, Europe, Asia Pacific, the Middle East and Africa, and South America. North America is projected to dominate the global market by 2022, owing to smart grid investment and aging T&D infrastructure in the region. The market in Asia Pacific is expected to grow at the highest CAGR from 2017 to 2022. This growth is attributed to growing industrialization and urbanization and rising renewable power generation capacity in the region. Countries, such as, India, Japan, and China are driving the utility asset management market in the Asia Pacific region.
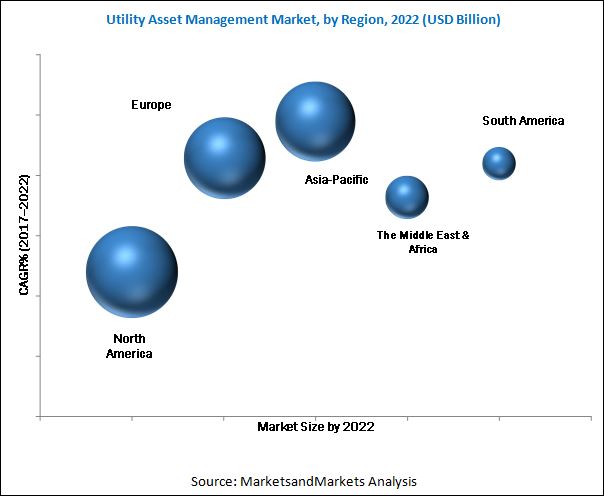
In this report, the utility asset management market has been analyzed with respect to five regions, namely, North America, Europe, Asia Pacific, the Middle East and Africa, and South America. The market in North America is expected to dominate the global market, during the forecast period, owing to increased investments in grid modernization, especially in the US.
Heavy cost implied to deploy the sensors for the monitoring of the assets could be the restrain for the market.
Leading players in the utility asset management market include Siemens AG (Germany), ABB, Ltd. (Switzerland), General Electric Company (US), and Emerson Electric (US). Contracts & agreements was the strategy most commonly adopted by top players, constituting 51.3% of the total developments, from 2014 to June 2017. It was followed by new product developments, mergers & acquisitions, and expansions.
To speak to our analyst for a discussion on the above findings, click Speak to Analyst
 Exclusive indicates content/data unique to MarketsandMarkets and not available with any competitors.
Table of Contents
1 Introduction (Page No. - 16)
1.1 Objectives of the Study
1.2 Market Definition
1.3 Market Scope
1.3.1 Utility Asset Management Market: Market Segmentation
1.3.2 Regional Scope
1.3.3 Years Considered for the Study
1.4 Currency
1.5 Limitations
1.6 Stakeholders
2 Research Methodology (Page No. - 20)
2.1 Research Data
2.1.1 Secondary Data
2.1.1.1 Key Data From Secondary Sources
2.1.2 Primary Data
2.1.2.1 Key Data From Primary Sources
2.1.2.2 Key Industry Insights
2.1.2.3 Breakdown of Primaries
2.2 Market Size Estimation
2.2.1 Bottom-Up Approach
2.2.2 Top-Down Approach
2.3 Market Breakdown & Data Triangulation
2.4 Research Assumptions
2.4.1 Assumptions of the Research Study
3 Executive Summary (Page No. - 28)
4 Premium Insights (Page No. - 32)
4.1 Utility Asset Management Market, By Region
4.2 Utility Asset Management Market, By Component
4.3 Utility Asset Management Market, By Software
4.4 Utility Asset Management Market, By Application
4.5 North American Utility Asset Management Market
5 Market Overview (Page No. - 35)
5.1 Introduction
5.2 Market Dynamics
5.2.1 Drivers
5.2.1.1 Upgradation of Aging Utility Infrastructure
5.2.1.2 Growing Investment in Distributed Generation and Related Government Regulations is expected to Drive the Market
5.2.1.3 Maximizing the Reliability and Resilience of the Power Network
5.2.2 Restraints
5.2.2.1 Capital Intensive Nature of Sensor Technology
5.2.3 Opportunities
5.2.3.1 Use of Software Analytics in Smart Grid Optimization
5.2.4 Challenges
5.2.4.1 Challenges Associated With New Technology Implementation
5.3 Supply Chain
5.3.1 Raw Material Suppliers
5.3.2 Enablers
5.3.3 End-Users
6 Utility Asset Management Market, By Application (Page No. - 43)
6.1 Introduction
6.2 Transformers
6.3 Substations
6.4 Transmission & Distribution Lines
7 Utility Asset Management Market, By Component (Page No. - 48)
7.1 Introduction
7.2 Hardware
7.2.1 Sensors
7.2.2 Infrared Cameras
7.2.3 Others
7.3 Software
7.3.1 Equipment/Component Management
7.3.2 Performance Management
7.3.3 Production Management
8 Utility Asset Management Market, By Utility Type (Page No. - 57)
8.1 Introduction
8.2 Public Utility
8.3 Private Utility
9 Utility Asset Management Market, By Region (Page No. - 61)
9.1 Introduction
9.2 North America
9.2.1 By Component
9.2.1.1 By Hardware
9.2.1.2 By Software
9.2.2 By Application
9.2.3 By Utility Type
9.2.4 By Country
9.2.4.1 The US
9.2.4.2 Canada
9.2.4.3 Mexico
9.3 Europe
9.3.1 By Component
9.3.1.1 By Hardware
9.3.1.2 By Software
9.3.2 By Application
9.3.3 By Utility Type
9.3.4 By Country
9.3.4.1 Germany
9.3.4.2 Denmark
9.3.4.3 UK
9.3.4.4 France
9.3.4.5 Italy
9.3.4.6 Spain
9.3.4.7 Norway
9.3.4.8 The Rest of Europe
9.4 Asia Pacific
9.4.1 By Component
9.4.1.1 By Hardware
9.4.1.2 By Software
9.4.2 By Application
9.4.3 By Utility Type
9.4.4 By Country
9.4.4.1 Australia
9.4.4.2 South Korea
9.4.4.3 Japan
9.4.4.4 China
9.4.4.5 India
9.4.4.6 The Rest of Asia Pacific
9.5 The Middle East & Africa
9.5.1 By Component
9.5.1.1 By Hardware
9.5.1.2 By Software
9.5.2 By Country
9.5.3 By Application
9.5.4 By Utility Type
9.5.4.1 Saudi Arabia
9.5.4.2 UAE
9.5.4.3 Iran
9.5.4.4 Kuwait
9.5.4.5 South Africa
9.5.4.6 Qatar
9.5.4.7 The Rest of the Middle East & Africa
9.6 South America
9.6.1 By Component
9.6.1.1 By Hardware
9.6.1.2 By Software
9.6.2 By Application
9.6.3 By Utility Type
9.6.4 By Country
9.6.4.1 Brazil
9.6.4.2 Argentina
9.6.4.3 The Rest of South America
10 Competitive Landscape (Page No. - 100)
10.1 Overview
10.2 Market Ranking, 2016
10.3 Competitive Situation & Trends
11 Company Profiles (Page No. - 103)
(Business Overview, Products Offered, Recent Developments, SWOT Analysis, MnM View)*
11.1 ABB Ltd
11.2 Siemens AG
11.3 General Electric Company
11.4 S&C Electric Company
11.5 Sentient Energy, Inc.
11.6 Aclara Technologies LLC
11.7 Emerson Electric Co.
11.8 Enetics Inc.
11.9 Lindsey Manufacturing Co.
11.10 Netcontrol OY
11.11 Cniguard Ltd
11.12 Vaisala OYJ
*Details on Business Overview, Products Offered, Recent Developments, SWOT Analysis, MnM View might not be captured in case of unlisted companies.
12 Appendix (Page No. - 138)
12.1 Insights of Industry Experts
12.2 Discussion Guide
12.3 Knowledge Store: Marketsandmarkets� Subscription Portal
12.4 Introducing RT: Real-Time Market Intelligence
12.5 Available Customizations
12.6 Related Reports
12.7 Author Details
List of Tables (79 Tables)
Table 1 Utility Asset Management Market Snapshot
Table 2 Top Twelve Utilities Investing in Distributed Power Generation
Table 3 Market, By Application, 2015�2022 (USD Million)
Table 4 Transformers: Market, By Region, 2015�2022 (USD Million)
Table 5 Substations: Market, By Region, 2015�2022 (USD Million)
Table 6 T&D Lines: Market Size, By Region, 2015�2022 (USD Million)
Table 7 Market, By Component, 2015�2022 (USD Million)
Table 8 Hardware: Market Size, By Type, 2015�2022 (USD Million)
Table 9 Hardware: Market Size, By Region, 2015�2022 (USD Million)
Table 10 Sensors: Market Size, By Region, 2015�2022 (USD Million)
Table 11 Infrared Cameras: Market Size, By Region, 2015�2022 (USD Million)
Table 12 Others: Market Size, By Region, 2015�2022 (USD Million)
Table 13 Software: Market Size, By Type 2015�2022 (USD Million)
Table 14 Software: Utiltiy Asset Management Market Size, By Region, 2015�2022 (USD Million)
Table 15 Equipment/Component Management: Utiltiy Asset Management Market Size, By Region, 2015�2022 (USD Million)
Table 16 Performance Management: Market Size, By Region, 2015�2022 (USD Million)
Table 17 Production Management: Market Size, By Region, 2015�2022 (USD Million)
Table 18 Market Size, By Utility Type, 2015�2022 (USD Million)
Table 19 Public Utility: Market Size, By Region, 2015�2022 (USD Million)
Table 20 Private Utility: Market Size, By Region, 2015�2022 (USD Million)
Table 21 Utility Asset Management Market, By Region 2015�2022 (USD Million)
Table 22 North America: Market Size, By Component, 2015�2022 (USD Million)
Table 23 North America: Market Size, By Hardware, 2015�2022 (USD Million)
Table 24 North America: Market Size, By Software, 2015�2022 (USD Million)
Table 25 North America: Market Size, By Application, 2015�2022 (USD Million)
Table 26 North America: Market Size, By Utility Type, 2015�2022 (USD Million)
Table 27 North America: Market Size, By Country, 2015�2022 (USD Million)
Table 28 The US: Utiltiy Asset Management Market Size, By Component, 2015�2022 (USD Million)
Table 29 Canada: Market Size, By Component, 2015�2022 (USD Million)
Table 30 Mexico: Market Size, By Component, 2015�2022 (USD Million)
Table 31 Europe: Market Size, By Component, 2015�2022 (USD Million)
Table 32 Europe: Market Size, By Hardware, 2015�2022 (USD Million)
Table 33 Europe: Market Size, By Software, 2015�2022 (USD Million)
Table 34 Europe: Market Size, By Application, 2015�2022 (USD Million)
Table 35 Europe: Market Size, By Utility Type 2015�2022 (USD Million)
Table 36 Europe: Market Size, By Country, 2015�2022 (USD Million)
Table 37 Germany: Market Size, By Component, 2015�2022 (USD Million)
Table 38 Denmark: Market Size, By Component, 2015�2022 (USD Million)
Table 39 The UK: Market Size, By Component, 2015�2022 (USD Million)
Table 40 France: Market Size, By Component, 2015�2022 (USD Million)
Table 41 Italy: Market Size, By Component, 2015�2022 (USD Million)
Table 42 Spain: Market Size, By Component, 2015�2022 (USD Million)
Table 43 Norway: Market Size, By Component, 2015�2022 (USD Million)
Table 44 The Rest of Europe: Market Size, By Component, 2015�2022 (USD Million)
Table 45 Asia Pacific: Market Size, By Component, 2015�2022 (USD Million)
Table 46 Asia Pacific: Market Size, By Hardware, 2015�2022 (USD Million)
Table 47 Asia Pacific: Market Size, By Software, 2015�2022 (USD Million)
Table 48 Asia Pacific: Utiltiy Asset Management Market Size, By Application, 2015�2022 (USD Million)
Table 49 Asia Pacific: Market Size, By Utility Type, 2015�2022 (USD Million)
Table 50 Asia Pacific: Market Size, By Country, 2015�2022 (USD Million)
Table 51 Australia: Market Size, By Component, 2015�2022 (USD Million)
Table 52 South Korea: Market Size, By Component, 2015�2022 (USD Million)
Table 53 Japan: Market Size, By Component, 2015�2022 (USD Million)
Table 54 China: Market Size, By Component, 2015�2022 (USD Million)
Table 55 India: Market Size, By Component, 2015�2022 (USD Million)
Table 56 The Rest of Asia Pacific: Market Size, By Component, 2015�2022 (USD Million)
Table 57 Middle East & Africa: Market Size, By Component, 2015�2022 (USD Million)
Table 58 Middle East & Africa: Market Size, By Hardware, 2015�2022 (USD Million)
Table 59 Middle East & Africa: Market Size, By Software, 2015�2022 (USD Million)
Table 60 Middle East & Africa: Market Size, By Country, 2015�2022 (USD Million)
Table 61 Middle East & Africa: Utiltiy Asset Management Market Size, By Application, 2015�2022 (USD Million)
Table 62 Middle East & Africa: Market Size, By Utility Type, 2015�2022 (USD Million)
Table 63 Saudi Arabia: Market Size, By Component, 2015�2022 (USD Million)
Table 64 UAE: Market, By Component, 2015�2022 (USD Million)
Table 65 Iran: Market, By Component, 2015�2022 (USD Million)
Table 66 Kuwait: Market, By Component, 2015�2022 (USD Million)
Table 67 South Africa: Market, By Component, 2015�2022 (USD Million)
Table 68 Qatar: Market, By Component, 2015�2022 (USD Million)
Table 69 The Rest of the Middle East & Africa: Utiltiy Asset Management Market Size, By Component, 2015�2022 (USD Million)
Table 70 South America: Market Size, By Component, 2015�2022 (USD Million)
Table 71 South America: Market Size, By Hardware, 2015�2022 (USD Million)
Table 72 South America: Market Size, By Software, 2015�2022 (USD Million)
Table 73 South America: Utiltiy Asset Management Market Size, By Application, 2015�2022 (USD Million)
Table 74 South America: Market Size, By Utility Type, 2015�2022 (USD Million)
Table 75 South America: Market Size, By Country, 2015�2022 (USD Million)
Table 76 Brazil: Market Size, By Component, 2015�2022 (USD Million)
Table 77 Argentina: Market, By Component, 2015�2022 (USD Million)
Table 78 The Rest of South America: Market Size, By Component, 2015�2022 (USD Million)
Table 79 Market Ranking, 2016
List of Figures (32 Figures)
Figure 1 Research Design
Figure 2 Bottom-Up Approach
Figure 3 Top-Down Approach
Figure 4 Data Triangulation Methodology
Figure 5 North America is Estimated to Hold the Largest Share of the Utility Asset Management Market in 2017
Figure 6 The Hardware Segment is Expected to Lead the Utility Asset Management Market in 2017
Figure 7 The Sensors Sub-Segment of the Hardware Segment is Expected to Grow at the Highest CAGR During the Forecast Period
Figure 8 The Public Utility Segment is Expected to Lead the Utility Asset Management Market During the Forecast Period
Figure 9 Attractive Opportunities in the Utility Asset Management Market, 2017�2022
Figure 10 Region-Wise Comparision of the Estimated and Forecast Market Sizes
Figure 11 The Hardware Component Segment is Expected to Grow at Faster Rate During the Forecast Period
Figure 12 The Equipment/Component Management Sub-Segment is Expected to Lead the Software Segment of the Utility Asset Management Market in 2017
Figure 13 Among Applications the Transformers Segment is Expected to Grow at the Highest CAGR From 2017 to 2022
Figure 14 The US Held the Largest Share of the North American Utility Asset Management Market in 2016
Figure 15 Increasing Focus on Distributed Generation is Expected to Drive the Utility Asset Management Market
Figure 16 Capital Cost of Distributed Generation Technologies (2015�2040)
Figure 17 Smart Grid Analytics Market Size, By Region, 2016�2019 (USD Million)
Figure 18 Supply Chain Analysis: Utility Asset Management Market
Figure 19 Utility Asset Management Market, By Application, 2017�2022 (USD Million)
Figure 20 Utility Asset Management System Market, By Component, 2015�2022 (USD Million)
Figure 21 The Public Utility Segment is Expected to Hold the Larger Market Share During the Forecast Period
Figure 22 Regional Snapshot: CAGRs of the Markets in Important Countries, 2017�2022
Figure 23 North America: Market Snapshot
Figure 24 Asia Pacific: Market Snapshot
Figure 25 Companies Adopted New Product & Technology Launches & Contracts & Agreements as Key Growth Strategies, 2014�2017
Figure 26 Market Evaluation Framework, 2014�2017
Figure 27 Battle for Market Share (2014�2017): Contracts & Agreements Was the Key Strategy Adopted By Players in the Market
Figure 28 ABB Ltd: Company Snapshot
Figure 29 Siemens AG: Company Snapshot
Figure 30 General Electric Company: Company Snapshot
Figure 31 Emerson Electric Co.: Company Snapshot
Figure 32 Vaisala OYJ: Company Snapshot


Growth opportunities and latent adjacency in Utility Asset Management Market