Unsaturated Polyester Resins Market

Unsaturated Polyester Resins Market by Type (Ortho phthalic, Isophthalic & DCPD), End-Use Industry (Building & Construction, Marine, Transportation, Pipes & Tanks, Artificial Stone, Wind Energy, Electrical & Electronics) & Region - Global Forecast to 2026

Report Code: CH 1348 Sep, 2021, by marketsandmarkets.com

Unsaturated Polyester Resins Market

The global unsaturated polyester resins market was valued at USD 9.6 billion in 2021 and is projected to reach USD 12.9 billion by 2026, growing at a cagr 6.1% from 2021 to 2026. The demand and use of UPRs is rapidly increasing due to the growth in industries such as building & construction, transportation, pipes & tanks and wind energy especially in the APAC region.

Unsaturated Polyester Resins Market Size, Share

To know about the assumptions considered for the study, Request for Free Sample Report

COVID-19 Impact on the Global Unsaturated Polyester Resin Market

COVID-19 has made a significant economic impact on various financial as well as industrial sectors, such as travel and tourism, manufacturing, and aviation. The worst economic recession is expected during 2020-2021, according to World Bank and IMF. With the increasing number of countries imposing and extending lockdowns, economic activities are declining, impacting the global economy.

In the recent past, the global economy became substantially more interconnected. The adverse consequences of various steps related to the containment of COVID-19 are evident from global supply chain disruptions, weaker demand for imported products and services, and an increase in the unemployment rate. Risk aversion has increased in the financial market, with all-time low interest rates and sharp declines in equity and commodity prices. Consumer and business confidence have also reduced significantly.

Unsaturated Polyester Resin Market Dynamics

Driver: High growth in Building & Construction, and Wind Energy industries

One of the most significant drivers impacting growth of the UPRs market is the growth of end-use industries. The ever-increasing need for better performance across all modern applications is driving the demand for UPRs. UPRs have varied advantages such as low price and fast curing time against conventionally used epoxy resin. Their usage during the manufacturing process improves energy efficiency and reduces costs by about 35% to 40%.

Restraint: Greater acceptance of other similar resins

The acceptance of epoxy, vinyl ester, acrylic, and polyurethane resins is becoming a restraint for the growth of the UPRs market. Epoxy resins are used to manufacture adhesives, coatings, casting materials, and composites among others. They offer high strength, low shrinkage, and good adhesion similar to UPR. Vinyl ester is another variety of resin whose corrosion resistance, mechanical, and thermal properties are much better than that of UPRs.

Opportunity: Emerging economies and their future growth.

Emerging economies are investing in the infrastructural development and long-term construction projects which is the largest industry for UPR. China, India, Brazil, and countries in the Middle Eastern region are likely to increase their expenses in the infrastructure segment. The estimated overall growth rate of APAC in infrastructural segment is 11.2% in which 80% contribution will be from China, India, Japan, Australia, and South Korea.

Challenge: Disadvantages of styrene usage

One of the biggest challenges faced by the UPRs market is the usage of styrene during its manufacturing process. As styrene is mainly utilized in the manufacture of UPRs, there is an increasing demand for creating an alternative to styrene in the UPRs industry. This challenge can be overcome by developing a monomer free UPRs to reduce VOC emissions. Many companies are researching on this technology to reduce styrene content and hence lower the emissions.

Orthophthalic resin type accounted for the largest share of the unsaturated polyester resins market.

Orthophthalic resin are most used UPR resin because its known as basic resin and used as general purpose resin. Orthophthalic resins are the most popular resins in the marine industry. They have different properties, such as high flexibility and good tensile strength. Orthophthalic resins are also used in various other applications such as adhesives, buttons, castings, composites, encapsulation, flooring materials, gelcoats, filler pastes, pigment pastes, polymer concrete, putties, and tooling. The variety of usage is making it the preferred resin type.

Pipes & tanks is the second-largest end-use industry of unsaturated polyester resins market in 2021.

The low-price advantage of UPRs over other epoxy and PVC materials has also assisted the growth of the global UPRs market. There is a significant rise in the use of FRP in pipes, tanks, pressure vessels, and cylinders due to its low weight. The wide application of UPR is promoting the growth in pipes & tanks industry.  APAC is expected to be the most promising market due to the increased use of FRP pipes in Australia, India, and China. Rapid industrialization and urbanization have led to increased demand for UPRs.

APAC is the largest unsaturated polyester resins market in the forecast period

APAC has emerged as one of the leading producers as well as consumers of unsaturated polyester resin. In India, low-cost labor, government initiatives, such as Make in India, and the proposed scheme on entrepreneurship development may open up opportunities in the industrial and infrastructure segments.  China is a rapidly developing nation with many emerging applications. The country also offers inexpensive raw materials, low cost of production, and the ability to cater to the local emerging markets. It is witnessing increased demand from the various growing end-use industry.

The spread of COVID-19 started in China in early January 2020. Within a small period, the virus spread to other Asian countries, such as Japan, India, South Korea, and Thailand, resulting in a  rapidly increasing number of positive cases and deaths. The pandemic situation led national governments across APAC to announce lockdowns, leading to a decrease in traffic and temporary closure of construction & mining activities, manufacturing industries, and others. Since China is a global manufacturing hub, it was significantly impacted by the COVID-19 pandemic; this in turn had an adverse effect on the UPRs market in APAC in 2020.

Unsaturated Polyester Resins Market by Region

Unsaturated Polyester Resins Market Players

The key players operating in the market are Polynt-Reichhold Group (US), INEOS Group (UK), Royal DSM (The Netherlands), AOC (US), and BASF SE (Germany).

Unsaturated Polyester Resins Market Report Scope

Report Metric

Details

Market Size Value in 2021

USD 9.6 billion

Revenue Forecast in 2026

USD 12.9 billion

CAGR

6.1%

Years considered for the study

2017-2026

Base year

2020

Forecast period

2021–2026

Units considered

Value (USD) and Volume (Kiloton)

Segments

By Type
By End-use Industry
By Region

Regions covered

APAC, Europe, North & Central America, South America, and the Middle East & Africa

Companies profiled

The major market players are Polynt-Reichhold Group (US), INEOS Group (UK), Royal DSM (The Netherlands), AOC (US), and BASF SE (Germany) (Total of 20 companies)

This research report categorizes the unsaturated polyester resin market based on type, end-use industry, and region.

By Type:

  • Orthophthalic resin
  • Isophthalic resin
  • Dicyclopentadiene (DCPD)
  • Others (Gelcoat resin, Terephthalic resin, & Chlorendic resin)

By End-use Industry:

  • Building & Construction
  • Marine
  • Transportation
  • Pipes & Tanks
  • Electrical & Electronics
  • Wind Energy
  • Artificial Stones
  • Others (Gel coats, chemical industry, decorative art, non-structural furniture parts, consumer goods, industrial, healthcare, and sporting goods.)

By Region:

  • APAC
  • Europe
  • North & Central America
  • South America
  • The Middle East & Africa

Recent Developments

  • In February 2020, INEOS introduced a new low-profile resin for the recreational vehicle markets and marine in North America. Aropol LP 67400 is designed to offer high strength and robust processing capabilities that boat builders and RV manufacturers desire
  • In July 2020, Ashland announced a definitive agreement to sell maleic anhydride business to AOC Materials. Maleic Anhydride is a common raw material to produce UPR. So, this deal will help them to expand its product range in unsaturated polyester resins.

Frequently Asked Questions (FAQs)

  • What is the current size of the global unsaturated polyester resin market?
  • The global unsaturated polyester resin market is estimated to be USD 9.6 billion n 2021 and projected to reach USD 12.9 billion by 2026, at a CAGR of 6.1%
  • Who are the major players of unsaturated polyester resin market?
  • Companies such as Polynt-Reichhold Group (US), INEOS Group (UK), Royal DSM (The Netherlands), AOC (US), and BASF SE (Germany) are the major players in the market.
  • Where will all these developments take the industry in the mid-to-long term?
  • Continuous developments in the market, including new product launches, mergers & acquisitions, investments & expansions, and partnership and agreement are expected to help the market grow. New product launch and merger & acquisition are the key strategies adopted by companies operating in this market.
  • Which segment has the potential to register the highest market share for unsaturated polyester resin?
  • Building & construction is the largest end-use industry segment, in terms of both value and volume, in 2020.
  • Which is the fastest-growing region in the market?
  • APAC is projected to be the fastest-growing market for unsaturated polyester resin during the forecast period. Easy availability of raw materials at competitive prices and cheap labor force have made APAC the biggest market for UPRs. Global manufacturers are increasingly setting up their production plants in the region in a bid to ramp up production and increase sales. The major end-use industries of UPRs are building & construction, transportation, pipes & tanks, and wind energy.

Frequently Asked Questions (FAQ):


To speak to our analyst for a discussion on the above findings, click Speak to Analyst


TABLE OF CONTENTS

1 INTRODUCTION (Page No. - 36)
    1.1 OBJECTIVES OF THE STUDY
    1.2 MARKET DEFINITION
    1.3 MARKET SCOPE
           1.3.1 MARKETS COVERED
                    FIGURE 1 UNSATURATED POLYESTER RESINS: MARKET SEGMENTATION
                    TABLE 1 INCLUSIONS AND EXCLUSIONS
           1.3.2 YEARS CONSIDERED FOR THE STUDY
    1.4 CURRENCY
    1.5 PACKAGE SIZE
    1.6 STAKEHOLDERS
    1.7 SUMMARY OF CHANGES

2 RESEARCH METHODOLOGY (Page No. - 40)
    2.1 RESEARCH DATA
           FIGURE 2 UNSATURATED POLYESTER RESINS MARKET: RESEARCH DESIGN
    2.2 SECONDARY DATA
           2.2.1 KEY DATA FROM SECONDARY SOURCES
    2.3 PRIMARY DATA
           2.3.1 KEY DATA FROM PRIMARY SOURCES
           2.3.2 KEY INDUSTRY INSIGHTS
           2.3.3 BREAKDOWN OF PRIMARY INTERVIEWS
                    2.3.3.1 Primary data sources
    2.4 MARKET SIZE ESTIMATION
           2.4.1 BOTTOM-UP APPROACH
                    FIGURE 3 MARKET SIZE ESTIMATION: BOTTOM-UP APPROACH
           2.4.2 TOP-DOWN APPROACH
                    FIGURE 4 MARKET SIZE ESTIMATION: TOP-DOWN APPROACH
    2.5 DATA TRIANGULATION
           FIGURE 5 UNSATURATED POLYESTER RESINS MARKET: DATA TRIANGULATION
    2.6 ASSUMPTIONS
    2.7 RISK ANALYSIS ASSESSMENT
    2.8 LIMITATIONS
    2.9 GROWTH RATE ASSUMPTIONS/GROWTH FORECAST

3 EXECUTIVE SUMMARY (Page No. - 49)
    TABLE 2 UNSATURATED POLYESTER RESINS MARKET SNAPSHOT, 2021 VS. 2026
    FIGURE 6 ORTHOPTHALIC RESIN SEGMENT DOMINATED MARKET IN 2020
    FIGURE 7 BUILDING & CONSTRUCTION END-USE INDUSTRY LED MARKET IN 2020
    FIGURE 8 APAC TO BE FASTEST-GROWING MARKET

4 PREMIUM INSIGHTS (Page No. - 52)
    4.1 ATTRACTIVE OPPORTUNITIES IN UNSATURATED POLYESTER RESINS MARKET
           FIGURE 9 UNSATURATED POLYESTER RESINS MARKET TO WITNESS MODERATE GROWTH BETWEEN 2021 AND 2026
    4.2 UNSATURATED POLYESTER RESINS MARKET, BY END-USE INDUSTRY
    4.3 APAC: UNSATURATED POLYESTER RESINS MARKET, BY END-USE INDUSTRY AND COUNTRY, 2020
           FIGURE 10 APAC ACCOUNTED FOR LARGEST MARKET SHARE
    4.4 UNSATURATED POLYESTER RESINS MARKET: DEVELOPED VS. DEVELOPING COUNTRIES
           FIGURE 11 UNSATURATED POLYESTER RESINS MARKET TO WITNESS HIGHER GROWTH IN DEVELOPING COUNTRIES
    4.5 UNSATURATED POLYESTER RESINS MARKET: GROWING DEMAND FROM APAC
           FIGURE 12 INDIA TO REGISTER HIGHEST CAGR IN APAC MARKET
    4.6 UNSATURATED POLYESTER RESINS MARKET, BY MAJOR COUNTRIES
           FIGURE 13 INDIA TO BE THE FASTEST GROWING MARKET BETWEEN 2021 AND 2026

5 MARKET OVERVIEW (Page No. - 55)
    5.1 INTRODUCTION
    5.2 MARKET DYNAMICS
           FIGURE 14 DRIVERS, RESTRAINTS, OPPORTUNITIES, AND CHALLENGES IN UNSATURATED POLYESTER RESINS MARKET
           5.2.1 DRIVERS
                    5.2.1.1 High growth in construction and wind energy industries
                               FIGURE 15 CUMULATIVE GROWTH IN GLOBAL WIND CAPACITY, 2015–2020
                    5.2.1.2 Growth in FRP, automotive, and composite manufacturing industries
                    5.2.1.3 Economical advantages over other resins
           5.2.2 RESTRAINTS
                    5.2.2.1 Greater acceptance of other resins
                    5.2.2.2 Properties of unsaturated polyester resins change with its quality
           5.2.3 OPPORTUNITIES
                    5.2.3.1 Emerging economies and their future growth
                    5.2.3.2 Innovation in applications and products
           5.2.4 CHALLENGES
                    5.2.4.1 Disadvantages of styrene usage
    5.3 PORTER’S FIVE FORCES ANALYSIS
           FIGURE 16 UNSATURATED POLYESTER RESINS MARKET: PORTER’S FIVE FORCES ANALYSIS
           TABLE 3 PORTER’S FIVE FORCES ANALYSIS
           5.3.1 THREAT OF NEW ENTRANT
           5.3.2 BARGAINING POWER OF SUPPLIERS
           5.3.3 BARGAINING POWER OF BUYERS
           5.3.4 THREAT OF SUBSTITUTES
           5.3.5 INTENSITY OF COMPETITIVE RIVALRY
    5.4 MACROECONOMIC OVERVIEW AND KEY TRENDS
           5.4.1 INTRODUCTION
           5.4.2 TRENDS AND FORECAST OF GDP
                    TABLE 4 GDP PERCENTAGE CHANGE OF KEY COUNTRIES, 2018–2025
    5.5 COVID-19 IMPACT
           5.5.1 COVID-19 ECONOMIC ASSESSMENT
                    FIGURE 17 WORLD ECONOMIC OUTLOOK GROWTH PROJECTIONS
           5.5.2 COVID-19 ECONOMIC IMPACT – SCENARIO ASSESSMENT
                    FIGURE 18 FACTORS IMPACTING ECONOMY OF SELECT G20 COUNTRIES IN 2020
                    FIGURE 19 PRE-COVID AND POST-COVID GROWTH SCENARIOS
    5.6 EXPORT-IMPORT TRADE STATISTICS
           5.6.1 TRADE SCENARIO 2016-2020
                    TABLE 5 COUNTRY-WISE EXPORT DATA, 2016–2020
                    TABLE 6 COUNTRY-WISE IMPORT DATA, 2016–2020
    5.7 AVERAGE SELLING PRICE ANALYSIS
           FIGURE 20 AVERAGE SELLING PRICE OF UNSATURATED POLYESTER RESINS, BY REGION
    5.8 PATENTS ANALYSIS
           5.8.1 METHODOLOGY
           5.8.2 PUBLICATION TRENDS
                    FIGURE 21 NUMBER OF PATENTS PUBLISHED, 2016–2021
           5.8.3 PATENTS ANALYSIS BY JURISDICTION
                    FIGURE 22 PATENTS PUBLISHED BY EACH JURISDICTION, 2016–2021
           5.8.4 TOP APPLICANTS
                    FIGURE 23 PATENTS PUBLISHED BY MAJOR APPLICANTS, 2016–2021
                    TABLE 7 RECENT PATENTS BY COMPANIES
    5.9 REGULATIONS
           5.9.1 REACH (REGISTRATION, EVALUATION, AUTHORISATION AND RESTRICTION OF CHEMICALS) ACT 2007
           5.9.2 THE DANGEROUS SUBSTANCES DIRECTIVE 67/548 EEC GOVERNS THE CLASSIFICATION, PACKAGING AND LABELLING OF DANGEROUS SUBSTANCES
           5.9.3 COUNCIL DIRECTIVE 1999/13/EC OF 11 MARCH 1999 ON THE LIMITATION OF EMISSIONS OF VOLATILE ORGANIC COMPOUNDS, RESULTING FROM THE USE OF ORGANIC SOLVENTS IN CERTAIN ACTIVITIES AND INSTALLATIONS. (VOC DIRECTIVE)
    5.10 CASE STUDY ANALYSIS
    5.11 TECHNOLOGY ANALYSIS
    5.12 VALUE CHAIN ANALYSIS
           FIGURE 24 UNSATURATED POLYESTER RESINS MARKET: VALUE CHAIN ANALYSIS
    5.13 UNSATURATED POLYESTER RESINS ECOSYSTEM
           TABLE 8 UNSATURATED POLYESTER RESINS ECOSYSTEM

6 UNSATURATED POLYESTER RESINS MARKET, BY TYPE (Page No. - 78)
    6.1 INTRODUCTION
           TABLE 9 UNSATURATED POLYESTER RESINS MARKET SIZE, BY TYPE, 2017–2020 (USD MILLION)
           TABLE 10 MARKET SIZE, BY TYPE, 2021–2026 (USD MILLION)
           TABLE 11 MARKET SIZE, BY TYPE, 2017–2020 (KILOTON)
           TABLE 12 MARKET SIZE, BY TYPE, 2021–2026 (KILOTON)
           TABLE 13 UNSATURATED POLYESTER RESIN TYPES: COMPARISON OF PROPERTIES
    6.2 ORTHOPHTHALIC RESINS
           6.2.1 MOST USED RESIN TYPE BECAUSE OF ITS LOW PRICE
                    TABLE 14 ORTHOPHTHALIC UNSATURATED POLYESTER RESINS MARKET SIZE, BY REGION, 2017–2020 (USD MILLION)
                    TABLE 15 ORTHOPHTHALIC MARKET SIZE, BY REGION, 2021–2026 (USD MILLION)
                    TABLE 16 ORTHOPHTHALIC MARKET SIZE, BY REGION, 2017–2020 (KILOTON)
                    TABLE 17 ORTHOPHTHALIC MARKET SIZE, BY REGION, 2021–2026 (KILOTON)
    6.3 ISOPHTHALIC RESINS
           6.3.1 TO CAPTURE THE MARKET OF ORTHOPHATHALIC RESIN DUE TO ADVANCED PROPERTIES
                    TABLE 18 ISOPHTHALIC UNSATURATED POLYESTER RESINS MARKET SIZE, BY REGION, 2017–2020 (USD MILLION)
                    TABLE 19 ISOPHTHALIC MARKET SIZE, BY REGION, 2021–2026 (USD MILLION)
                    TABLE 20 ISOPHTHALIC MARKET SIZE, BY REGION, 2017–2020 (KILOTON)
                    TABLE 21 ISOPHTHALIC MARKET SIZE, BY REGION, 2021–2026 (KILOTON)
    6.4 DICYCLOPENTADIENE (DCPD) RESINS
           6.4.1 LOW STYRENE LEVELS AND INCREASING GOVERNMENT REGULATIONS ON LOWER VOCS TO SUPPORT DEMAND
                    TABLE 22 DCPD RESINS VS. ORTHOPHTHALIC RESINS: COMPARISON OF PROPERTIES
                    TABLE 23 DCPD UNSATURATED POLYESTER RESINS MARKET SIZE, BY REGION, 2017–2020 (USD MILLION)
                    TABLE 24 DCPD  MARKET SIZE, BY REGION, 2021–2026 (USD MILLION)
                    TABLE 25 DCPD UNSATURAMARKET SIZE, BY REGION, 2017–2020 (KILOTON)
                    TABLE 26 DCPD UNSATURA MARKET SIZE, BY REGION, 2021–2026 (KILOTON)
    6.5 OTHER RESINS
           6.5.1 GELCOAT RESINS
           6.5.2 TEREPHTHALIC RESINS
           6.5.3 CHLORENDIC RESINS
                    TABLE 27 OTHER UNSATURATED POLYESTER RESINS MARKET SIZE, BY REGION, 2017–2020 (USD MILLION)
                    TABLE 28 OTHER  MARKET SIZE, BY REGION, 2021–2026 (USD MILLION)
                    TABLE 29 OTHER  MARKET SIZE, BY REGION, 2017–2020 (KILOTON)
                    TABLE 30 OTHER MARKET SIZE, BY REGION, 2021–2026 (KILOTON)

7 UNSATURATED POLYESTER RESINS MARKET, BY END-USE INDUSTRY (Page No. - 89)
    7.1 INTRODUCTION
           TABLE 31 UNSATURATED POLYESTER RESINS MARKET SIZE, BY END-USE INDUSTRY, 2017–2020 (USD MILLION)
           TABLE 32 MARKET SIZE, BY END-USE INDUSTRY, 2021–2026 (USD MILLION)
           TABLE 33 MARKET SIZE, BY END-USE INDUSTRY, 2017–2020 (KILOTON)
           TABLE 34 MARKET SIZE, BY END-USE INDUSTRY, 2021–2026 (KILOTON)
    7.2 BUILDING & CONSTRUCTION
           7.2.1 INCREASING URBANIZATION, RISING STANDARDS OF LIVING AND INCOME, AND GOVERNMENT POLICIES FOR CONSTRUCTION OF NEW HOUSES TO SUPPORT MARKET GROWTH
                    TABLE 35 ADVANTAGES OF FRP IN CONSTRUCTION
                    TABLE 36 BUILDING & CONSTRUCTION MARKET SIZE IN UNSATURATED POLYESTER RESINS, BY REGION, 2017–2020 (USD MILLION)
                    TABLE 37 BUILDING & CONSTRUCTION MARKET SIZE , BY REGION, 2021–2026 (USD MILLION)
                    TABLE 38 BUILDING & CONSTRUCTION MARKET SIZE , BY REGION, 2017–2020 (KILOTON)
                    TABLE 39 BUILDING & CONSTRUCTION MARKET SIZE, BY REGION, 2021–2026 (KILOTON)
    7.3 MARINE
           7.3.1 IMPROVED SURFACE QUALITY AND DURABILITY OF FRP MATERIALS
                    TABLE 40 MARINE MARKET SIZE IN UNSATURATED POLYESTER RESINS, BY REGION, 2017–2020 (USD MILLION)
                    TABLE 41 MARINE MARKET SIZE, BY REGION, 2021–2026 (USD MILLION)
                    TABLE 42 MARINE MARKET SIZE, BY REGION, 2017–2020 (KILOTON)
                    TABLE 43 MARINE MARKET SIZE, BY REGION, 2021–2026 (KILOTON)
    7.4 TRANSPORTATION
           7.4.1 INCREASED HIGH-SPEED RAIL NETWORK IN CHINA TO SUPPORT HIGH DEMAND
                    FIGURE 25 GLOBAL PRODUCTION OF VEHICLES IN 2019 AND 2020
                    TABLE 44 TRANSPORTATION MARKET SIZE IN UNSATURATED POLYESTER RESINS, BY REGION, 2017–2020 (USD MILLION)
                    TABLE 45 TRANSPORTATION MARKET SIZE, BY REGION, 2021–2026 (USD MILLION)
                    TABLE 46 TRANSPORTATION MARKET SIZE, BY REGION, 2017–2020 (KILOTON)
                    TABLE 47 TRANSPORTATION MARKET SIZE, BY REGION, 2021–2026 (KILOTON)
    7.5 PIPES & TANKS
           7.5.1 SUPERIOR MECHANICAL PROPERTIES OF FRP PIPES GENERATING HIGH DEMAND
                    TABLE 48 PIPES & TANKS MARKET SIZE IN UNSATURATED POLYESTER RESINS, BY REGION, 2017–2020 (USD MILLION)
                    TABLE 49 PIPES & TANKS MARKET SIZE, BY REGION, 2021–2026 (USD MILLION)
                    TABLE 50 PIPES & TANKS MARKET SIZE, BY REGION, 2017–2020 (KILOTON)
                    TABLE 51 PIPES & TANKS MARKET SIZE, BY REGION, 2021–2026 (KILOTON)
    7.6 ELECTRICAL & ELECTRONICS
           7.6.1 LARGE CONSUMER ELECTRONICS MARKET IN CHINA, JAPAN, AND INDIA TO BOOST MARKET
                    FIGURE 26 GROWTH IN ELECTRONICS INDUSTRY
                    TABLE 52 ELECTRICAL & ELECTRONICS MARKET SIZE IN UNSATURATED POLYESTER RESINS, BY REGION, 2017–2020 (USD MILLION)
                    TABLE 53 ELECTRICAL & ELECTRONICS MARKET SIZE, BY REGION, 2021–2026 (USD MILLION)
                    TABLE 54 ELECTRICAL & ELECTRONICS MARKET SIZE, BY REGION, 2017–2020 (KILOTON)
                    TABLE 55 ELECTRICAL & ELECTRONICS MARKET SIZE, BY REGION, 2021–2026 (KILOTON)
    7.7 WIND ENERGY
           7.7.1 SIGNIFICANT DEMAND IN MANUFACTURING MATERIAL OF WIND BLADES
                    FIGURE 27 WIND ENERGY MARKET FORECAST, BY REGION, 2020–2025
                    TABLE 56 WIND ENERGY MARKET SIZE IN UNSATURATED POLYESTER RESINS, BY REGION, 2017–2020 (USD MILLION)
                    TABLE 57 WIND ENERGY MARKET SIZE, BY REGION, 2021–2026 (USD MILLION)
                    TABLE 58 WIND ENERGY MARKET SIZE , BY REGION, 2017–2020 (KILOTON)
                    TABLE 59 WIND ENERGY MARKET SIZE , BY REGION, 2021–2026 (KILOTON)
    7.8 ARTIFICIAL STONES
           7.8.1 INCREASING DEMAND FOR DECORATIVE PRODUCTS IN ARTIFICIAL STONE INDUSTRY
                    TABLE 60 ARTIFICIAL STONES MARKET SIZE IN UNSATURATED POLYESTER RESINS, BY REGION, 2017–2020 (USD MILLION)
                    TABLE 61 ARTIFICIAL STONES MARKET SIZE , BY REGION, 2021–2026 (USD MILLION)
                    TABLE 62 ARTIFICIAL STONES MARKET SIZE , BY REGION, 2017–2020 (KILOTON)
                    TABLE 63 ARTIFICIAL STONES MARKET SIZE , BY REGION, 2021–2026 (KILOTON)
    7.9 OTHERS
           TABLE 64 OTHERS MARKET SIZEUNSATURATED POLYESTER RESINS, BY REGION, 2017–2020 (USD MILLION)
           TABLE 65 OTHERS MARKET SIZE, BY REGION, 2021–2026 (USD MILLION)
           TABLE 66 OTHERS MARKET SIZE, BY REGION, 2017–2020 (KILOTON)
           TABLE 67 OTHERS MARKET SIZE,  BY REGION, 2021–2026 (KILOTON)

8 UNSATURATED POLYESTER RESINS MARKET, BY REGION (Page No. - 110)
    8.1 INTRODUCTION
           TABLE 68 UNSATURATED POLYESTER RESINS, BY REGION, 2017–2020 (USD MILLION)
           TABLE 69 MARKET SIZE, BY REGION, 2021–2026 (USD MILLION)
           TABLE 70  BY REGION, 2017–2020 (KILOTON)
           TABLE 71 MARKET SIZE, BY REGION, 2021–2026 (KILOTON)
    8.2 APAC
           8.2.1 IMPACT OF COVID-19 ON APAC
                    FIGURE 28 APAC: UNSATURATED POLYESTER RESINS MARKET SNAPSHOT
                    TABLE 72 APAC: MARKET SIZE, BY COUNTRY, 2017–2020 (USD MILLION)
                    TABLE 73 APAC: MARKET SIZE, BY COUNTRY, 2021–2026 (USD MILLION)
                    TABLE 74 APAC: MARKET SIZE, BY COUNTRY, 2017–2020 (KILOTON)
                    TABLE 75 APAC: MARKET SIZE, BY COUNTRY, 2021–2026 (KILOTON)
                    TABLE 76 APAC: MARKET SIZE, BY TYPE, 2017–2020 (USD MILLION)
                    TABLE 77 APAC: MARKET SIZE, BY TYPE, 2021–2026 (USD MILLION)
                    TABLE 78 APAC: MARKET SIZE, BY TYPE, 2017–2020 (KILOTON)
                    TABLE 79 APAC: MARKET SIZE, BY TYPE, 2021–2026 (KILOTON)
                    TABLE 80 APAC: MARKET SIZE, BY END-USE INDUSTRY, 2017–2020 (USD MILLION)
                    TABLE 81 APAC: MARKET SIZE, BY END-USE INDUSTRY, 2021–2026 (USD MILLION)
                    TABLE 82 APAC: MARKET SIZE, BY END-USE INDUSTRY, 2017–2020 (KILOTON)
                    TABLE 83 APAC: MARKET SIZE, BY END-USE INDUSTRY, 2021–2026 (KILOTON)
                    8.2.1.1 China
                               8.2.1.1.1 Growing end-use industries to drive market
                                            TABLE 84 CHINA: MARKET SIZE, BY TYPE, 2017–2020 (USD MILLION)
                                            TABLE 85 CHINA: MARKET SIZE, BY TYPE, 2021–2026 (USD MILLION)
                                            TABLE 86 CHINA: MARKET SIZE, BY TYPE, 2017–2020 (KILOTON)
                                            TABLE 87 CHINA: MARKET SIZE, BY TYPE, 2021–2026 (KILOTON)
                    8.2.1.2 Japan
                               8.2.1.2.1 Dominance in construction industry challenged by emerging APAC countries
                                            TABLE 88 JAPAN: UNSATURATED POLYESTER RESINS MARKET SIZE, BY TYPE, 2017–2020 (USD MILLION)
                                            TABLE 89 JAPAN: MARKET SIZE, BY TYPE, 2021–2026 (USD MILLION)
                                            TABLE 90 JAPAN: MARKET SIZE, BY TYPE, 2017–2020 (KILOTON)
                                            TABLE 91 JAPAN: MARKET SIZE, BY TYPE, 2021–2026 (KILOTON)
                    8.2.1.3 South Korea
                               8.2.1.3.1 Automotive and electronics industries to support market growth
                                            TABLE 92 SOUTH KOREA: UNSATURATED POLYESTER RESINS MARKET SIZE, BY TYPE, 2017–2020 (USD MILLION)
                                            TABLE 93 SOUTH KOREA: MARKET SIZE, BY TYPE, 2021–2026 (USD MILLION)
                                            TABLE 94 SOUTH KOREA: MARKET SIZE, BY TYPE, 2017–2020 (KILOTON)
                                            TABLE 95 SOUTH KOREA: MARKET SIZE, BY TYPE, 2021–2026 (KILOTON)
                    8.2.1.4 Malaysia
                               8.2.1.4.1 Huge auto manufacturing hub to boost demand
                                            TABLE 96 MALAYSIA: UNSATURATED POLYESTER RESINS MARKET SIZE, BY TYPE, 2017–2020 (USD MILLION)
                                            TABLE 97 MALAYSIA: MARKET SIZE, BY TYPE, 2021–2026 (USD MILLION)
                                            TABLE 98 MALAYSIA: MARKET SIZE, BY TYPE, 2017–2020 (KILOTON)
                                            TABLE 99 MALAYSIA: MARKET SIZE, BY TYPE, 2021–2026 (KILOTON)
                    8.2.1.5 India
                               8.2.1.5.1 Government initiatives to help grow end-use industries
                                            TABLE 100 INDIA: UNSATURATED POLYESTER RESINS MARKET SIZE, BY TYPE, 2017–2020 (USD MILLION)
                                            TABLE 101 INDIA: MARKET SIZE, BY TYPE, 2021–2026 (USD MILLION)
                                            TABLE 102 INDIA: MARKET SIZE, BY TYPE, 2017–2020 (KILOTON)
                                            TABLE 103 INDIA: MARKET SIZE, BY TYPE, 2021–2026 (KILOTON)
                    8.2.1.6 Thailand
                               8.2.1.6.1 Growing industry to positively boost demand
                                            TABLE 104 THAILAND: UNSATURATED POLYESTER RESINS MARKET SIZE, BY TYPE, 2017–2020 (USD MILLION)
                                            TABLE 105 THAILAND: MARKET SIZE, BY TYPE, 2021–2026 (USD MILLION)
                                            TABLE 106 THAILAND: MARKET SIZE, BY TYPE, 2017–2020 (KILOTON)
                                            TABLE 107 THAILAND: MARKET SIZE, BY TYPE, 2021–2026 (KILOTON)
                    8.2.1.7 Indonesia
                               8.2.1.7.1 Recovering after severely affected by impact of COVID-19
                                            TABLE 108 INDONESIA: UNSATURATED POLYESTER RESINS MARKET SIZE, BY TYPE, 2017–2020 (USD MILLION)
                                            TABLE 109 INDONESIA: MARKET SIZE, BY TYPE, 2021–2026 (USD MILLION)
                                            TABLE 110 INDONESIA: MARKET SIZE, BY TYPE, 2017–2020 (KILOTON)
                                            TABLE 111 INDONESIA: MARKET SIZE, BY TYPE, 2021–2026 (KILOTON)
                    8.2.1.8 Rest of APAC
                               TABLE 112 REST OF APAC: UNSATURATED POLYESTER RESINS MARKET SIZE, BY TYPE, 2017–2020 (USD MILLION)
                               TABLE 113 REST OF APAC: MARKET SIZE, BY TYPE, 2021–2026 (USD MILLION)
                               TABLE 114 REST OF APAC: MARKET SIZE, BY TYPE, 2017–2020 (KILOTON)
                               TABLE 115 REST OF APAC: MARKET SIZE, BY TYPE, 2021–2026 (KILOTON)
    8.3 NORTH & CENTRAL AMERICA
           FIGURE 29 NORTH & CENTRAL AMERICA: UNSATURATED POLYESTER RESINS MARKET SNAPSHOT
           TABLE 116 NORTH & CENTRAL AMERICA: MARKET SIZE, BY TYPE, 2017–2020 (USD MILLION)
           TABLE 117 NORTH & CENTRAL AMERICA: MARKET SIZE, BY TYPE, 2021–2026 (USD MILLION)
           TABLE 118 NORTH & CENTRAL AMERICA: MARKET SIZE, BY TYPE, 2017–2020 (KILOTON)
           TABLE 119 NORTH & CENTRAL AMERICA: MARKET SIZE, BY TYPE, 2021–2026 (KILOTON)
           TABLE 120 NORTH & CENTRAL AMERICA: MARKET SIZE, BY END-USE INDUSTRY, 2017–2020 (USD MILLION)
           TABLE 121 NORTH & CENTRAL AMERICA: MARKET SIZE, BY END-USE INDUSTRY, 2021–2026 (USD MILLION)
           TABLE 122 NORTH & CENTRAL AMERICA: MARKET SIZE, BY END-USE INDUSTRY, 2017–2020 (KILOTON)
           TABLE 123 NORTH & CENTRAL AMERICA: MARKET SIZE, BY END-USE INDUSTRY, 2021–2026 (KILOTON)
           8.3.1 NORTH AMERICA
           8.3.2 IMPACT OF COVID-19 ON NORTH AMERICA
                    TABLE 124 NORTH AMERICA: UNSATURATED POLYESTER RESINS MARKET SIZE, BY COUNTRY, 2017–2020 (USD MILLION)
                    TABLE 125 NORTH AMERICA: MARKET SIZE, BY COUNTRY, 2021–2026 (USD MILLION)
                    TABLE 126 NORTH AMERICA: MARKET SIZE, BY COUNTRY, 2017–2020 (KILOTON)
                    TABLE 127 NORTH AMERICA: MARKET SIZE, BY COUNTRY, 2021–2026 (KILOTON)
                    TABLE 128 NORTH AMERICA: MARKET SIZE, BY TYPE, 2017–2020 (USD MILLION)
                    TABLE 129 NORTH AMERICA: MARKET SIZE, BY TYPE, 2021–2026 (USD MILLION)
                    TABLE 130 NORTH AMERICA: MARKET SIZE, BY TYPE, 2017–2020 (KILOTON)
                    TABLE 131 NORTH AMERICA: MARKET SIZE, BY TYPE, 2021–2026 (KILOTON)
                    8.3.2.1 US
                               8.3.2.1.1 Largest unsaturated polyester resins market in North American
                                            TABLE 132 US: UNSATURATED POLYESTER RESINS MARKET SIZE, BY TYPE, 2017–2020 (USD MILLION)
                                            TABLE 133 US: MARKET SIZE, BY TYPE, 2021–2026 (USD MILLION)
                                            TABLE 134 US:  MARKET SIZE, BY TYPE, 2017–2020 (KILOTON)
                                            TABLE 135 US: MARKET SIZE, BY TYPE, 2021–2026 (KILOTON)
                    8.3.2.2 Canada
                               8.3.2.2.1 Growing innovation to positively influence the demand
                                            TABLE 136 CANADA: UNSATURATED POLYESTER RESINS MARKET SIZE, BY TYPE, 2017–2020 (USD MILLION)
                                            TABLE 137 CANADA: MARKET SIZE, BY TYPE, 2021–2026 (USD MILLION)
                                            TABLE 138 CANADA: MARKET SIZE, BY TYPE, 2017–2020 (KILOTON)
                                            TABLE 139 CANADA: MARKET SIZE, BY TYPE, 2021–2026 (KILOTON)
                    8.3.2.3 Mexico
                               8.3.2.3.1 Low-cost manufacturing to play a key role in driving the market
                                            TABLE 140 MEXICO: UNSATURATED POLYESTER RESINS MARKET SIZE, BY TYPE, 2017–2020 (USD MILLION)
                                            TABLE 141 MEXICO: MARKET SIZE, BY TYPE, 2021–2026 (USD MILLION)
                                            TABLE 142 MEXICO: MARKET SIZE, BY TYPE, 2017–2020 (KILOTON)
                                            TABLE 143 MEXICO: MARKET SIZE, BY TYPE, 2021–2026 (KILOTON)
           8.3.3 CENTRAL AMERICA
                    8.3.3.1 Impact of COVID-19 on Central America
                               TABLE 144 CENTRAL AMERICA: UNSATURATED POLYESTER RESINS MARKET SIZE, BY COUNTRY, 2017–2020 (USD MILLION)
                               TABLE 145 CENTRAL AMERICA: MARKET SIZE, BY COUNTRY, 2021–2026 (USD MILLION)
                               TABLE 146 CENTRAL AMERICA: MARKET SIZE, BY COUNTRY, 2017–2020 (KILOTON)
                               TABLE 147 CENTRAL AMERICA: MARKET SIZE, BY COUNTRY, 2021–2026 (KILOTON)
                               TABLE 148 CENTRAL AMERICA: MARKET SIZE, BY TYPE, 2017–2020 (USD MILLION)
                               TABLE 149 CENTRAL AMERICA: MARKET SIZE, BY TYPE, 2021–2026 (USD MILLION)
                               TABLE 150 CENTRAL AMERICA: MARKET SIZE, BY TYPE, 2017–2020 (KILOTON)
                               TABLE 151 CENTRAL AMERICA: MARKET SIZE, BY TYPE, 2021–2026 (KILOTON)
                    8.3.3.2 Guatemala
                               8.3.3.2.1 Increase in rules and regulations in the country helping the industries to grow
                    8.3.3.3 Costa Rica
                               8.3.3.3.1 Expected to recover the economy from downfall due to COVID-19
                    8.3.3.4 EL Salvador
                               8.3.3.4.1 Government initiatives promoting the growth in construction sector
                    8.3.3.5 Honduras
                               8.3.3.5.1 Growing automotive industry to increase demand
                    8.3.3.6 Rest of Central America
    8.4 EUROPE
           8.4.1 IMPACT OF COVID-19 ON EUROPE
                    FIGURE 30 EUROPE: UNSATURATED POLYESTER RESINS MARKET SNAPSHOT
                    TABLE 152 EUROPE: MARKET SIZE, BY COUNTRY, 2017–2020 (USD MILLION)
                    TABLE 153 EUROPE: MARKET SIZE, BY COUNTRY, 2021–2026 (USD MILLION)
                    TABLE 154 EUROPE: MARKET SIZE, BY COUNTRY, 2017–2020 (KILOTON)
                    TABLE 155 EUROPE: MARKET SIZE, BY COUNTRY, 2021–2026 (KILOTON)
                    TABLE 156 EUROPE: MARKET SIZE, BY TYPE, 2017–2020 (USD MILLION)
                    TABLE 157 EUROPE: MARKET SIZE, BY TYPE, 2021–2026 (USD MILLION)
                    TABLE 158 EUROPE: MARKET SIZE, BY TYPE, 2017–2020 (KILOTON)
                    TABLE 159 EUROPE: MARKET SIZE, BY TYPE, 2021–2026 (KILOTON)
                    TABLE 160 EUROPE: MARKET SIZE, BY END-USE INDUSTRY, 2017–2020 (USD MILLION)
                    TABLE 161 EUROPE: MARKET SIZE, BY END-USE INDUSTRY, 2021–2026 (USD MILLION)
                    TABLE 162 EUROPE: MARKET SIZE, BY END-USE INDUSTRY, 2017–2020 (KILOTON)
                    TABLE 163 EUROPE: MARKET SIZE, BY END-USE INDUSTRY, 2021–2026 (KILOTON)
                    8.4.1.1 Germany
                               8.4.1.1.1 Industrial production hub and largest unsaturated polyester resins consumer in Europe
                                            TABLE 164 GERMANY: UNSATURATED POLYESTER RESINS MARKET SIZE, BY TYPE, 2017–2020 (USD MILLION)
                                            TABLE 165 GERMANY: MARKET SIZE, BY TYPE, 2021–2026 (USD MILLION)
                                            TABLE 166 GERMANY: MARKET SIZE, BY TYPE, 2017–2020 (KILOTON)
                                            TABLE 167 GERMANY: MARKET SIZE, BY TYPE, 2021–2026 (KILOTON)
                    8.4.1.2 France
                               8.4.1.2.1 Moderate growth in end-use industries to boost market
                                            TABLE 168 FRANCE: UNSATURATED POLYESTER RESINS MARKET SIZE, BY TYPE, 2017–2020 (USD MILLION)
                                            TABLE 169 FRANCE: MARKET SIZE, BY TYPE, 2021–2026 (USD MILLION)
                                            TABLE 170 FRANCE: MARKET SIZE, BY TYPE, 2017–2020 (KILOTON)
                                            TABLE 171 FRANCE: MARKET SIZE, BY TYPE, 2021–2026 (KILOTON)
                    8.4.1.3 Italy
                               8.4.1.3.1 Increasing automobile production and exports to drive demand
                                            TABLE 172 ITALY: UNSATURATED POLYESTER RESINS MARKET SIZE, BY TYPE, 2017–2020 (USD MILLION)
                                            TABLE 173 ITALY: MARKET SIZE, BY TYPE, 2021–2026 (USD MILLION)
                                            TABLE 174 ITALY: MARKET SIZE, BY TYPE, 2017–2020 (KILOTON)
                                            TABLE 175 ITALY: MARKET SIZE, BY TYPE, 2021–2026 (KILOTON)
                    8.4.1.4 UK
                               8.4.1.4.1 Prestige image of UK-based companies helping market growth
                                            TABLE 176 UK: UNSATURATED POLYESTER RESINS MARKET SIZE, BY TYPE, 2017–2020 (USD MILLION)
                                            TABLE 177 UK: MARKET SIZE, BY TYPE, 2021–2026 (USD MILLION)
                                            TABLE 178 UK: MARKET SIZE, BY TYPE, 2017–2020 (KILOTON)
                                            TABLE 179 UK: MARKET SIZE, BY TYPE, 2021–2026 (KILOTON)
                    8.4.1.5 Russia
                               8.4.1.5.1 Initiatives for advancement in different sectors to drive market
                                            TABLE 180 RUSSIA: UNSATURATED POLYESTER RESINS MARKET SIZE, BY TYPE, 2017–2020 (USD MILLION)
                                            TABLE 181 RUSSIA: MARKET SIZE, BY TYPE, 2021–2026 (USD MILLION)
                                            TABLE 182 RUSSIA: MARKET SIZE, BY TYPE, 2017–2020 (KILOTON)
                                            TABLE 183 RUSSIA: MARKET SIZE, BY TYPE, 2021–2026 (KILOTON)
                    8.4.1.6 Spain
                               8.4.1.6.1 Large automotive sector to positively influence market
                                            TABLE 184 SPAIN: UNSATURATED POLYESTER RESINS MARKET SIZE, BY TYPE, 2017–2020 (USD MILLION)
                                            TABLE 185 SPAIN: MARKET SIZE, BY TYPE, 2021–2026 (USD MILLION)
                                            TABLE 186 SPAIN: MARKET SIZE, BY TYPE, 2017–2020 (KILOTON)
                                            TABLE 187 SPAIN: MARKET SIZE, BY TYPE, 2021–2026 (KILOTON)
                    8.4.1.7 Rest of Europe
                               TABLE 188 REST OF EUROPE: UNSATURATED POLYESTER RESINS MARKET SIZE, BY TYPE, 2017–2020 (USD MILLION)
                               TABLE 189 REST OF EUROPE: MARKET SIZE, BY TYPE, 2021–2026 (USD MILLION)
                               TABLE 190 REST OF EUROPE: MARKET SIZE, BY TYPE, 2017–2020 (KILOTON)
                               TABLE 191 REST OF EUROPE: MARKET SIZE, BY TYPE, 2021–2026 (KILOTON)
    8.5 SOUTH AMERICA
           8.5.1 IMPACT OF COVID-19 ON SOUTH AMERICA
                    TABLE 192 SOUTH AMERICA: UNSATURATED POLYESTER RESINS MARKET SIZE, BY COUNTRY, 2017–2020 (USD MILLION)
                    TABLE 193 SOUTH AMERICA: MARKET SIZE, BY COUNTRY, 2021–2026 (USD MILLION)
                    TABLE 194 SOUTH AMERICA: MARKET SIZE, BY COUNTRY, 2017–2020 (KILOTON)
                    TABLE 195 SOUTH AMERICA: MARKET SIZE, BY COUNTRY, 2021–2026 (KILOTON)
                    TABLE 196 SOUTH AMERICA: MARKET SIZE, BY TYPE, 2017–2020 (USD MILLION)
                    TABLE 197 SOUTH AMERICA: MARKET SIZE, BY TYPE, 2021–2026 (USD MILLION)
                    TABLE 198 SOUTH AMERICA: MARKET SIZE, BY TYPE, 2017–2020 (KILOTON)
                    TABLE 199 SOUTH AMERICA: MARKET SIZE, BY TYPE, 2021–2026 (KILOTON)
                    TABLE 200 SOUTH AMERICA: MARKET SIZE, BY END-USE INDUSTRY, 2017–2020 (USD MILLION)
                    TABLE 201 SOUTH AMERICA: MARKET SIZE, BY END-USE INDUSTRY, 2021–2026 (USD MILLION)
                    TABLE 202 SOUTH AMERICA: MARKET SIZE, BY END-USE INDUSTRY, 2017–2020 (KILOTON)
                    TABLE 203 SOUTH AMERICA: MARKET SIZE, BY END-USE INDUSTRY, 2021–2026 (KILOTON)
                    8.5.1.1 Brazil
                    8.5.1.1.1 Emerging economy and growth in automotive industry to fuel the market
                                            TABLE 204 BRAZIL: UNSATURATED POLYESTER RESINS MARKET SIZE, BY TYPE, 2017–2020 (USD MILLION)
                                            TABLE 205 BRAZIL: MARKET SIZE, BY TYPE, 2021–2026 (USD MILLION)
                                            TABLE 206 BRAZIL: MARKET SIZE, BY TYPE, 2017–2020 (KILOTON)
                                            TABLE 207 BRAZIL: MARKET SIZE, BY TYPE, 2021–2026 (KILOTON)
                    8.5.1.2 Argentina
                               8.5.1.2.1 Less friendly foreign investment restricting market growth
                                            TABLE 208 ARGENTINA: UNSATURATED POLYESTER RESINS MARKET SIZE, BY TYPE, 2017–2020 (USD MILLION)
                                            TABLE 209 ARGENTINA: MARKET SIZE, BY TYPE, 2021–2026 (USD MILLION)
                                            TABLE 210 ARGENTINA: MARKET SIZE, BY TYPE, 2017–2020 (KILOTON)
                                            TABLE 211 ARGENTINA: MARKET SIZE, BY TYPE, 2021–2026 (KILOTON)
                    8.5.1.3 Rest of South America
                               TABLE 212 REST OF SOUTH AMERICA: MARKET SIZE, BY TYPE, 2017–2020 (USD MILLION)
                               TABLE 213 REST OF SOUTH AMERICA: MARKET SIZE, BY TYPE, 2021–2026 (USD MILLION)
                               TABLE 214 REST OF SOUTH AMERICA: MARKET SIZE, BY TYPE, 2017–2020 (KILOTON)
                               TABLE 215 REST OF SOUTH AMERICA: MARKET SIZE, BY TYPE, 2021–2026 (KILOTON)
    8.6 MIDDLE EAST & AFRICA
           8.6.1 COVID-19 IMPACT ON MIDDLE EAST & AFRICA
                    TABLE 216 MIDDLE EAST & AFRICA: UNSATURATED POLYESTER RESINS MARKET SIZE, BY COUNTRY, 2017–2020 (USD MILLION)
                    TABLE 217 MIDDLE EAST & AFRICA: MARKET SIZE, BY COUNTRY, 2021–2026 (USD MILLION)
                    TABLE 218 MIDDLE EAST & AFRICA: MARKET SIZE, BY COUNTRY, 2017–2020 (KILOTON)
                    TABLE 219 MIDDLE EAST & AFRICA: MARKET SIZE, BY COUNTRY, 2021–2026 (KILOTON)
                    TABLE 220 MIDDLE EAST & AFRICA: MARKET SIZE, BY TYPE, 2017–2020 (USD MILLION)
                    TABLE 221 MIDDLE EAST & AFRICA: MARKET SIZE, BY TYPE, 2021–2026 (USD MILLION)
                    TABLE 222 MIDDLE EAST & AFRICA: MARKET SIZE, BY TYPE, 2017–2020 (KILOTON)
                    TABLE 223 MIDDLE EAST & AFRICA: MARKET SIZE, BY TYPE, 2021–2026 (KILOTON)
                    TABLE 224 MIDDLE EAST & AFRICA: MARKET SIZE, BY END-USE INDUSTRY, 2017–2020 (USD MILLION)
                    TABLE 225 MIDDLE EAST & AFRICA: MARKET SIZE, BY END-USE INDUSTRY, 2021–2026 (USD MILLION)
                    TABLE 226 MIDDLE EAST & AFRICA: MARKET SIZE, BY END-USE INDUSTRY, 2017–2020 (KILOTON)
                    TABLE 227 MIDDLE EAST & AFRICA: MARKET SIZE, BY END-USE INDUSTRY, 2021–2026 (KILOTON)
                    8.6.1.1 UAE
                               8.6.1.1.1 Government initiatives toward promoting local players boosting demand
                                            TABLE 228 UAE: UNSATURATED POLYESTER RESINS MARKET SIZE, BY TYPE, 2017–2020 (USD MILLION)
                                            TABLE 229 UAE:  MARKET SIZE, BY TYPE, 2021–2026 (USD MILLION)
                                            TABLE 230 UAE: MARKET SIZE, BY TYPE, 2017–2020 (KILOTON)
                                            TABLE 231 UAE: MARKET SIZE, BY TYPE, 2021–2026 (KILOTON)
                    8.6.1.2 Africa
                               8.6.1.2.1 Automotive industry to boost demand
                                            TABLE 232 AFRICA: UNSATURATED POLYESTER RESINS MARKET SIZE, BY TYPE, 2017–2020 (USD MILLION)
                                            TABLE 233 AFRICA: MARKET SIZE, BY TYPE, 2021–2026 (USD MILLION)
                                            TABLE 234 AFRICA: MARKET SIZE, BY TYPE, 2017–2020 (KILOTON)
                                            TABLE 235 AFRICA: MARKET SIZE, BY TYPE, 2021–2026 (KILOTON)
                    8.6.1.3 Saudi Arabia
                               8.6.1.3.1 Downfall in construction industry because of increase in restrictions and social distancing norms
                                            TABLE 236 SAUDI ARABIA: UNSATURATED POLYESTER RESINS MARKET SIZE, BY TYPE, 2017–2020 (USD MILLION)
                                            TABLE 237 SAUDI ARABIA: MARKET SIZE, BY TYPE, 2021–2026 (USD MILLION)
                                            TABLE 238 SAUDI ARABIA: MARKET SIZE, BY TYPE, 2017–2020 (KILOTON)
                                            TABLE 239 SAUDI ARABIA: MARKET SIZE, BY TYPE, 2021–2026 (KILOTON)
                    8.6.1.4 Rest of Middle East & Africa
                               TABLE 240 REST OF MIDDLE EAST & AFRICA: UNSATURATED POLYESTER RESINS MARKET SIZE, BY TYPE, 2017–2020 (USD MILLION)
                               TABLE 241 REST OF MIDDLE EAST & AFRICA: MARKET SIZE, BY TYPE, 2021–2026 (USD MILLION)
                               TABLE 242 REST OF MIDDLE EAST & AFRICA: MARKET SIZE, BY TYPE, 2017–2020 (KILOTON)
                               TABLE 243 REST OF MIDDLE EAST & AFRICA: MARKET SIZE, BY TYPE, 2021–2026 (KILOTON)

9 COMPETITIVE LANDSCAPE (Page No. - 192)
    9.1 OVERVIEW
           9.1.1 OVERVIEW OF STRATEGIES ADOPTED BY KEY UNSATURATED POLYESTER RESIN PLAYERS
    9.2 COMPETITIVE EVALUATION MATRIX
           TABLE 244 INDUSTRY FOOTPRINT OF COMPANIES
           TABLE 245 REGION FOOTPRINT OF COMPANIES
           TABLE 246 COMPANY FOOTPRINT
    9.3 UNSATURATED POLYESTER RESINS MARKET SHARE ANALYSIS
           FIGURE 31 UNSATURATED POLYESTER RESINS MARKET SHARE ANALYSIS, 2020
    9.4 COMPETITIVE SCENARIO AND TRENDS
           TABLE 247 UNSATURATED POLYESTER RESINS MARKET: PRODUCT LAUNCHES, 2016–2021
           TABLE 248 UNSATURATED POLYESTER RESINS MARKET: OTHERS, 2016–2021
    9.5 COMPANY EVALUATION QUADRANT
           FIGURE 32 UNSATURATED POLYESTER RESINS COMPANY EVALUATION MATRIX, 2020
           9.5.1 STARS
           9.5.2 PERVASIVE
           9.5.3 EMERGING LEADERS
           9.5.4 PARTICIPANTS
           FIGURE 33 COMPANY PRODUCT FOOTPRINT
    9.6 SME MATRIX, 2021
           9.6.1 RESPONSIVE COMPANIES
           9.6.2 PROGRESSIVE COMPANIES
           9.6.3 STARTING BLOCKS
           9.6.4 DYNAMIC COMPANIES
                    FIGURE 34 UNSATURATED POLYESTER RESINS MARKET: EMERGING COMPANIES COMPETITIVE LEADERSHIP MAPPING, 2021
    9.7 MARKET RANKING ANALYSIS
           TABLE 249 UPR: MARKET RANKING
    9.8 REVENUE ANALYSIS
           FIGURE 35 REVENUE ANALYSIS OF KEY PLAYERS, 2016–2020

10 COMPANY PROFILES (Page No. - 203)
     10.1 MAJOR COMPANIES
(Business Overview, Products Offered, Recent Developments, MnM view, Right to win, Strategic choices made, Weaknesses and competitive threats)* 
             10.1.1 POLYNT-REICHHOLD GROUP
                        TABLE 250 POLYNT-REICHHOLD GROUP: BUSINESS OVERVIEW
                        TABLE 251 POLYNT-REICHHOLD GROUP: OTHERS
             10.1.2 INEOS GROUP
                        TABLE 252 INEOS GROUP: BUSINESS OVERVIEW
                        FIGURE 36 INEOS GROUP: COMPANY SNAPSHOT
                        TABLE 253 INEOS GROUP: PRODUCT LAUNCHES
                        TABLE 254 INEOS GROUP: DEALS
             10.1.3 ROYAL DSM
                        TABLE 255 ROYAL DSM: BUSINESS OVERVIEW
                        FIGURE 37 ROYAL DSM: COMPANY SNAPSHOT
             10.1.4 AOC
                        TABLE 256 AOC: BUSINESS OVERVIEW
                        TABLE 257 AOC: DEALS
             10.1.5 BASF SE
                        TABLE 258 BASF SE: BUSINESS OVERVIEW
                        FIGURE 38 BASF SE: COMPANY SNAPSHOT
             10.1.6 ANDERCOL
                        TABLE 259 ANDERCOL: BUSINESS OVERVIEW
             10.1.7 ALFA S.A.B, DE C.V.
                        TABLE 260 ALFA S.A.B, DE C.V.: BUSINESS OVERVIEW
                        FIGURE 39 ALFA S.A.B, DE C.V.: COMPANY SNAPSHOT
             10.1.8 GRUPO QUIMICO INDUSTRIAL DE TOLUCA SA DE CV
                        TABLE 261 GRUPO QUIMCO INDUSTRIAL DE TOLUCA SA DE CV: BUSINESS OVERVIEW
             10.1.9 POLIFORMAS PLÁSTICAS, SA DE CV
                        TABLE 262 POLIFORMAS: BUSINESS OVERVIEW
             10.1.10 ALLNEX GMBH
                        TABLE 263 ALLNEX GMBH: BUSINESS OVERVIEW
     10.2 OTHER KEY COMPANIES
             10.2.1 UPC TECHNOLOGY CORP.
                        TABLE 264 UPC TECHNOLOGY CORP.: BUSINESS OVERVIEW
             10.2.2 SCOTT BADER COMPANY LTD.
                        TABLE 265 SCOTT BADER COMPANY LTD.: BUSINESS OVERVIEW
             10.2.3 BYRSA (BARNICES Y RESINAS)
                        TABLE 266 BYRSA (BARNICES Y RESINAS): BUSINESS OVERVIEW
             10.2.4 LERG SA
                        TABLE 267 LERG SA: BUSINESS OVERVIEW
                        TABLE 268 LERG SA: DEALS
             10.2.5 SHOWA DENKO K.K.
                        TABLE 269 SHOWA DENKO K.K.: BUSINESS OVERVIEW
                        TABLE 270 SHOWA DENKO K.K.: DEALS
             10.2.6 THE DOW CHEMICAL CO.
                        TABLE 271 THE DOW CHEMICAL: BUSINESS OVERVIEW
             10.2.7 ETERNAL MATERIALS CO., LTD.
                        TABLE 272 ETERNAL MATERIALS CO., LTD.: BUSINESS OVERVIEW
             10.2.8 INTERPLASTIC CORPORATION
                        TABLE 273 INTERPLASTIC CORPORATION: BUSINESS OVERVIEW
             10.2.9 SINO POLYMER
                        TABLE 274 SINO POLYMER: BUSINESS OVERVIEW
             10.2.10 QUALIPOLY CHEMICAL CORPORATION
                        TABLE 275 QUALIPOLY CHEMICAL CORPORATION: BUSINESS OVERVIEW
*Details on Business Overview, Products Offered, Recent Developments, MnM view, Right to win, Strategic choices made, Weaknesses and competitive threats might not be captured in case of unlisted companies. 

11 APPENDIX (Page No. - 239)
     11.1 INSIGHTS OF INDUSTRY EXPERTS
     11.2 DISCUSSION GUIDE
     11.3 KNOWLEDGE STORE: MARKETSANDMARKETS SUBSCRIPTION PORTAL
     11.4 AVAILABLE CUSTOMIZATIONS
     11.5 RELATED REPORTS
     11.6 AUTHOR DETAILS

Polyester Resins Market Overview

The Polyester Resins Market is a growing segment in the chemical industry. Polyester resins are a type of thermosetting polymer that is used for various applications such as coatings, adhesives, and composites. They are widely used in construction, automotive, and marine industries. The market is expected to grow due to the increasing demand from end-use industries and technological advancements.

Antimicrobial Polyester Resins are a type of polyester resins that are formulated with additives to prevent the growth of bacteria, fungi, and viruses. The market for Antimicrobial Polyester Resins is connected to the Polyester Resins Market as it offers an additional feature of protection against harmful microorganisms.

The growth of the Polyester Resins Market is expected to have a positive impact on the Antimicrobial Polyester Resins Market. As the demand for polyester resins increases, the demand for antimicrobial polyester resins will also increase. The rising concern for hygiene and safety in various end-use industries such as healthcare and food packaging will also boost the demand for antimicrobial polyester resins.

Futuristic Growth Use-Cases of Polyester Resins Market

Some of the futuristic growth use-cases of the Polyester Resins Market include the development of sustainable and biodegradable polyester resins and the use of 3D printing technology for the manufacturing of polyester resin-based products.

Top Players in Polyester Resins Market

Some of the top players in the Polyester Resins Market include BASF SE, Royal DSM N.V., Huntsman Corporation, DuPont, and Ashland Inc.

Industries Impacted by Polyester Resins Market

The Polyester Resins Market is expected to impact various other industries such as automotive, construction, marine, aerospace, and packaging. The growth of the Polyester Resins Market will lead to an increased demand for products such as coatings, adhesives, and composites, which are widely used in these industries.

Speak to our Analyst today to know more about Polyester Resins Market!

The study of global unsaturated polyester resins market involves the use of extensive secondary sources, directories, and databases such as Hoovers, Bloomberg BusinessWeek, Factiva, ICIS, and OneSource. Exhaustive secondary research was done to collect information on the market, the peer market, and the parent market. The next step was to validate these findings, assumptions, and sizing with industry experts across the value chain through primary research.

Secondary Research

Secondary sources of data include company information from annual reports, press releases, investor presentations, white papers, and articles from recognized authors and databases. In the market engineering process (which includes calculations for market statistics, market breakdown, market size estimations, market forecast, and data triangulation), both top-down and bottom-up approaches have been extensively used, along with several data triangulation methods, to gather, verify, and validate the market figures.

Primary Research

The unsaturated polyester resins market comprises several stakeholders, such as raw material suppliers,  end-product manufacturers, and regulatory organizations. The demand side of this market is characterized by the development in end-use industries, such as building & construction, marine, transportation, pipes & tanks, electrical & electronics, wind energy, and artificial stones. The supply side is characterized by advancements in technology. Various primary sources from both the supply and demand sides of the market were interviewed to obtain qualitative and quantitative information.

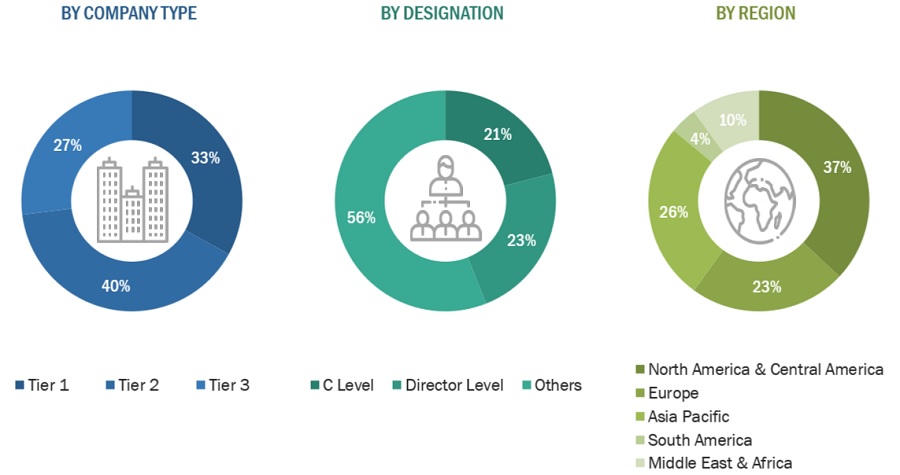
Following is the breakdown of primary respondents:

Unsaturated Polyester Resins Market Size, and Share

To know about the assumptions considered for the study, download the pdf brochure

Market Size Estimation

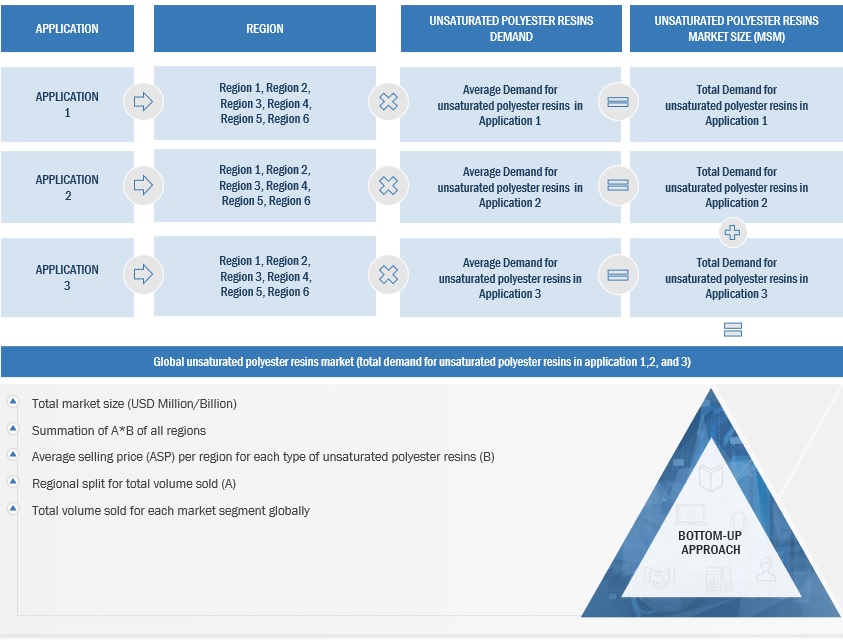
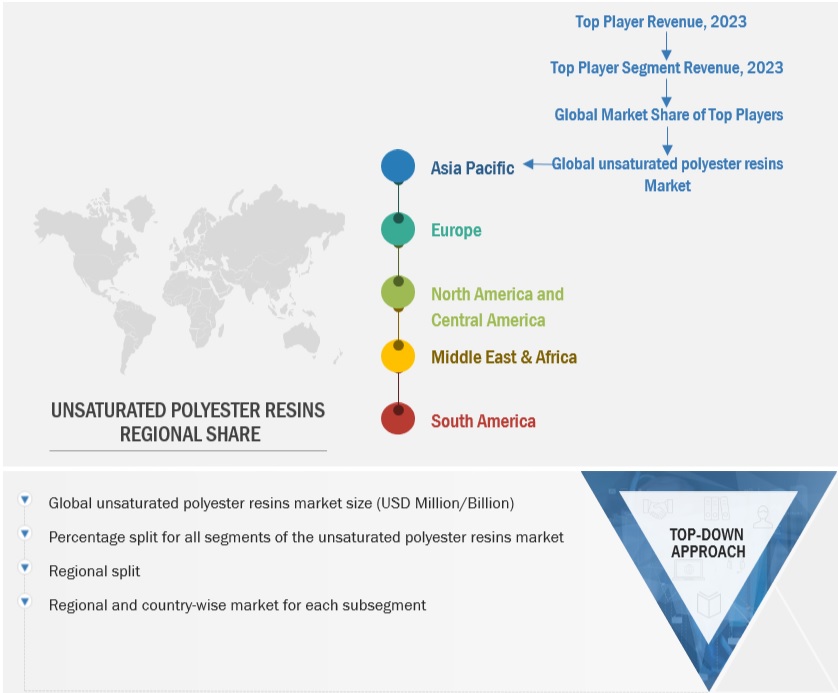
The top-down and bottom-up approaches have been used to estimate and validate the market sizes of UPRs for various end-use industries in each region. The research methodology used to estimate the market size includes the following:

  • The key players in the market have been identified through extensive secondary research.
  • The industry’s supply chain and market size, in terms of value, have been determined through primary and secondary research processes.
  • All possible parameters that affect the markets covered in this research study have been accounted for, viewed in extensive detail, verified through primary research, and analyzed to get the final quantitative and qualitative data.
  • All percentage shares, splits, and breakdowns have been determined using secondary sources and verified through primary sources.

Global Unsaturated Polyester Resins Market Size: Bottom-Up Approach

Unsaturated Polyester Resins Market Size, and Bottom-Up Approach

Data Triangulation

After arriving at the overall market size-using the market size estimation processes as explained above-the market was split into several segments and sub-segments. To complete the overall market engineering process and arrive at the exact statistics of each market segment and subsegment, the data triangulation, and market breakdown procedures were employed, wherever applicable. The data was triangulated by studying various factors and trends from both the demand and supply sides.

Report Objectives

  • To define, describe, and forecast the size of the unsaturated polyester resins (UPR) market, in terms of both value (USD million/billion) and volume (Kiloton)
  • To provide detailed information about the key factors (drivers, restraints, opportunities, and challenges) influencing the growth of the market
  • To forecast the market size by type, end-use industry, and region
  • To forecast the market size with respect to five main regions: North and Central America, Europe, APAC, the Middle East & Africa, and South America
  • To analyze the opportunities in the market for stakeholders and provide a competitive landscape for the market leaders
  • To analyze competitive developments in the market, such as new product development, and merger & acquisition.
  • To strategically profile the key players and comprehensively analyze their market shares.

Available Customizations

MarketsandMarkets offers customizations according to the specific needs of the companies with the given market data.

The following customization options are available for the report:

Product Analysis

  • Product matrix, which gives a detailed comparison of the product portfolio of each company

Regional Analysis

  • Further breakdown of the market, by country

Company Information

  • Detailed analysis and profiling of additional market players (up to five)
Custom Market Research Services

We will customize the research for you, in case the report listed above does not meet with your exact requirements. Our custom research will comprehensively cover the business information you require to help you arrive at strategic and profitable business decisions.

Request Customization

Instant Answers with GPT - Ask Now!

Ask real questions. Get complete answers !
Report Code
CH 1348
Published ON
Sep, 2021
Choose License Type
BUY NOW
  • SHARE
X
Request Customization
Speak to Analyst
Speak to Analyst
OR FACE-TO-FACE MEETING
PERSONALIZE THIS RESEARCH
  • Triangulate with your Own Data
  • Get Data as per your Format and Definition
  • Gain a Deeper Dive on a Specific Application, Geography, Customer or Competitor
  • Any level of Personalization
REQUEST A FREE CUSTOMIZATION
LET US HELP YOU!
  • What are the Known and Unknown Adjacencies Impacting the Unsaturated Polyester Resins Market
  • What will your New Revenue Sources be?
  • Who will be your Top Customer; what will make them switch?
  • Defend your Market Share or Win Competitors
  • Get a Scorecard for Target Partners
CUSTOMIZED WORKSHOP REQUEST
+1-888-600-6441
  • Call Us
  • +1-888-600-6441 (Corporate office hours)
  • +1-888-600-6441 (US/Can toll free)
  • +44-800-368-9399 (UK office hours)
CONNECT WITH US
ABOUT TRUST ONLINE
©2024 MarketsandMarkets Research Private Ltd. All rights reserved
DMCA.com Protection Status Website Feedback